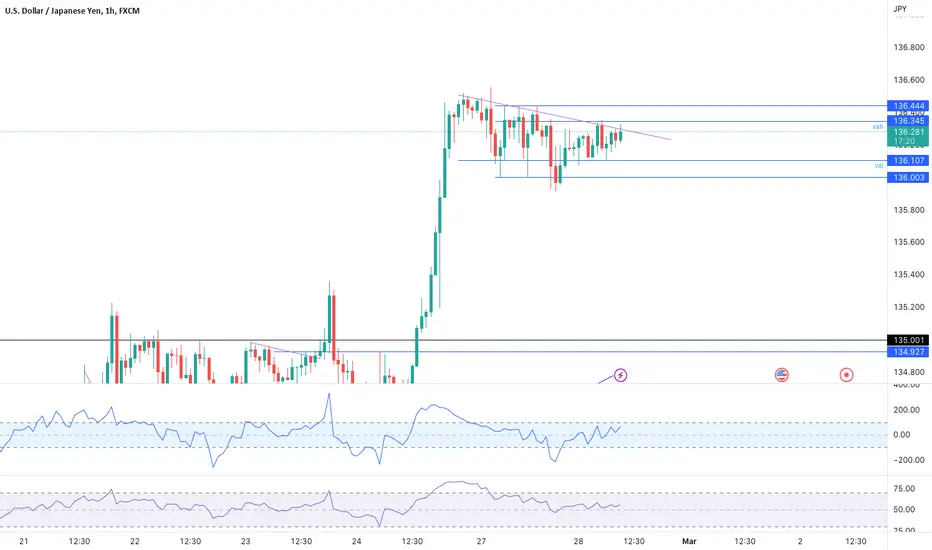
USDJPY longFX:USDJPY
As we can see in usdjpy a strong trendline breakout happend in 1hr and we can plan for buy side if it retest. plan your trade accordingly.
USDJPY

USDJPY bears appear tiring as the Fed week beginsUSDJPY marked the biggest weekly loss since early January despite trading within a one-week-long descending triangle. Apart from the bullish chart formation, sluggish MACD and nearly oversold RSI (14) also challenge the Yen pair sellers. That said, the stated triangle’s bottom line, around 131.40, acts as immediate support for the bears to watch before targeting the 78.6% Fibonacci retracement level of the February-March upside, near 130.15. In a case where the quote remains bearish past 130.15, and also breaks the 130.00 round figure, the odds of witnessing a slump towards the lows marked in February and January, respectively near 128.00 and 127.20, can’t be ruled out.
Meanwhile, a sustained break of 132.60 offers a bullish chart confirmation, which in turn suggests a theoretical target of 136.50. However, the 200 and 100 SMAs, respectively around 133.80 and 135.30, could test the USDJPY buyers. Following that, the theoretical target of 136.50 and a previous support line from early February, near 137.70, could lure the pair buyers.
Overall, USDJPY is likely bracing for recovery but the stated triangle’s resistance line, as well as the key SMAs could challenge the run-up.

USDJPY attracts bears but 200-SMA is the key supportUSDJPY marked a second consecutive weekly loss, as well as broke an ascending trend channel, as BoJ Governor Haruhiko Kuroda departs after the decade-long workmanship. The bearish break also gains attention as the quote slips beneath the 100-SMA for the first time in more than a month. However, the nearly oversold RSI and 200-SMA, around 133.30 at the latest, challenge the Yen pair’s further downside. Following that, the 50% Fibonacci retracement level of February-March advances, near 132.90, acts as the last defense of the buyers before directing sellers towards the 130.00 round figure, as well as the February 10 swing low surrounding 129.80.
Meanwhile, USDJPY recovery remains elusive unless the quote remains below the 135.65-70 resistance confluence, including the 100-SMA and the aforementioned channel’s lower line. Should the Yen pair manage to remain firmer past 135.70, the 137.00 could test the bulls before highlighting the monthly high of 137.90, the stated channel’s top line, near 139.10, and the 140.00 psychological magnet.
Overall, USDJPY is on the bear’s radar and is likely to decline further but the 200-SMA may test the further downside momentum.

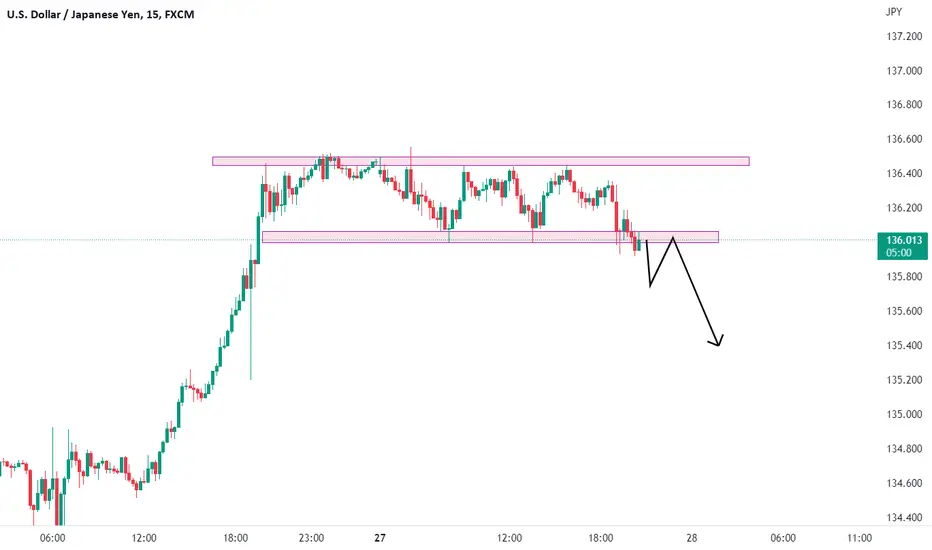
#USDJPY sell at 136.15 SL 136.34 Target 135.8 . #FOREX #CurrHello trading friends,
HOPE My posts are helping you to understand the logic.
#USDJPY sell at 136.15 SL 136.34 Target 135.8 . #FOREX #Currencypair
NOTE: Published Ideas are for ‘’EDUCATIONAL PURPOSE ONLY’’ trade at your own risk.
NOTE: RESPECT The risk. SL should not be more than 2% of the capital.
Happy Trading

usdjpy short possibleusdjpy sell @ 136.021
stop loss 137.200
target one 135.259
target two 134.118
long term target 127.100
open sell and thanks me later must use same lot in all 3 position trade is for educational purpose only not a advice

USDJPY eases from key hurdle to the north ahead of BoJ, NFPUSDJPY marked the first weekly loss in three as the key Bank of Japan (BoJ) Monetary Policy Meeting and the US Nonfarm Payrolls (NFP) looms. The Yen pair’s latest retreat could be cited as a failure to cross the 200 and 100-DMA. Adding strength to the pullback move could be the overbought RSI (14). However, the bullish MACD signals and a three-day-old ascending support line, around 134.15 by the press time, challenge the quote’s immediate downside. Following that, the 78.6% Fibonacci retracement level of the pair’s May-October 2022 run-up, near 131.75, could lure the bears before directing them to the 130.00 psychological magnet and the last January’s low, close to 127.20.
Meanwhile, the 100-DMA and the 200-DMA guard the USDJPY pair’s immediate recovery moves near 136.80 and 137.30 respectively. It’s worth noting that the risk-barometer pair’s successful run-up beyond 137.30 isn’t an open invitation to the bulls as the 50% and 38.2% Fibonacci retracement levels could challenge the further advances around 139.15 and 142.20 in that order.
Overall, USDJPY bulls are running out of steam ahead of BoJ Governor Haruhiko Kuroda’s last monetary policy show, as well as the key US jobs report for February.

USDJPY ShortFX:USDJPY
A Good Consolidation flag breakout has seen in USDJPY, if it gives breakout and retest then take entry.
plan your trade accordingly and manage your risk to reward ratio.


3 Highs setup in USDJPY. Below The Red Line!Hello Traders!
1. We see 3 consistent higher highs formed with no retracement broken .
2. Sell Below The Red Line .
3. Stop may be updated if the market breaks high before our entry is done.
4. I'll be posting a full tutorial on the 3 Highs setup during the coming weekend.
Do use proper risk management.
Happy Trading!
Profits,
Market's Mechanic.


USDJPY shorting oppurtunityUSDJPY can be shorted at the marked level for target placed and SL on chart.

USDJPY lures buyers ahead of Japan GDP, US inflationUSDJPY snapped a three-week uptrend as traders await Japan's Q4 GDP and the US Consumer Price Index (CPI) with mild losses by the end of Friday. While a U-turn from the 50-DMA played a major role in calling bears, the bulls aren’t off the table as the pair remains beyond the previous resistance line from late November, around 129.00. Even if the pair breaks the resistance-turned-support line, January’s bottom around 127.20 and May 2022 low near 126.35 will be crucial for the pair sellers to conquer before taking control. It’s worth noting that the RSI appears mostly steady and favors the trend line break out.
Alternatively, the 50-DMA surrounding 132.30 appears immediate hurdle to restrict the immediate USDJPY upside. Following that, January’s peak near 134.80 and the 200-DMA near 136.80 could act as additional challenges for the bulls to cross before approaching the driver’s seat. It should be observed that the 50% Fibonacci retracement level of the pair’s May-October 2022 upside, around 139.10, precedes the 140.00 round figure to act as the last defense of the pair bears.
Overall, USDJPY bears are less convinced ahead of the key data/events.


Symmetrical Consolidation in USDJPY.Hello Traders!
1. We have a symmetrical consolidation pattern in USDJPY on multiple tfs.
2. The consolidation appears to be more bullish than bearish.
3. PNL has been set for entry and stop levels. Stop levels may change in case stop level gets hit before the entry is done.
4. Always take a slight buffer when going towards buy side since there is pip difference in buy and sell prices.
Do use proper risk management.
Happy Trading!
Profits,
Market's Mechanic.


USDJPY Sell trade opportunitiesUSDJPY Sell trade opportunities
The pair is currently in a retracement, which provides an opportunity to sell the resistance level as we mark on the chart waiting for the market for a good entry.

#USDJPY Analysis #trend ,#Momentum,#volume pricerelation #HFHiii
dear TV
I ovserve a momentum shift in the USDJPY towards for uptrend ,
Tools i used
COCEPTS
☆ FIrst i USED Higher time Frame Analysis beacuse It dominate on lower Timeframes . All MARKER always Follows HTF
☆ I plot curve line as max wick touch with vol relation. for increase accuracy
☆ Monthly trend indicator line rule
.if price crossedup it will go UpTrend
crosseddown go DownTREND
☆ I changed vol color so we see where market maker order placed on chart
as i explain earlier marker maker buy at lower price and sell at higher ,
eg when price going lower they buy with heavy postion slowly which causes spikes in volume and price i maked on the chart .
known as wick or liquidity traped points
☆ momentum line shows shift in the Trend momentum
☆ curve drawing line for capturing exact momentum line
I used HA chart for showing momentum !
Thanks
