#USD/JPY Buy Trade Scenario.Here’s an up-to-date USD/JPY Buy trade outlook (technical + fundamental) to help you assess whether positioning for a Upside makes sense right now.
Thank You......
Usdjpyanalysis

USD/JPY Rising Wedge Forming – Watch for Possible Reversal AheadUSD/JPY is trading around 153.42 on the 4-hour chart, forming a rising wedge pattern, a structure that often signals a potential bearish reversal after an extended uptrend.
The pair has been climbing within this narrowing channel since mid-October, creating higher highs and higher lows. However, recent price action shows rejection near the upper trendline, followed by a pullback toward the lower support trendline. The 9-period SMA remains slightly upward but momentum appears to be weakening.
If price breaks below the lower wedge support near 153.00, we could see a deeper retracement toward 152.30 and 151.80. On the flip side, a strong bullish breakout above 154.50 would invalidate the wedge pattern and signal renewed buying interest, possibly targeting 155.00 and beyond.
Trading Plan:
📉 Sell below 153.00 → Targets: 152.30 / 151.80, Stop Loss: 153.70
📈 Buy above 154.50 → Targets: 155.00 / 155.40, Stop Loss: 153.90
Pattern: Rising Wedge
Bias: Cautiously Bearish unless price breaks above 154.50
Timeframe: 4H
📊 USD/JPY is approaching a critical point — stay alert for a confirmed breakout or breakdown before entering new positions.

USDJPY (Neowave Trading Idea)FX:USDJPY Namaskaram Everyone
Welcome to intelligent investor, we provide market insights by synchronising and combining all the price action waves from different time frames and gives you single trend.
Now Risk Reward is highly favourable
Trading with risk management, that is 1 percent rule with my charts.
How to Read My Charts-

USD/JPY(20250905)Today's AnalysisMarket News:
The US August "Non-Farm Payrolls" report came in at 54,000, below the expected 65,000. The previous figure was revised up from 104,000 to 106,000. Initial jobless claims rose unexpectedly to 237,000 last week, the highest level since June.
Technical Analysis:
Today's Buy/Sell Levels:
148.34
Support and Resistance Levels:
149.32
148.95
148.71
147.96
147.73
147.36
Trading Strategy:
On a breakout above 148.71, consider a buy entry, with the first target price being 148.95.
On a breakout below 148.34, consider a sell entry, with the first target price being 147.96.

USD/JPY Bullish Continuation Towards 149.00This USD/JPY (1H) chart shows a bullish setup:
Price is respecting the ascending channel (support & rejection lines).
Currently, price is near the FVG (Fair Value Gap) zone between 147.257 – 147.526, suggesting a possible retracement before continuation upward.
Both EMA 70 & EMA 200 are aligned closely, acting as dynamic support.
A long entry is expected from the FVG zone with a target point at 148.975 – 149.002.
Stop-loss lies below the FVG around 147.251.
👉 Overall bias: Bullish continuation towards 149.00 after filling the FVG.

USD/JPY) LOGN TIME Analysis Read The captionSMC trading point update
Technical analysis of USD/JPY on the daily timeframe, highlighting a long-term downtrend reversal with potential for significant upside.
---
Analysis Summary
Pair: USD/JPY
Timeframe: Daily
Current Price: 147.442
Bias: Bullish breakout from a descending wedge structure.
---
Key Technical Insights
1. Descending Trendline Break:
Price has broken above the long-term downtrend line, signaling a reversal.
Breakout area is circled in yellow, confirming bullish intent.
2. Trendline & Structure Support:
Multiple rejections from the ascending support trendline (marked by green arrows) confirm accumulation and higher lows.
3. 200 EMA as Dynamic Resistance/Support:
Price is now above the 200 EMA (147.920) — a bullish signal, turning resistance into support.
4. RSI (14):
RSI at 62.99, approaching overbought territory, but still has room to push further.
---
Target Point
Target: 158.951
Based on measured move from wedge breakout and historical resistance level.
---
Trade Setup Idea
Direction Entry Stop-Loss Target
Buy 147.40–147.60 Below 145.80 158.95
Mr SMC Trading point
---
Summary
This chart signals a major bullish breakout on USD/JPY, with the break of a year-long downtrend structure, reclaiming the 200 EMA. If this breakout sustains, price could aim for 158.95 in the coming weeks.
Please support boost 🚀 this analysis)

USD/JPY Bullish Reversal AnalysisUSD/JPY Bullish Reversal Analysis 📈💹
🔍 Technical Overview:
The chart illustrates a strong bullish reversal pattern forming on USD/JPY after price reacted from a key support zone at 144.600. This level has held firm multiple times, marked by green arrows, signaling strong buying interest.
📐 Chart Patterns & Structure:
✅ A bullish harmonic pattern (possibly a bullish Bat or Gartley) is completing near the 144.600 zone.
🔄 Multiple rejection wicks and bullish engulfing patterns indicate a potential upside reversal.
🔵 Descending trendlines have been broken, confirming momentum shift.
🔁 Previous resistance turned support (near 145.000) is acting as a possible launchpad for the next move.
🎯 Upside Target:
The projected move targets the resistance zone at 147.698, aligning with previous highs and a significant supply area.
If price breaks above 145.900 convincingly, continuation toward this resistance is expected.
🔻 Downside Risk:
A break below 144.600 would invalidate the bullish setup and expose price to the lower support range near 142.000–143.000.
📊 Conclusion:
USD/JPY is showing signs of bullish reversal from a strong demand zone. If price sustains above 145.000 and breaks the minor consolidation, the pair could rally toward 147.698 🎯.
Bias: Bullish ✅
Support: 144.600
Resistance: 147.698

USD/JPY Bullish Reversal Trade Setup – Key Support Test at 145.2Entry Point: 145.273 (highlighted in blue)
Stop Loss: ~144.817–145.260 (purple zone)
Target Point (TP): 148.133 (upper resistance zone)
📉 Recent Price Action:
Price peaked near 148.05 before reversing sharply and breaking the trendline.
The market is currently testing the support zone (near the 145.273 entry level).
Moving averages (red = short-term, blue = long-term) show a crossover to the downside, suggesting short-term bearish momentum.
📈 Trade Setup:
Strategy Type: Long (Buy) Setup
Risk/Reward: Favorable, approximately 1:2+
Entry Zone: The current price is close to the entry level at 145.273, making this a timely area to watch for a bounce or confirmation.
⚠️ Risk Factors:
If price breaks below 144.817, the setup becomes invalid.
Short-term momentum is still bearish; confirmation (like a bullish engulfing candle or support hold) is important before entering.
✅ Confirmation Triggers for Entry:
Strong bullish candlestick pattern near entry zone.
RSI or MACD bullish divergence (not shown but useful to check).
Volume spike on bounce from support.

USD/JPY 4H Chart Analysis – Bullish Breakout Ahead?📈 USD/JPY 4H Chart Analysis – Bullish Breakout Ahead? 🚀💹
The USD/JPY pair is currently approaching a critical resistance zone (145.800 - 146.000), which has acted as a strong supply area in the past. The price has shown bullish momentum as it builds higher lows and heads toward this resistance.
🔍 Key Observations:
🔵 Resistance Zone: Clearly marked and tested multiple times. A breakout above this level could trigger a bullish continuation.
📊 Bullish Structure: The pair is forming a strong uptrend with higher highs and higher lows on the 4H timeframe.
🔄 Retest Scenario: Chart suggests a potential breakout above the resistance, followed by a bullish retest before continuing toward the target zone at ~148.900.
🟢 Upside Target: 148.900 (Previous swing high) – a potential gain of over 300 pips from breakout point.
📌 Trading Outlook:
✅ A confirmed breakout and retest of the resistance zone could offer a high-probability long setup.
❌ A failure to break and hold above the resistance may result in short-term consolidation or reversal.
📅 Watch Levels:
Resistance: 145.800 – 146.000
Support (breakout retest): 145.200 – 145.500
Bullish Target: 148.900
📢 Conclusion: Bulls are in control as long as price sustains above the resistance zone. A clean breakout followed by a retest could offer an attractive buying opportunity with a well-defined risk-to-reward setup. 🔥📊

USDJPY Bearish Continuation SetupTrend Analysis
The market is in a clear downtrend, evidenced by the sequence of lower highs and lower lows.
The descending trendline has been respected multiple times, acting as dynamic resistance.
🧠 Key Technical Factors
Rejection Zone (Supply Area):
The marked “Rejection Point” aligns with the confluence of the trendline resistance, 50 EMA (red), and historical supply.
Price attempted to break above but faced a strong rejection—signaling institutional sell interest.
EMA Confluence:
50 EMA (142.993) and 200 EMA (144.063) are both sloping downward.
Price is trading below both EMAs, confirming bearish momentum and trend continuation bias.
BOS (Break of Structure):
Multiple BOS levels marked, showing a consistent pattern of structure breaks to the downside.
Each rally is met with selling pressure, failing to create new highs.
🧩 Projected Price Action
Current retracement could retest the trendline/50 EMA before a potential continuation move downward.
Expectation is a lower high formation near the descending trendline followed by a bearish impulse.
🏹 Bias: Bearish
Traders might consider short opportunities around the 142.90–143.00 zone, targeting 142.00 and below, with stops just above the trendline/supply zone.
⚠️ Risk Note
A clean break and close above the trendline and 50 EMA would invalidate this setup and could lead to a shift in structure.

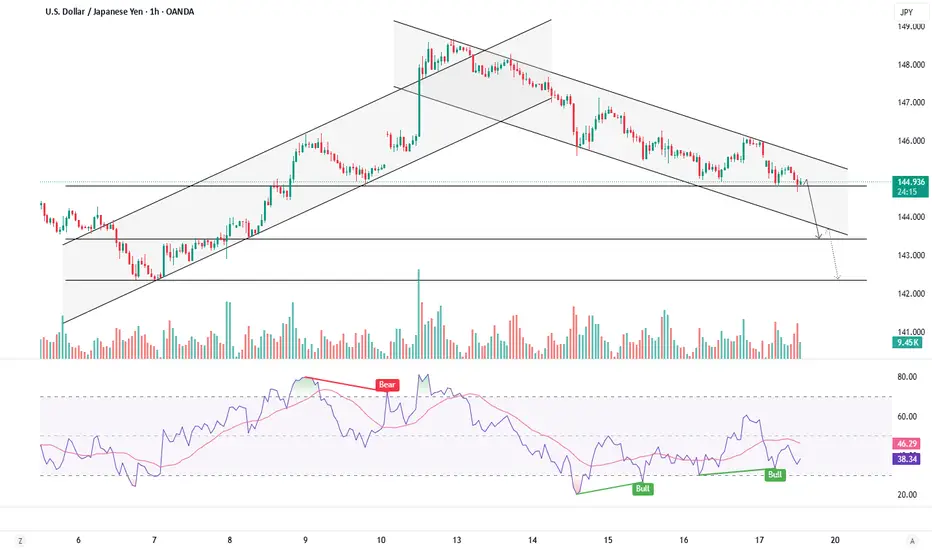
KEY SUPPORT IN FOCUS - CAN USDJPY HOLD THE LINE?Symbol - USDJPY
USDJPY is approaching a critical support level amid a prevailing local downtrend. Downward pressure on the US dollar continues to intensify, reinforcing the bearish momentum in the pair.
The US dollar index has begun to decline, which is mirrored in the weakening of USDJPY. Selling pressure is gaining momentum, and a local downtrend is clearly forming. The pair is currently testing key support at 144.82. A confirmed break below this level would likely pave the way toward lower support zones at 143.44 and 142.35, Sustained price action below 144.82 may act as a trigger for an extended sell-off.
Key Resistance levels: 145.34, 146.07
Key Support levels: 144.82, 143.44, 142.35
Both global and local trends remain bearish. The ongoing decline in the dollar may serve as an additional resistance factor, contributing to further downward momentum. A break and consolidation below the 144.82 support level would likely confirm the continuation of the bearish trend.
USD/JPY Long Trade Setup – Key Support Rebound Targeting 148.674Entry Point:
Price: 143.373
The chart suggests initiating a long (buy) position at this level, which is just slightly below the current market price.
Stop Loss:
Price: 141.707
Positioned below a strong support zone. This level protects the trade from excessive downside risk if the price breaks down.
Target Point:
Price: 148.674
The target is clearly defined, indicating a potential gain of approximately 5.991 points, or 4.20% from the entry.
🟪 Support/Resistance Zones
The purple boxes indicate demand (support) and supply (resistance) zones.
The lower zone (entry/stop area) shows a historically significant support range that has been tested multiple times (indicated with orange circles).
The upper purple zone marks the take-profit area, which coincides with previous resistance.
📊 Moving Averages
Blue Line: 200 EMA (Exponential Moving Average) – acting as dynamic resistance.
Red Line: 50 EMA – price is currently trading below it, indicating bearish short-term pressure but potential for reversal.
🧠 Trade Idea Summary
Bias: Bullish (long position)
Risk-Reward Ratio: Favorable
Risk: ~1.67 points (from 143.373 to 141.707)
Reward: ~5.3 points (from 143.373 to 148.674)
Approx. R:R = 1:3.17
Validation: The setup relies on the price holding the key support zone and bouncing higher, targeting the next major resistance.
⚠️ Considerations
Monitor for bullish candlestick patterns near the entry zone.
Keep an eye on macroeconomic news (like BoJ or Fed updates) that could cause volatility in USD/JPY.
Confirm momentum shift with RSI or MACD if using indicators.

USD/JPY Rebounds from Key Support – Eyes on 150.035 Target Support Zone:
The price is currently respecting a strong support area between 144.459 - 145.101. This zone aligns closely with the 200 EMA (145.101), increasing its validity.
EMAs:
50 EMA (146.059) is slightly above the current price.
200 EMA (145.101) is acting as dynamic support.
Price is currently trading just above the 200 EMA and below the 50 EMA — a neutral-to-bullish bias, especially since it bounced off support.
Bullish Signal:
The price has rejected the support zone and is attempting to break higher, supported by the bullish arrow projection.
Target Point:
Clearly marked at 150.035, which is a previous resistance level. This gives a potential upside of around 460 pips from the support area.
🧭 Trade Idea (if bullish bias is maintained)
Entry: Around 145.40–145.10 (current area)
Stop Loss: Below 144.459 (support base)
Take Profit: Around 150.035
Risk-Reward: ~1:3 or higher, depending on exact entry/exit.
⚠️ Caution
Watch for resistance at 146.059 (50 EMA); a clean break and retest would further confirm upside potential.
If price closes below 144.459, bullish invalidation could lead to a deeper correction

USD/JPY Bullish Setup – Demand Zone Buy Opportunity Toward 151.5🔍 Chart Overview (4H Timeframe):
Currency Pair: USD/JPY
Trend: 📈 Uptrend
EMA 70: 🔴 (144.776) – Price is trading above it = Bullish Bias
---
🟦 Demand Zone
📌 Zone: 144.804 – 146.324
💡 What it means: Strong buying interest expected here
🟢 Support line + EMA = Confluence zone!
---
✅ Entry Point:
📍 Between: 146.324 – 146.423
🎯 Best area for long (buy) position
📊 Wait for a pullback to this area before entering
---
❌ Stop Loss:
📉 Below demand zone
🔻 Range: 144.705 – 144.776
🛡️ Helps protect against unexpected drop
---
🎯 Target Point:
📈 151.500
🟩 Big reward area
🔥 Previous resistance zone = Ideal profit-taking point
---
🧭 Summary:
✅ Entry: 146.324
❌ Stop: 144.776
🎯 Target: 151.500
Risk-to-Reward: Excellent!

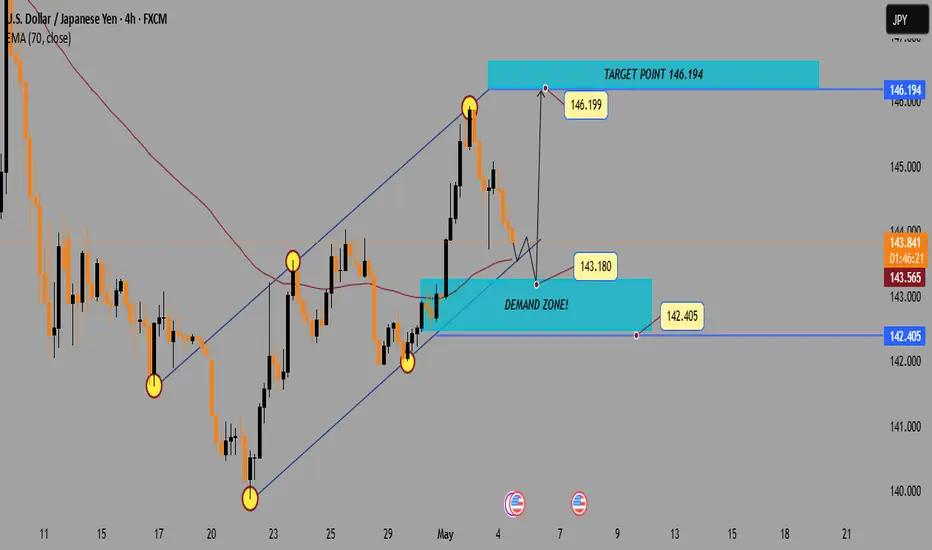
USD/JPY4H Analysis:Demand Zone ReTest Before Bullish Continuatio1. Trend Channel
🔼 Uptrend: The pair is moving inside an ascending channel.
▪️ Support: Lower boundary of the channel.
▪️ Resistance: Upper boundary of the channel.
2. Recent Price Action
🔴 Pullback: After reaching the top at 146.199, price is retracing.
📉 Price is now heading toward the Demand Zone.
3. Demand Zone
🟦 Demand Zone (142.405 – 143.180):
This zone could act as a strong support
Buyers might step in here
Watch for bullish patterns or rejections around this area
4. EMA 70
📏 EMA 70 (143.568) is slightly below current price (143.949) — this may offer temporary support/resistance.
5. Target
🎯 Target Point: 146.194
If price bounces from demand zone, this is the next bullish target.
Possible Scenario
1. 🔽 Price dips into the Demand Zone
2. 🟢 Bullish bounce → Confirm with candlestick signals
3. 🚀 Upside move targeting 146.194
USD/JPY) Bullish reversal analysis Read The ChaptianSMC Trading point update
Technical Analysis USD/JPY suggests a bullish outlook based on the following key technical components:
1. Buying Zone: The chart identifies a green rectangular area labeled "BUYING ZONE" just above the 200 EMA (blue line at 144.079). This implies that price retracement into this zone could be an opportunity to go long (buy).
2. Support & Resistance:
Support Level: Clearly marked around 143.00, showing a previous demand area.
Resistance Level: Around the 145.800–146.000 region, price previously rejected here.
3. Bullish Pattern: The curved arrow suggests the formation of a bullish continuation pattern (possibly a cup & handle or flag), with the expectation of a breakout toward the upside.
4. Target Point: The target is projected at 148.153, implying a potential move of approximately 291.7 pips from the buying zone—suggesting a favorable risk-reward ratio.
5. RSI Indicator: The RSI (Relative Strength Index) is currently around 55, not in the overbought zone, indicating more room for upside movement.
Mr SMC Trading point
Summary of Idea:
Strategy: Buy near 145.00–145.20 (Buying Zone).
Stop Loss: Just below the 200 EMA or the lower bound of the green zone.
Take Profit: Near the 148.153 target.
Confirmation: Wait for bullish confirmation/candlestick reversal in the buying zone.
Pelas support boost 🚀 analysis follow)

USDJPY Cup & Handle – Eyes on 147.883Entry Point: 143.525 (unchanged)
Stop Loss: 141.847 (unchanged)
Target Point One (TP1): 145.063 (unchanged)
Final Target (TP2): Now refined to 147.883 instead of 147.894 — a small, precise update.
📈 Pattern and Structure:
Cup-and-handle formation still intact, indicating a continuation pattern.
Support confirmation at the 143.5 zone, showing a potential base for a bullish reversal.
The chart shows strong upside projection toward the resistance band near 147.8–148.0, highlighted with the upper purple zone.
📊 Risk-Reward Profile:
Risk (Entry to SL): 143.525 – 141.847 = 1.678
Reward (Entry to TP2): 147.883 – 143.525 = 4.358
Reward-to-Risk Ratio: 4.358 / 1.678 ≈ 2.6R — a favorable risk/reward setup.
🧠 Trade Notes:
Entry is slightly above a demand zone.
First target is conservative, near a known resistance.
Final target aligns with prior highs and the broader ascending wedge’s upper bound.
Timing suggests the bullish push may unfold over the next few sessions (likely May 6–8 range, as curved arrow indicates a rounded retest/bounce scenario)

USD/JPY) bearish Technical AnalysisHELLO 👋 Dear friend USD JPY Traders
Technical Analysis represents a bearish analysis setup on the USD/JPY 1-hour timeframe, with the following key elements:
1. Ascending Channel: Price was previously moving inside an ascending channel, indicating bullish momentum.
2. CHoCH (Change of Character): A break below the channel support and structure level, marked as a change in market direction (from bullish to bearish).
3. Support Level: The price is currently testing a support zone around 142.400. The annotation suggests, "IF BREAK OUT", meaning a break below this support could trigger further downside.
4. Bearish Target: If support breaks, the projection is for the price to drop to the 139.872 zone, marked as "POINT".
5. EMA Bearish Crossover: The 50 EMA (red) has crossed below the 200 EMA (blue), adding confluence to the bearish bias.
Idea Summary:
Short Bias: Upon confirmation of the support level break (below 142.400).
Target: Around 139.872.
Confirmation: Look for bearish price action or retest/rejection from the support-turned-resistance area.

USD/JPY) Bullish trand analysis Read The ChaptianSMC Trading point update
Technical analysis of USD/JPY on the 2-hour timeframe, and it presents a bullish continuation setup. Here's a breakdown of the key elements and the idea behind the analysis:
---
1. Ascending Channel Formation
The price is trading within an ascending channel, suggesting a controlled uptrend.
Higher highs and higher lows confirm the trend structure.
2. Key Support and Fair Value Gap (FVG)
There’s a well-identified support level where price has bounced before (highlighted in yellow).
A Fair Value Gap (FVG) zone is marked slightly above the support level, which could act as a short-term demand area.
Price is currently pulling back into this zone, potentially setting up a buying opportunity.
3. EMA 200 Support
The 200 EMA (~143.78) is acting as dynamic support just below the current price.
If price drops further, this level may offer strong technical support.
4. RSI Momentum
RSI is above 50 (currently 56.37), supporting the bullish trend and showing room for continued upside.
5. Target Point
The chart anticipates a bounce off the support/FVG zone and a rally toward the upper boundary of the channel, targeting 147.153.
Mr SMC Trading point
---
Summary of the Idea:
This is a bullish continuation setup within an uptrend channel. The analyst expects a potential long entry around the FVG/support zone, with a target at the channel top (147.15). Confluence from the EMA 200, RSI, and previous structure supports this bullish bias.
Pales support boost 🚀 analysis follow)

USD/JPY Bearish Breakdown: Trendline Breach and Retest TargetingChart Breakdown:
1. Rising Channel
⬆️ Uptrend inside a channel marked by a support line
Price moved up steadily within the boundaries
Support line = channel bottom (🔵 Blue line)
2. Trendline Breakout
⚠️ Bearish breakout occurred when price broke below the support
This is a sell signal as it invalidates the upward trend.
3. Retest Zone (Resistance)
After the breakout, price came back to test the previous support — now resistance
🔄 Retest happened inside the blue box zone
This zone is crucial — if price fails here, it confirms resistance.
4. EMA 70 (Exponential Moving Average)
🔴 Red curve = EMA 70, currently above price
This suggests downward momentum is building.
5. Target Point
🎯 Target = 139.869
Based on projected move from the breakout
🔽 Bearish target shown by vertical arrow.
Summary :
Trendline break: ✂️⬇️
Retest at resistance: 🔄❌
EMA direction: 🔴↘️
Final target: 🎯139.869
Current mood: 🐻 Bearish Bias

USD/JPY) bullish trend analysis Read The ChaptianSMC Trading point update
Technical analysis of USD/JPY chart shows a bullish reversal setup. Here’s a breakdown behind the analysis:
1. Downtrend & Channel Breakout:
Price was trending downward within a descending channel (marked “channel trend”).
Recently, the price broke out of the channel, signaling a potential trend reversal.
2. Demand Zone (Diamond Zone):
The yellow box labeled “Diamond Zone” represents a demand/support zone where price previously found buyers.
A retest of this zone is expected before the bullish move.
3. EMA (200):
The EMA (200) is currently above the price but close. A break above this level (142.522) could add to bullish momentum.
4. RSI Indicator:
RSI is showing a bounce off a mid-level (~50), suggesting bullish momentum is gaining.
5. Target Level:
The analysis targets 147.838, which aligns with a prior resistance zone.
The move projects a 5.19% gain (~778.5 pips) from the current setup.
Trading Idea Summary:
Entry: Around the “Diamond Zone” after a successful retest.
Confirmation: Watch for bullish candlestick patterns or a break above EMA 200.
Target: 147.838
Stop Loss (implied): Below the Diamond Zone (~140.000)
Pales support boost 🚀 analysis follow)

"USD/JPY Supply Zone Short Setup | High R:R Trade Plan (1H Chart📉 Short (Sell) Setup
🔵 Supply Zone (Resistance Area)
Marked in the blue box
⚠️ Price may reverse here
Sellers dominated this area before.
🔄 Expected behavior:
Price goes up to the zone and then drops
➡️🔼🔽
🔹 Entry Point: 142.841
✍️ Enter a sell trade here
Right in the supply zone.
🔴 Stop Loss: 143.371
⛔ Placed above the supply zone
To avoid stop hunts.
🟣 Target Point: 140.000
🎯 Take profit here
Strong support level
Good place to close the trade.
⚖️ Risk to Reward Ratio
❗ Risk: ~53 pips
✅ Reward: ~284 pips
⭐ R:R = 1:5.4 – Excellent setup!
📈 EMA (7)
Current price is below the EMA
Confirms bearish bias
🧭 Used as a trend guide.
Summary
🚨 Plan:
Wait for price to enter the supply zone
Enter a sell at 142.841
SL at 143.371 ⬆️
TP at 140.000 ⬇️

USD/JPY Bullish Reversal Setup – Long Entry at 141.964 Targeting ahemdsaeed25: USD/JPY Long Setup – Eyeing 150.537 Target"
"Potential Bullish Reversal on USD/JPY"
"Swing Trade Alert: USD/JPY Long from 141.964"
"USD/JPY Breakout Play – Buy Zone Identified"
Let me know your tone preference (technical, casual, professional, etc.) and I can tailor the title further.
ahemdsaeed25: This chart is for the USD/JPY (U.S. Dollar / Japanese Yen) pair on the 1-hour timeframe, and it's displaying a bullish setup with a clear trade idea. Here's a breakdown of the analysis:
Key Components:
Current Price: Around 142.574.
Entry Point: 141.964
Stop Loss: 140.547
Take Profit / Target Point: 150.537
Reward-to-Risk Ratio: Favorable (approximately 5.94% upside, large potential move).
Indicators:
EMA 50 (Red Line): 142.798 — acting as near-term dynamic resistance.
EMA 200 (Blue Line): 144.699 — major resistance and a trend filter (downward trend visible).
Zone Analysis:
Support Zone (Purple Box near 141.964 - 140.547): This is the accumulation/buy zone.
