USD/JPY 4H Chart Analysis – Bullish Breakout Ahead?📈 USD/JPY 4H Chart Analysis – Bullish Breakout Ahead? 🚀💹
The USD/JPY pair is currently approaching a critical resistance zone (145.800 - 146.000), which has acted as a strong supply area in the past. The price has shown bullish momentum as it builds higher lows and heads toward this resistance.
🔍 Key Observations:
🔵 Resistance Zone: Clearly marked and tested multiple times. A breakout above this level could trigger a bullish continuation.
📊 Bullish Structure: The pair is forming a strong uptrend with higher highs and higher lows on the 4H timeframe.
🔄 Retest Scenario: Chart suggests a potential breakout above the resistance, followed by a bullish retest before continuing toward the target zone at ~148.900.
🟢 Upside Target: 148.900 (Previous swing high) – a potential gain of over 300 pips from breakout point.
📌 Trading Outlook:
✅ A confirmed breakout and retest of the resistance zone could offer a high-probability long setup.
❌ A failure to break and hold above the resistance may result in short-term consolidation or reversal.
📅 Watch Levels:
Resistance: 145.800 – 146.000
Support (breakout retest): 145.200 – 145.500
Bullish Target: 148.900
📢 Conclusion: Bulls are in control as long as price sustains above the resistance zone. A clean breakout followed by a retest could offer an attractive buying opportunity with a well-defined risk-to-reward setup. 🔥📊
Usdjpylongsetup

USDJPY Bearish Continuation SetupTrend Analysis
The market is in a clear downtrend, evidenced by the sequence of lower highs and lower lows.
The descending trendline has been respected multiple times, acting as dynamic resistance.
🧠 Key Technical Factors
Rejection Zone (Supply Area):
The marked “Rejection Point” aligns with the confluence of the trendline resistance, 50 EMA (red), and historical supply.
Price attempted to break above but faced a strong rejection—signaling institutional sell interest.
EMA Confluence:
50 EMA (142.993) and 200 EMA (144.063) are both sloping downward.
Price is trading below both EMAs, confirming bearish momentum and trend continuation bias.
BOS (Break of Structure):
Multiple BOS levels marked, showing a consistent pattern of structure breaks to the downside.
Each rally is met with selling pressure, failing to create new highs.
🧩 Projected Price Action
Current retracement could retest the trendline/50 EMA before a potential continuation move downward.
Expectation is a lower high formation near the descending trendline followed by a bearish impulse.
🏹 Bias: Bearish
Traders might consider short opportunities around the 142.90–143.00 zone, targeting 142.00 and below, with stops just above the trendline/supply zone.
⚠️ Risk Note
A clean break and close above the trendline and 50 EMA would invalidate this setup and could lead to a shift in structure.

USD/JPY) Bullish reversal analysis Read The ChaptianSMC Trading point update
Technical Analysis USD/JPY suggests a bullish outlook based on the following key technical components:
1. Buying Zone: The chart identifies a green rectangular area labeled "BUYING ZONE" just above the 200 EMA (blue line at 144.079). This implies that price retracement into this zone could be an opportunity to go long (buy).
2. Support & Resistance:
Support Level: Clearly marked around 143.00, showing a previous demand area.
Resistance Level: Around the 145.800–146.000 region, price previously rejected here.
3. Bullish Pattern: The curved arrow suggests the formation of a bullish continuation pattern (possibly a cup & handle or flag), with the expectation of a breakout toward the upside.
4. Target Point: The target is projected at 148.153, implying a potential move of approximately 291.7 pips from the buying zone—suggesting a favorable risk-reward ratio.
5. RSI Indicator: The RSI (Relative Strength Index) is currently around 55, not in the overbought zone, indicating more room for upside movement.
Mr SMC Trading point
Summary of Idea:
Strategy: Buy near 145.00–145.20 (Buying Zone).
Stop Loss: Just below the 200 EMA or the lower bound of the green zone.
Take Profit: Near the 148.153 target.
Confirmation: Wait for bullish confirmation/candlestick reversal in the buying zone.
Pelas support boost 🚀 analysis follow)

USD/JPY) bullish trend analysis Read The ChaptianSMC Trading point update
Technical analysis of USD/JPY chart shows a bullish reversal setup. Here’s a breakdown behind the analysis:
1. Downtrend & Channel Breakout:
Price was trending downward within a descending channel (marked “channel trend”).
Recently, the price broke out of the channel, signaling a potential trend reversal.
2. Demand Zone (Diamond Zone):
The yellow box labeled “Diamond Zone” represents a demand/support zone where price previously found buyers.
A retest of this zone is expected before the bullish move.
3. EMA (200):
The EMA (200) is currently above the price but close. A break above this level (142.522) could add to bullish momentum.
4. RSI Indicator:
RSI is showing a bounce off a mid-level (~50), suggesting bullish momentum is gaining.
5. Target Level:
The analysis targets 147.838, which aligns with a prior resistance zone.
The move projects a 5.19% gain (~778.5 pips) from the current setup.
Trading Idea Summary:
Entry: Around the “Diamond Zone” after a successful retest.
Confirmation: Watch for bullish candlestick patterns or a break above EMA 200.
Target: 147.838
Stop Loss (implied): Below the Diamond Zone (~140.000)
Pales support boost 🚀 analysis follow)

USD/JPY) Bullish reversal analysis Read The ChaptianSMC Trading point update
This chart is for USD/JPY on the 1-hour timeframe, and it presents a bullish trade setup. Let’s break down the idea
---
Key Observations:
1. Current Price:
USD/JPY is trading around 146.281.
2. Overall Bias:
Bullish setup expecting a bounce from demand into a higher target zone.
3. EMA 200:
Price is currently below the 200 EMA (147.942), which usually suggests a bearish trend — but this setup is aiming for a short-term bullish retracement.
4. Demand Zone (Buy Area):
Marked in yellow between 145.822 and slightly above.
Labeled as "FVG orders" (Fair Value Gap), suggesting institutional interest or imbalance fill.
5. Trendline Support:
The price is approaching a rising trendline, adding confluence for a potential bounce.
6. Expected Move:
Price is expected to bounce from the demand zone, form a higher low, and then move up toward the target zone at 148.221.
Two upside targets are drawn:
First Move: ~1.12% (30.6 pips)
Full Target: ~1.76% (256.1 pips)
Mr SMC Trading point
7. RSI (Relative Strength Index):
RSI is around 37.66, nearing oversold territory, supporting a bullish reversal idea.
---
Trade Idea Summary:
Bias: Bullish
Entry Zone: Around 145.822 (fair value gap & trendline support)
Target Zone: 148.221
Stop Loss: Likely just below the demand zone or trendline
Confluence Factors:
Trendline support
RSI nearing oversold
Fair value gap zone
EMA 200 overhead (target acts as resistance)
---
Pelas support boost 🚀 analysis follow

USD/JPY Bullish Reversal: Order Block & EMA 200 TargetSMC Trading point update
This chart presents a technical analysis of USD/JPY on the 1-hour timeframe. The key insights from this analysis are:
1. Order Block & Potential Reversal
The price has dropped significantly and reached a highlighted order block zone (a key demand area).
A potential inverse head and shoulders pattern is forming, indicating a possible bullish reversal.
2. Expected Bullish Movement
The price is expected to bounce from the order block, creating a bullish structure.
The projected move suggests a retracement toward a resistance zone, which aligns with previous price action.
Mr SMC Trading point
3. Target Zone & EMA 200
The target zone is around 148.946 - 149.178, aligning with the 200 EMA, a significant resistance level.
4. RSI Indicator
The RSI is currently low (~38.93), indicating potential for a reversal as the market may be oversold.
Conclusion
The chart suggests a bullish retracement after the recent drop, targeting the resistance zone near the 200 EMA. However, confirmation is needed (e.g., bullish price action, volume increase) before taking a trade. Keep an eye on fundamental news that may impact USD/JPY volatility.
Pales support boost 🚀 analysis follow)

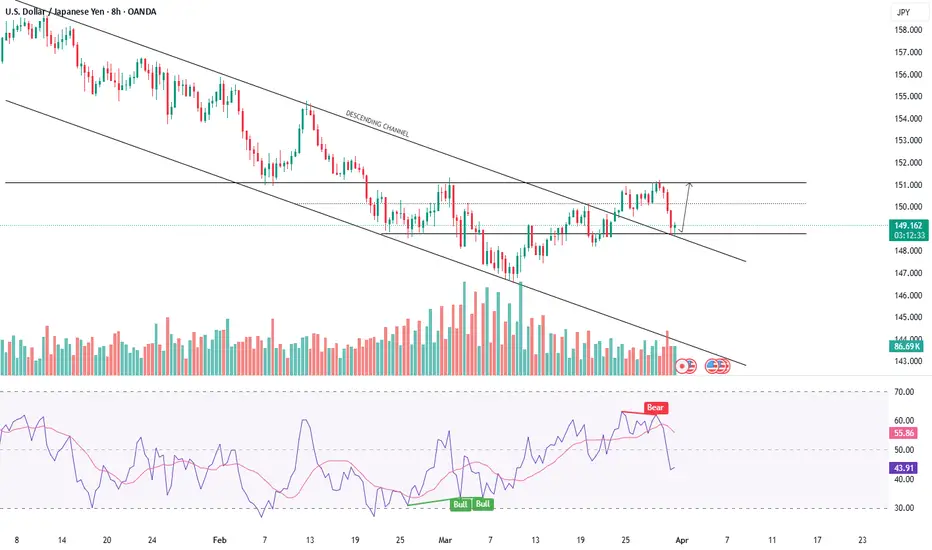
USDJPY- ATTEMPTING TREND REVERSALSymbol - USDJPY
CMP - 148.87
The USDJPY is currently in a corrective phase, retesting the previously breached downtrend boundary. The market is attempting to break this trend amidst a broader correction of the US dollar.
The dollar is facing significant challenges due to various economic and geopolitical factors in the United States, coupled with persistently high inflation. In light of these conditions, the US dollar Index may continue to experience a deeper correction, as expectations for interest rate cuts could be extended, potentially exerting further pressure on the markets.
Earlier, the currency pair attempted to overcome the resistance of the downtrend and succeeded, yet this move alone is insufficient to confirm a trend reversal; additional confirmation is required.
Support levels: 148.92, 148.21
Resistance levels: 150.16, 150.95
If the bulls manage to maintain support above the 148.92 - 149.5 range, there is a promising opportunity for a potential trend reversal. A move towards the 150.16 resistance level, followed by a breakout and sustained price action above this level, would serve as confirmation of the trend shift.
USD/JPY Bullish Outlook – Targeting Key Resistance at 150.155USD/JPY Technical Analysis – Bullish Outlook Toward Resistance
Chart Insights:
The price is currently in a recovery phase after a significant drop.
A Fair Value Gap (FVG) zone has been identified, suggesting a potential pullback before further movement.
The target point aligns with the resistance level around 150.155, which acts as a key supply zone.
Potential Scenario:
Price may retrace into the FVG zone around 148.704 – 148.956.
A bullish rebound from this level could drive price toward the resistance at 150.155.
If price reaches the resistance level, further rejection or continuation will depend on market conditions.
Key Levels:
Support Zone: 148.167 – 148.315
FVG Area: 148.704 – 148.956
Resistance Zone: 150.007 – 150.155 (Target area)
Conclusion:
The current structure suggests a bullish bias if price respects the FVG zone for a push higher. However, a break below the FVG could signal further downside movement

USD/JPY Breakout Trade Setup – Bullish Potential Ahead!📉 Trend Analysis:
The pair has been in a downtrend 📉 since early February, following the descending trendline.
Now, price is breaking out above the trendline 📈, indicating a potential reversal or bullish move.
📊 Trade Setup:
🔹 Entry: Around 149.731 (current price)
🔹 Take Profit Targets:
🎯 TP1: 150.170 (First resistance)
🎯 TP2: 151.028 (Stronger resistance)
🚀 Final Target: 152.309 - 152.319 (Main bullish goal)
🔹 Stop Loss: 148.567 - 148.549 (Below recent support) ❌
⚖ Risk-Reward Ratio:
✅ Good reward-to-risk setup since stop-loss is tight, but the upside potential is higher.

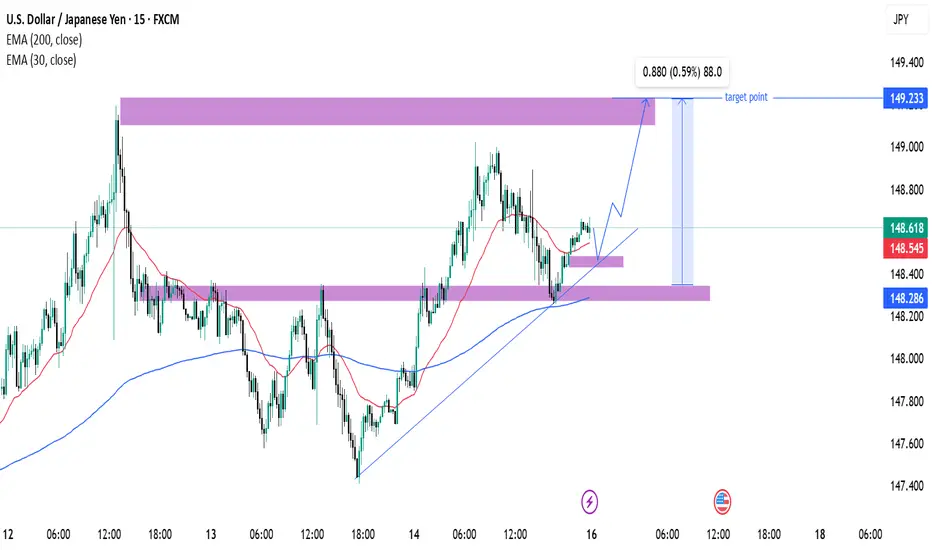
USD/JPY Technical Analysis & Trade Outlook – March 16, 2025Current Price: 148.618
EMA (30): 148.545 (short-term trend)
EMA (200): 148.286 (long-term trend)
Resistance Zone: 149.233
Support Zone: 148.286
Analysis & Price Action:
The price is trending upwards, forming higher lows, indicating bullish momentum.
The price is above both the 30 EMA and 200 EMA, which suggests an ongoing uptrend.
A support level around 148.286 is holding, reinforcing a bullish bias.
Forecast & Trade Plan:
A potential breakout above the minor resistance could push USD/JPY towards the 149.233 target.
If price retraces, a bounce off 148.286 would present a buy opportunity.
If price breaks below 148.286, the bullish outlook weakens, and further downside may follow.
📌 Bias: Bullish towards 149.233
📌 Confirmation: Watch price action at support and resistance levels
📌 Risk Management: Consider stop-loss below 148.200 to protect downside.
Would you like further details on trade entry points
USDJPY - POTENTIAL REVERSAL FROM KEY SUPPORT LEVELSSymbol - USDJPY
CMP - 147.82
Following a significant decline in USDJPY, The price is approaching a strong support zone which is held since July 2024. The fundamental environment has been volatile recently, with a predominant influence from Trump's tariffs & US economic factors. Given the recent price action near support zone 148.00 - 147.00, there is a possibility that the pair could rebound from this level. The market’s current hesitation near this support zone suggests that the bulls may be preparing to defend this area.
The aggressive sell-off in US dollar, while exerting downward pressure, is also at oversold levels & creating a scenario where a potential reversal could take place, supported by the decline of Japanese Yen. Should the price manage to hold above the 147.20 support, it could signal the reversal.
From a technical perspective, there are two potential triggers on the chart: one signaling a buy and the other signaling a sell. However, given the prevailing global and local forex trends, the preference is to take a long position.
Resistance levels: 148.85, 150.00
Support levels: 147.25, 146.90
At present, the market is in a downtrend, with potential for a counter-trend correction. The direction of the price will depend on the US dollar's performance and upcoming economic news. If the outcome is favorable, the price could potentially reach to 150.00 & 152.15 levels.

USDJPY - A REBOUND FOLLOWING DOLLAR STRENGTHSymbol - USDJPY
CMP - 150.25
USDJPY pair is experiencing an upward movement in line with the performance of the US dollar. A temporary reversal is currently unfolding, driven by domestic political and economic factors in the United States.
The price is consolidating in the range of 149.40 - 148.60 after a significant decline. This long-term consolidation is creating a reversal pattern, further supported by the reversal and strengthening of the US dollar. Consequently, the Japanese yen is losing ground.
Key resistance is located at 150.30, should the bulls manage to maintain support above this level, there is potential for further price appreciation toward trend resistance in the short to medium term.
Resistance levels: 150.30, 150.95
Support levels: 149.40, 149.15
At present, the market is in a downtrend, with potential for a counter-trend correction. The direction of the price will depend on the US dollar's performance and upcoming economic news. If the outcome is favorable, the price could potentially reach 152.30

USDJPY SHOWING A GOOD UP MOVE WITH 1:5 RISK REWARD USDJPYSHOWING A GOOD UP MOVE WITH 1:5 RISK REWARD
DUE TO THESE REASON
A. its following a rectangle pattern that stocked the market
which preventing the market to move any one direction now it trying to break the strong resistant lable
B. after the break of this rectangle it will boost the market potential for break
C. also its resisting from a strong neckline the neckline also got weeker ald the price is ready to break in the outer region
all of these reason are indicating the same thing its ready for breakout BREAKOUT trading are follws good risk reward
please dont use more than one percentage of your capitalfollow risk reward and tradeing rules
that will help you to to become a bettertrader
thank you

USDJPY Trade SetupThis is for short term trade.
Reason for the trade
1.Its not break the demand.
2.Its respected the QML line.
3.Still the trend is in up in HTF
Please do your own research before entering the trade

USDJPY 1H BUY PROJECTION 19.09.24Reason for Bullish
USDJPY Correlation
In fact, what drives the USD/JPY pair the most is monetary policy divergence between the Fed and the BoJ and risk sentiment. In normal times, when there's risk on sentiment you can see the USD/JPY appreciating all else being equal, while during risk off flows you can see the JPY gaining strength.

USD JPY trade setup price is reversing from 149.578 without testing resistance which mean a lack of buying liquidity
the following previous green long candles left behind imbalance which have created fair value area
with applying fib to draw the PD area
149 to 148.781 is above discount zone which will hold less impact
whereas 148.500 to 148.300 is the zone where we can look for trade and for the target of 149.995 and stop loss based on risk taking capability

USDJPY R:R :1:4 FOMCThis is for short term
Marked Possible Buy zone
Wait for FOMC release
Once Reached Entry zone Look for Liquidity sweep and BOS in LTF then Enter
And this is risky too.
Please DYOR before entering the trade.

USD-JPY Trade Setupprice is at resistance zone of 151.144 and 151.380
after the recent break of structure there is open order block to restest
also there will be small liquid or inducement zone that need to be triggered
for next upside
150.432 and 150.246 is the buying area
with stop loss of 150 rd figure
and target of 151.500
with risk to reward 1:3
condition to avoid if price reach 151.500 first before coming towards our buying zone then the trade we be cancelled

USDJPYFX:USDJPY
As you can see that, USDJPY has formed a good resistance in 15min Time frame, if it gives breakout then we can plan for buy side. Take retest entry and plan your trade accordingly.... This trade is for monday (25-09-23).....

USDJPY – What's the intervention threshold? USDJPY – What's the intervention threshold?
In September of last year, the Bank of Japan (BOJ) made a move in the market to strengthen its currency when it reached 145 against the USD, marking the first such intervention since 1998. This action was taken following the BOJ's decision to maintain an extremely accommodative policy (a policy that is yet to change still). The BOJ intervened once more in October when the yen further plummeted to its lowest level in 32 years, reaching 151.94 against the dollar.
At present, investors hold a substantial short position in the yen, valued at $9.793 billion, representing the largest such position in the USDJPY since May 2022. This value has nearly doubled in just the past three months. Notably, former Japanese Vice Finance Minister Eisuke Sakakibara has suggested that the USDJPY could reach 160 before the BOJ intervenes once again.
However, the USDJPY has recently built a bit of a buffer between itself and whatever the intervention threshold is for the BoJ. Over the past two trading days, the US dollar has weakened, largely due to remarks made by Federal Reserve officials. These statements have strengthened the belief that the US central bank is nearing the end of its tightening phase.
It is widely anticipated that Fed policymakers will implement a rate increase during their upcoming meeting this month, which would set the policy rate range at 5.25% to 5.50%. However, the timing of any subsequent rate hikes remains uncertain. There are questions whether they will raise rates again in September, delay until November, or maintain the current stance and allow inflation to naturally subside over time.
Consequently, the US dollar has experienced a decline against the yen, reaching a low of 141.32 yen, the lowest level observed since June 21. Currently, it is down 0.5% at 141.328. This drop follows a decrease of nearly 1.3% seen last Friday when the US nonfarm payrolls for June fell short of market expectations at 209,000.

usdjpy long positionin this chart market can respect 1st one because its under the IDM and if 1st breaks then it can to till 2nd and give some reaction there but i think that it will go to 3rd and 4th because it makes its daily new high

USDJPY Analysis wait for breakdown or rejection and candlestick USDJPY Analysis wait for breakdown or rejection and candlestick pattern

USDJPY longFX:USDJPY
As you can see USDJPY has created a channel and it already given a breakout in 4HR timeframe, wait for pull back and taken entry on buy side. plan your trade accordingly...
