USDJPY ShortFX:USDJPY
A Good Consolidation flag breakout has seen in USDJPY, if it gives breakout and retest then take entry.
plan your trade accordingly and manage your risk to reward ratio.
Usdjpyshort


3 Highs setup in USDJPY. Below The Red Line!Hello Traders!
1. We see 3 consistent higher highs formed with no retracement broken .
2. Sell Below The Red Line .
3. Stop may be updated if the market breaks high before our entry is done.
4. I'll be posting a full tutorial on the 3 Highs setup during the coming weekend.
Do use proper risk management.
Happy Trading!
Profits,
Market's Mechanic.

USDJPY SHORT RISKY SL CLOSEJUST WANT TO SEE SOMETHING SO KEEP SL SMALL JUST IN CASE
they say i should tone it down most likely to fail this trade


USDJPY Sell trade opportunitiesUSDJPY Sell trade opportunities
The pair is currently in a retracement, which provides an opportunity to sell the resistance level as we mark on the chart waiting for the market for a good entry.

USD JPY SELLsell usdjpy is good opportunity right now :
Key point are :
1. strong supply area
2. point of interest footstep of big institution
3. take inducement
4. good risk reward
if analysis helpful than plz support

USDJPY approaching towards distribution areathis currency pair is again approaching its supply area till now bulls have tried hards to control but from here it looks difficult to hold.
its on the radar, upcoming setup to short

USDJPY SELLING IDEADouble top, and its neckline was broken, US CPI data come negative
Conservative traders should wait for the retest, and aggressive traders may continue selling

USDJPY ANALYSIS FOR NEXT MONTH.weekly trend : bearish
daily trend : bearish
4 hour trend : be
1 hour trend : bullish
after the downside rally from 142 level, we can see a 78% retracement back to 141.5 levels mitigating all imbalances in between & testing the stronger high.
a strong short opportunity at those levels. for this week & next week.

#USDJPY it's possible to sell#USDJPY for Price trading the 4hr resistance area and waiting for bearish candlestick formation in resistance area and the next candle close below the previous candle its will move to the next level support
Why we like it
Price trading the 4hr resistance
moving to the next level support
waiting for bearish candlestick formation
1st support:
136.144
Next Zone area & horizontal swing Low support
1st Resistance
146.840
Zone area & horizontal swing high resistance

USDJPY TRADING SETUPUSDJPY is trading at supply zone at all important time frames which is High Resistance Level.
At 4hr and 1D Double top pattern has been formed which is extremely bearish in nature.
A range has been formed in 1HR time frame.
Looking for breakdown of that range that I have marked in Rectangle. As range breaks, with confirmation of volume and candle, I will enter the trade with stop loss at Resistance i.e high of Rectangle.
With breaks upside then wait for price action to form. No buy trade in USDJPY.
ENTRY=138.33
TARGET=136.34
SL=138.90
COMMENT BELOW YOUR IDEA
GIVE A LIKE IF YOU AGREE WITH MY SETUP

Sell side USD/JPYBreak of trendline in downside by taking resistance at supply zone. So go for it in sell side.

usdjpy small intraday shortusdjpy i am looking for sell.
30 min chart supply area + s&r area. price going up but AO coming down.
Mercury Technicals is not an investment advisory service, or a registered investment advisor or broker-dealer and does not purport to tell or suggest which securities customers should buy or sell for themselves.
warning: Note! The Analysis video shared here are for educational/informational purposes only.

USDJPY: A DIAGONALTheory:
DIAGONAL:
Diagonal are the motive waves like an impulse wave, but diagonals are different from impulse wave in that they do follow the first two Sutras (rules of impulse wave) for wave analysis, but it does not follow the third one i.e. Wave 4 should not intervene the territory of the wave 1. In a diagonal wave 4 always enters into the price territory of the wave 1.
Properties Of Diagonals:
Diagonals can be contracting or expanding type being expanding diagonal a rare one.
In contracting type, wave 3 is shorter than wave 1, wave 5 is shorter than wave 3, and wave 4 is shorter than wave 2.
In expanding type, wave 3 is longer than wave 1, wave 5 is longer than wave 3, and wave 4 is longer than wave 2.
Types Of Diagonals:
LEADING DIAGONAL
ENDING DIAGONAL
LEADING DIAGONAL: In a leading diagonal , waves 1,3, and 5 are all impulsive in nature or all in corrective form of zigzags. Wave 2 and wave 4 are always present in a zigzag form. A leading diagonal suggests the starting of a new wave & that is why it can develop wave 1 of a impulse wave and a first wave of a zigzag pattern.
ENDING DIAGONAL : This is the most common diagonal that can be found out at the ending of a main trend or main correction. It consists of all the waves 1-2-3-4-5 in a single or multiple zigzags. They can be found placed at 5th wave of an impulse wave or can been seen as a wave ‘C’ of a corrective waves zigzags or flat. After the termination of the ending diagonal , a swift & a sharp reversal takes place which bring the prices back to the level from where the diagonal began.

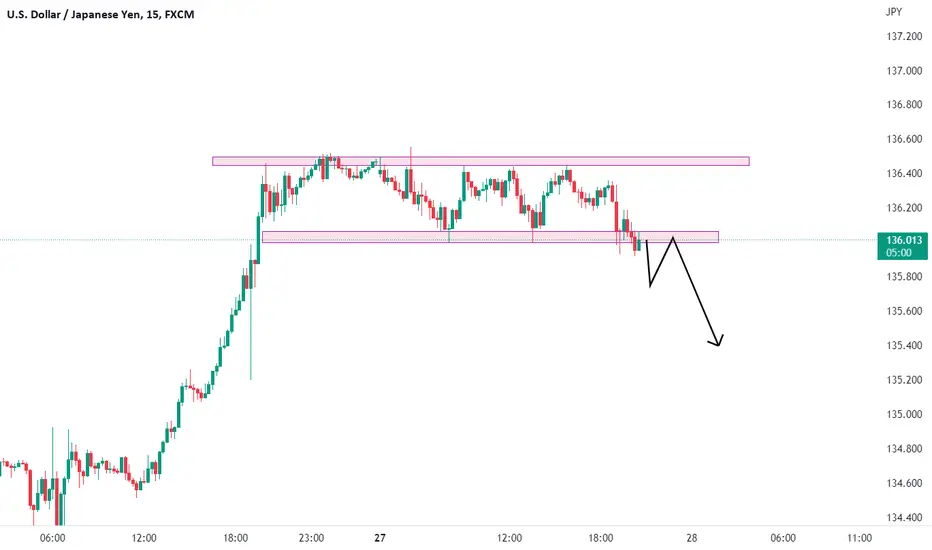
USDJPY Trading Plan - 27/Jun/2022Hello Traders,
Hope you all are doing good!!
I expect USDJPY to go DOWN after finishing correction.
Look for your SELL setups.
Please follow me and like if you agree or this idea helps you out in your trading plan.
Disclaimer: This is just an idea. Please do your own analysis before opening a position. Always use SL & proper risk management.
Market can evolve anytime, hence, always do your analysis and learn trade management before following any idea

USDJPY SHORT GREAT OPPORTUNITYHello Traders,
Once again we are here to give a idea about USDJPY technical analysis.
Some important things to note for the USDJPY.
1) BOJ is dovis about its ultra loose monetary policy to achieve pre COVID inflation target which leads USDJPY price skyrocket from 116 to 135.
2) Today at 23:30 IST FED is going to declare it's interest rate policy which is Hawkis view prev: 1% forecast: .50% which leads aggressive movment in USDJPY.
3) Later that BOJ will also declare it's interest rate policy which is same as before that is no change in that.
So overall USDJPY is still in bullish trend. But from the technical analysis oversold RSI of Weekly, monthly and daily shows sign that rally in USDJPY is overextended.
From my technical analysis prospect in weekly graph price is making higher high while RSI forming lower higher-highs which form a negative divergence.
Sell USDJPY@ 135-136.500
TARGET 1=> 134.500
2=> 134
3=> 133.800
4=> 133.200
5=> 132.300
SL ==> 137.000
Do your own research before taking trade this idea is only for education purpose. Happy trading to all 🤠.

USDJPY NEXT MOVE ANALYSIS FOREX TRADINGUSDJPY FORECAST
its just an idea based on what i see in the chart
trade what you see not what you feel
follow the trend
good luck

USDJPY USDJPY - M Shape can be formed. Gartley pattern. Enter once the trend line is broken. SL will be the latest swing high. The are formed with Red lines will be potential reverse zone.

USDJPY CREATING WYCKOFF Its creating wyckoff in 5min time frame.
There is a maximum chances for reversal.
Don't miss the opportunity to short.
Before entering the trade do your own research.
Fore reference in.pinterest.com OANDA:USDJPY

USD JPYUSD JPY reached Monthly and Weekly High.(Check Monthly and Weekly Time frame) for reference.
We can expect reversal from the order block zone.
Use Minimal stop loss to avoid major loss.
Before entering the trade DYOR.

#USDJPY Inverted Head and Shoulder formationAs seen in monthly chart of USDJPY, inverted head and shoulder is formed. Breakout above 127.50/128 with volumes will make it run to multi decade highs.
Likely scenario: With current global inflation, BOJ is forced to abandon its yield curve control strategy, that brings the yen devaluation option to the forefront.
God bless us all!!!
