USD/JPY 4H Chart Analysis – Bullish Breakout Ahead?📈 USD/JPY 4H Chart Analysis – Bullish Breakout Ahead? 🚀💹
The USD/JPY pair is currently approaching a critical resistance zone (145.800 - 146.000), which has acted as a strong supply area in the past. The price has shown bullish momentum as it builds higher lows and heads toward this resistance.
🔍 Key Observations:
🔵 Resistance Zone: Clearly marked and tested multiple times. A breakout above this level could trigger a bullish continuation.
📊 Bullish Structure: The pair is forming a strong uptrend with higher highs and higher lows on the 4H timeframe.
🔄 Retest Scenario: Chart suggests a potential breakout above the resistance, followed by a bullish retest before continuing toward the target zone at ~148.900.
🟢 Upside Target: 148.900 (Previous swing high) – a potential gain of over 300 pips from breakout point.
📌 Trading Outlook:
✅ A confirmed breakout and retest of the resistance zone could offer a high-probability long setup.
❌ A failure to break and hold above the resistance may result in short-term consolidation or reversal.
📅 Watch Levels:
Resistance: 145.800 – 146.000
Support (breakout retest): 145.200 – 145.500
Bullish Target: 148.900
📢 Conclusion: Bulls are in control as long as price sustains above the resistance zone. A clean breakout followed by a retest could offer an attractive buying opportunity with a well-defined risk-to-reward setup. 🔥📊
Usdjpysignals

USDJPY Bearish Continuation SetupTrend Analysis
The market is in a clear downtrend, evidenced by the sequence of lower highs and lower lows.
The descending trendline has been respected multiple times, acting as dynamic resistance.
🧠 Key Technical Factors
Rejection Zone (Supply Area):
The marked “Rejection Point” aligns with the confluence of the trendline resistance, 50 EMA (red), and historical supply.
Price attempted to break above but faced a strong rejection—signaling institutional sell interest.
EMA Confluence:
50 EMA (142.993) and 200 EMA (144.063) are both sloping downward.
Price is trading below both EMAs, confirming bearish momentum and trend continuation bias.
BOS (Break of Structure):
Multiple BOS levels marked, showing a consistent pattern of structure breaks to the downside.
Each rally is met with selling pressure, failing to create new highs.
🧩 Projected Price Action
Current retracement could retest the trendline/50 EMA before a potential continuation move downward.
Expectation is a lower high formation near the descending trendline followed by a bearish impulse.
🏹 Bias: Bearish
Traders might consider short opportunities around the 142.90–143.00 zone, targeting 142.00 and below, with stops just above the trendline/supply zone.
⚠️ Risk Note
A clean break and close above the trendline and 50 EMA would invalidate this setup and could lead to a shift in structure.

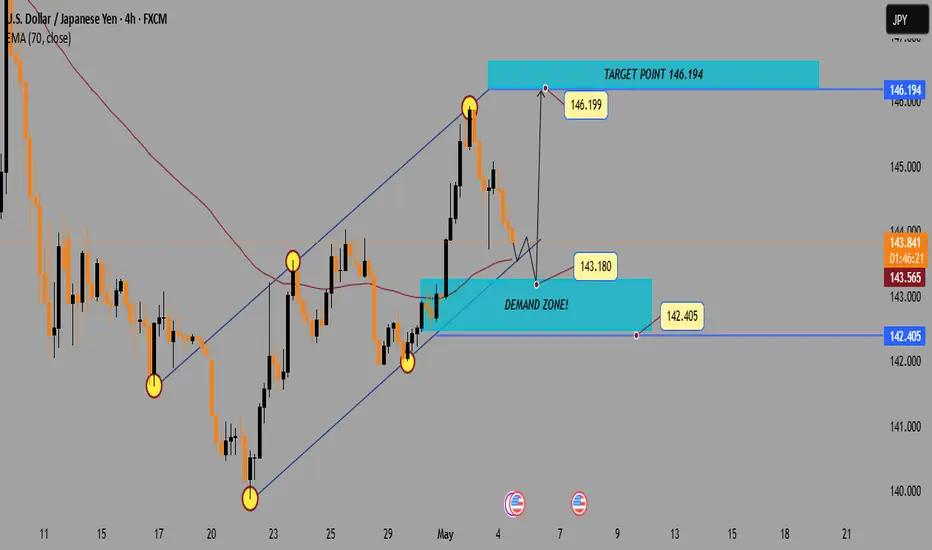
USD/JPY4H Analysis:Demand Zone ReTest Before Bullish Continuatio1. Trend Channel
🔼 Uptrend: The pair is moving inside an ascending channel.
▪️ Support: Lower boundary of the channel.
▪️ Resistance: Upper boundary of the channel.
2. Recent Price Action
🔴 Pullback: After reaching the top at 146.199, price is retracing.
📉 Price is now heading toward the Demand Zone.
3. Demand Zone
🟦 Demand Zone (142.405 – 143.180):
This zone could act as a strong support
Buyers might step in here
Watch for bullish patterns or rejections around this area
4. EMA 70
📏 EMA 70 (143.568) is slightly below current price (143.949) — this may offer temporary support/resistance.
5. Target
🎯 Target Point: 146.194
If price bounces from demand zone, this is the next bullish target.
Possible Scenario
1. 🔽 Price dips into the Demand Zone
2. 🟢 Bullish bounce → Confirm with candlestick signals
3. 🚀 Upside move targeting 146.194
USD/JPY Bearish Breakdown: Trendline Breach and Retest TargetingChart Breakdown:
1. Rising Channel
⬆️ Uptrend inside a channel marked by a support line
Price moved up steadily within the boundaries
Support line = channel bottom (🔵 Blue line)
2. Trendline Breakout
⚠️ Bearish breakout occurred when price broke below the support
This is a sell signal as it invalidates the upward trend.
3. Retest Zone (Resistance)
After the breakout, price came back to test the previous support — now resistance
🔄 Retest happened inside the blue box zone
This zone is crucial — if price fails here, it confirms resistance.
4. EMA 70 (Exponential Moving Average)
🔴 Red curve = EMA 70, currently above price
This suggests downward momentum is building.
5. Target Point
🎯 Target = 139.869
Based on projected move from the breakout
🔽 Bearish target shown by vertical arrow.
Summary :
Trendline break: ✂️⬇️
Retest at resistance: 🔄❌
EMA direction: 🔴↘️
Final target: 🎯139.869
Current mood: 🐻 Bearish Bias

USDJPY TRADING POINT UPDATE > READ THE CAPTAINBuddy'S dear friend 👋
USD JPY Trading Signals 🗺️🗾 Update USD JPY SMC trading point analysis setup Short trend entry ☺️ USD JPY closed below 👇 up trand 😱 158.059 -156.033 support level back up trand tast rejected point below 👇 trend 📉 target 156.033 - 154.475 open now Good luck
Small target we'll see.156.33
Analysis target we'll see 154.475
Mr SMC Trading point
Support 💫 My hard analysis Setup like And Following 🤝 me that star ✨ game 🎯

USDJPY Lastwave - Big Drop SoonUSDJPY 1D Timeframe Projection
DISCLAIMER: All labelling and wave counts are done by me manually and I will keep changing according to the LIVE MARKET PRICE ACTION. So don't be bias, hope on my trade plans...try to learn, and make your strategy... Following is not that easy...

USDJPY 4H SELL PROJECTION 08/04/2024Reason For SELL
1.Trible Top Formed Side Wise Markert
2.Three White Soliders Formed Sell
3. Entry @151.900 to 151.800
4. Sl @152.200
5.Tp1 @151.500
6.Tp2 @151.200
7.Tp3 @ 150.500

USDJPY ShortFX:USDJPY
A Good Consolidation flag breakout has seen in USDJPY, if it gives breakout and retest then take entry.
plan your trade accordingly and manage your risk to reward ratio.
usdjpy touching its major supportUsdjpy
All jpy pair touching their lows during last fundamental jpy broke its zone of 130 which was acting as a support for one month.Now for this week we can see price movement within a descending channel and very soon price will test again a solid support zone of 126. Where we will see a little bullish move upside but remember for good and healthy trend move price should break this either on both side.. Around 126 zone all support acts like horizontal and and vertical if price hold this support zone after retest we can take entry within a following channel

USDJPY TRADING SETUPUSDJPY is trading at supply zone at all important time frames which is High Resistance Level.
At 4hr and 1D Double top pattern has been formed which is extremely bearish in nature.
A range has been formed in 1HR time frame.
Looking for breakdown of that range that I have marked in Rectangle. As range breaks, with confirmation of volume and candle, I will enter the trade with stop loss at Resistance i.e high of Rectangle.
With breaks upside then wait for price action to form. No buy trade in USDJPY.
ENTRY=138.33
TARGET=136.34
SL=138.90
COMMENT BELOW YOUR IDEA
GIVE A LIKE IF YOU AGREE WITH MY SETUP

USDJPYDear traders,
As I have been accustomed to in recent months and this time my technical analysis had an accuracy rate of over 95% and I will try to continue to keep this percentage as long as possible
As I said in the last weeks .. s I said UJ rejected from the Fibonacci 0.5 ... it went down in the area 108,600 from where it rejected again and goes again to the Fibonacci 0.5 area making a range between these values!
In the next period I expect this range to continue and I will play between the Fibonacci 0.5 and Fib 0.382 areas until the first closing on the chart for a week outside these values.
THIS WEEK...as I said last week, UJ remained in the range between 0.5 and 0.382 Fibonacci levels, which I think will reach this week!
NOTE: Please, give a LIKE if you find this idea useful!
GREAT ATTENTION:
*This information is not a Financial Advice.

USDJPYDear traders,
As I have been accustomed to in recent months and this time my technical analysis had an accuracy rate of over 95% and I will try to continue to keep this percentage as long as possible
As I said in the last weeks .. UJ touched and forced the Fibonacci 0.5 area from where he had a strong rejection!
even if he retested the area once more ... I think he will start a retreat first towards 109,700 and maybe 108,460!
however, a close even for a day over Fibonacci 0.5 opens the opportunity to BUY to the Fibonacci area618
THIS WEEK... as I said UJ rejected from the Fibonacci 0.5 ... it went down in the area 108,600 from where it rejected again and goes again to the Fibonacci 0.5 area making a range between these values!
In the next period I expect this range to continue and I will play between the Fibonacci 0.5 and Fib 0.382 areas until the first closing on the chart for a week outside these values.
NOTE: Please, give a LIKE if you find this idea useful!
GREAT ATTENTION:
*This information is not a Financial Advice.

Will USD/JPY Hit 102.540?USD/JPY started to fall from the 20th February of 2020. Right now, it's trying to reach 102.540 . It has to cross 103.300 - 102.900 to hit 102.540 .
After crossing the 102.540, The trend will march to touch 101.200 . But if it starts to rise by breaking the resistance, then it will hit 104.740 - 105.300 .
