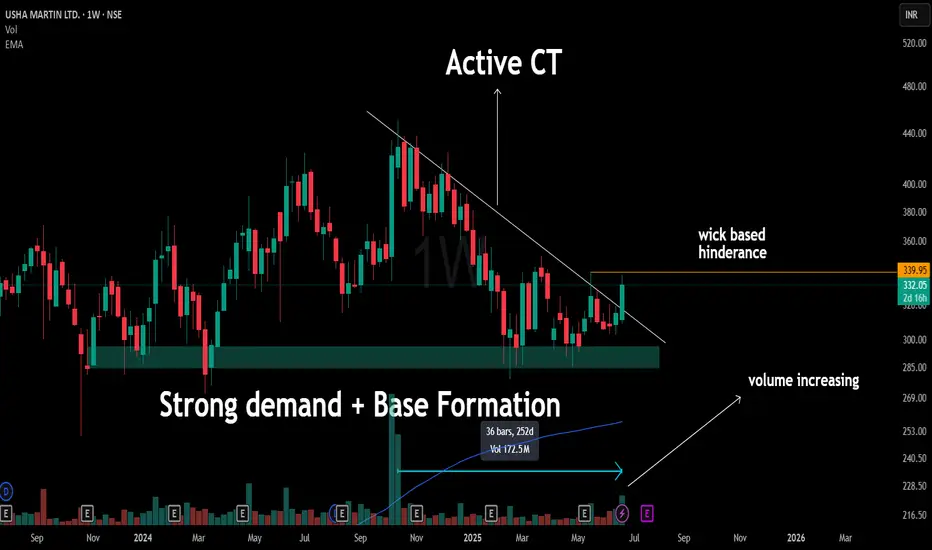
USHA MARTIN – Weekly Structure SnapshotA clean White CT that had acted as a multi-month resistance is now being engaged. Price is attempting to push above it, but the current candle is still developing — small-bodied so far, which is typical during early phases of structural tests on the weekly timeframe (WTF).
🟧 Just above lies a wick-based hindrance — a level that previously reacted with strong rejection. It's also where the current active CT had its last struggle, making it a structurally relevant zone, not something to ignore.
The base that formed in the ₹270–290 region stands out — multiple rejections without deeper breakdowns, a sign of demand stability. Volume expansion this week is notable — especially after 252 days of subdued activity — marking a shift in participation worth observing.
📌 This is not a prediction. Not a forecast. Not a trading call.
Just a structural walkthrough of what price is doing — and where attention has historically been paid.
Let the price write the story — our job is to read structure, not write headlines.
Ushamartin
USHA MARTIN BREAKS OUT! 7.5% SURGE SIGNALS MASSIVE RALLY AHEADNSE:USHAMART Made Beautiful Chart Structure of Kinda Triple Bottom Reversal Pattern today after Q4 Results with Good Price and Volume action and Breaking the Trendline.
Price Action:
- The stock has been in a downtrend since November 2024, forming a clear descending resistance line (white diagonal Trendline)
- Currently showing strong breakout momentum at ₹334.85, up ₹23.75 (+7.46%) in today's session
- Successfully broken above both the downtrend line and horizontal resistance at ₹320-325
- Multiple tests of support at the ₹290 level have created a solid base for the current rally
- Higher lows forming since March indicate increasing buying pressure
Volume Analysis:
- Today's volume at 4.98M shares vs. average of 688.65K (over 7x normal volume)
- Previous support bounces (green arrows) also occurred with increased volume
- Extremely high volume on today's breakout confirms strong institutional interest
- Volume profile shows healthy accumulation during support tests
Key Support and Resistance Levels:
- Strong support established at ₹290 level (green horizontal line)
- Intermediate resistance/support at ₹320-325 (lower red horizontal line)
- Major resistance at ₹350 level (upper red horizontal line)
- The previous rejection point at ₹350 (red arrow) now becomes the next target
- Long-term resistance from October to December 2024 around ₹420
Technical Patterns:
1. Downtrend Line Breakout*- Price has decisively broken above the multi-month downtrend line
2. Kinda Triple Bottom- Formed at ₹290 level (February-May), creating a solid foundation
3. Ascending Triangle- Recent price action shows higher lows against horizontal resistance
4. Volume Confirmation- Massive volume spike validates the technical breakout
5. Bullish Engulfing Candle- Today's price action engulfs previous bearish candles
Trade Setup:
- Pattern: Downtrend line breakout + horizontal resistance break
- Confirmation: Strong price action with 7x normal volume
- Context: Potential trend reversal after extended downtrend and base formation
Entry Points:
1. Aggressive Entry: Current price (₹334.85) with partial position
2. Pullback Entry: On retest of breakout level ₹320-325
3. Confirmation Entry: Add positions on close above ₹350 (previous resistance)
Exit Strategy:
- Target 1: ₹350 (immediate resistance)
- Target 2: ₹380 (intermediate resistance based on prior support level)
- Target 3: ₹420 (major resistance from December 2024)
- Trailing Stop: Implement a 5% trailing stop after Target 1 is achieved
Stop Loss Placement:
- Aggressive Stop: ₹315 (below breakout level)
- Conservative Stop: ₹305 (midpoint between support and breakout)
- Pattern-Based Stop: ₹290 (below the triple bottom support)
Risk Management:
- Position sizing: Limit risk to 1-2% of trading capital
- Risk-reward ratio: Maintain at least 1:1.5 (with aggressive stop)
- Consider scaling in: 50% at current level, 25% on pullback, 25% on further confirmation
- Scale out: 30% at Target 1, 40% at Target 2, hold remainder with trailing stop
Today's powerful breakout on record volume after forming a kinda triple bottom pattern suggests a potential trend reversal. The breakout above both the descending trendline and horizontal resistance provides a compelling technical case for upside continuation. If the stock can maintain momentum above the ₹325 level, it could target the next resistance at ₹350 quickly, with potential for a move toward ₹380-420 in the coming weeks.
Keep in the Watchlist.
NO RECO. For Buy/Sell.
📌Thank you for exploring my idea! I hope you found it valuable.
🙏FLLOW for more
👍BOOST if useful
✍️COMMENT below with your views.
Meanwhile, check out my other stock ideas on the right side until this trade is activated. I would love your feedback.
Disclaimer: "I am not a SEBI REGISTERED RESEARCH ANALYST AND INVESTMENT ADVISER."
This analysis is intended solely for informational and educational purposes and should not be interpreted as financial advice. It is advisable to consult a qualified financial advisor or conduct thorough research before making investment decisions.

Keep an EYE on Usha Martin LtdBigger the consolidation better the breakout / so keep an eye on usha martin ltd / high probability of channel breakout on daily chart. cmp 413.40 Plan your trade
not a buy or sell recommendation / do your analysis before take a trade


Why Metal sector seems strong?CNX Metal tested major resistance, if it breaks it then Metal stocks can see good moves.
Recovered fully from 4th June carnage candle. As simple as that.

USHA MARTIN - Swing Trade Analysis - 1st May #stocksUSHA MARTIN (1W TF) - Swing Trade Analysis given on 1st May, 2024
Pattern: RECTANGLE BOX BREAKOUT
- Weekly Resistance Breakout - Done ✓
- Volume Buildup at Resistance - Done ✓
- Demand Zone Retest & Consolidation - In Progress
* Disclaimer

USHA MARTIN - 105% RETURNS!!!BUY - USHA MARTIN
CMP - Rs. 239
Target - 1: Rs. 350
Target - 2: Rs. 490
.
.
Technicals - Trendline BO
.
This is just a view by an expert analyst, please invest at your own risk.
.
Follow me for more!

Consolidation breakout in Usha MartinNSE:USHAMART
Currently breaking out from a consolidation within a bigger consolidation (See chart)
Goood volumes today and if a breakout is confirmed by EOD, I think it will go on to breakout from the larger consolidation as well.
Targets for the smaller consolidation amount to 35 points, whereas the targets for the bigger consolidation amount to 55 points, from the point of breakout respectively.
Trading above all imp averages as well indicates good strength of the major bullish trend too
For ideal R:R, a pullback will be the best point of entry!
Keep track.

kabra extrusion bounced good.please keep this chart on your watchlist 600 is very near.
educational purpose only not investment advice.

USHA MARTIN - DAY CHART - 10.02.2023 - BAHAVAN CAPITALUSHA MARTIN as per day chart analysis
Stock ABOVE 195 TARGET 198
Happy Profitable Trading to All..

USHA MARTIN - DAY CHART - 16.01.2023 - BAHAVAN CAPITALUSHA MARTIN as per day chart analysis
Stock ABOVE 189 TARGET 189
Happy Profitable Trading to All...

USHA MARTIN -- Northside momentumUSHAMARTIN moved from 150 levels to 180-190 levels after a long consolidation.
Its above all averages and currently trading above the previous month's high.
If momentum sustains - we can see further upside in this. Add to the watch list.
Can keep this in the radar --& exit once the Previous week's Low is crossed downside.

SYMMETRICAL TRIANGLE BO (USHAMART)NSE: USHAMART
CMP : 160
TARGET 1 : 185
TARGET 2 : 197
STOPLOSS : 132
Note : This is not a buy or sell call, this analysis for educational purpose.

Usha martin triangle breakoutUsha martin symmetric triangle breakout, which is continuation pattern.
size of pattern is rupees 80.
potential targets 165, 190, 220, 280.
keep stop loss 7-8%
Time horizon 6-12 months.
Note : Only for learning, trade at your own risk.

USHA MARTIN Good BONSE:USHAMART
Good to keep on the radar
Always respect SL & position sizing
========================
Trade Secrets By Pratik
========================
Disclaimer
SEBI UNREGISTERED
This is our personal view and this analysis
is only for educational purposes
Please consult your advisor before
investing or trading
You are solely responsible for any decisions
you take on basis of our research.

USHA MARTIN BREAKOUTSymmentrical Triangle Breakout with strong volume ... Must add on cmp ... Targets and stop loss shown in chart ....

USHAMARTIN - Multi-year Breakout - Huge potentialThe analysis is done on weekly TF hence price may take few weeks to few months in order to reach the targets.
Trade setup is explained in image itself.
The above analysis is purely for educational purpose. Traders must do their own study & follow risk management before entering into any trade
Checkout my other ideas to understand how one can earn from stock markets with simple trade setups. Feel Free to comment below this or connect with me for any query or suggestion regarding this stock or Price Action Analysis.

Breakout in USHA MARTINCHART -> USHA MARTIN DAILY SETUP
As per chart after a good up trend in Usha Martin, a good consolidation has been goin on. Today it gave a range breakout not far from 200 DMA and with good volume. Keep this in radar.
Disclaimer: This is for educational purpose only. This is not any recommendations. I am not SEBI registered. Please consult your financial advisor before taking any action.


Multiyear breakout on Monthly Chart |Will it give a good profit?NSE:USHAMART
This stock gave multiyear breakout above Rs 42 level in April 2021. And in this month it has been sustaining above 55.
If in upcoming days if it sustain to remain above 55 then it will be a good buy for short term holding.

USHA MARTIN - DarvasBox / Flag BreakoutI am looking to take a risk here, to ride the Breakout. However, keep a very strict stop loss as per your risk appetite if markets turn weak.

USHAMART heading toward major resistance zoneInverse Head and Shoulder pattern, major reistance zone, Neckline,All time high, trend is strong

