UTI ASSET MNGMT - Bullish Flag & Pole Breakout (Daily T/F)Trade Setup
📌 Stock: UTI ASSET MNGMT ( NSE:UTIAMC )
📌 Trend: Strong Bullish Momentum
📌 Risk-Reward Ratio: 1:3 (Favorable)
🎯 Entry Zone: ₹1220.45(Breakout Confirmation)
🛑 Stop Loss: ₹1141.00(Daily Closing Basis) (-6.6% Risk)
🎯 Target Levels:
₹1253.75
₹1287.95
₹1323.05
₹1355.50
₹1390.60
₹1424.70
₹1461.60 (Final Target)
Technical Rationale
✅ Bullish Flag & Pole Breakout - Classic bullish pattern confirming uptrend continuation
✅ Strong Momentum - Daily, Weekly & Monthly RSI >60 (Bullish zone)
✅ Volume Confirmation - Breakout volume 754.88K vs previous day's 178.21K (Nearly 4.5x surge)
✅ Multi-Timeframe Alignment - Daily and weekly charts showing strength
Key Observations
• The breakout comes with significantly higher volume, validating strength
• Well-defined pattern with clear price & volume breakout
• Conservative stop loss at recent swing low
Trade Management Strategy
• Consider partial profit booking at each target level
• Move stop loss to breakeven after Target 1 is achieved
• Trail stop loss to protect profits as price progresses
Disclaimer ⚠️
This analysis is strictly for educational purposes and should not be construed as financial advice. Trading in equities involves substantial risk of capital loss. Past performance is not indicative of future results. Always conduct your own research, consider your risk appetite, and consult a financial advisor before making any investment decisions. The author assumes no responsibility for any trading outcomes based on this information.
What do you think? Are you watching NSE:UTIAMC for this breakout opportunity? Share your views in the comments!
UTIAMC

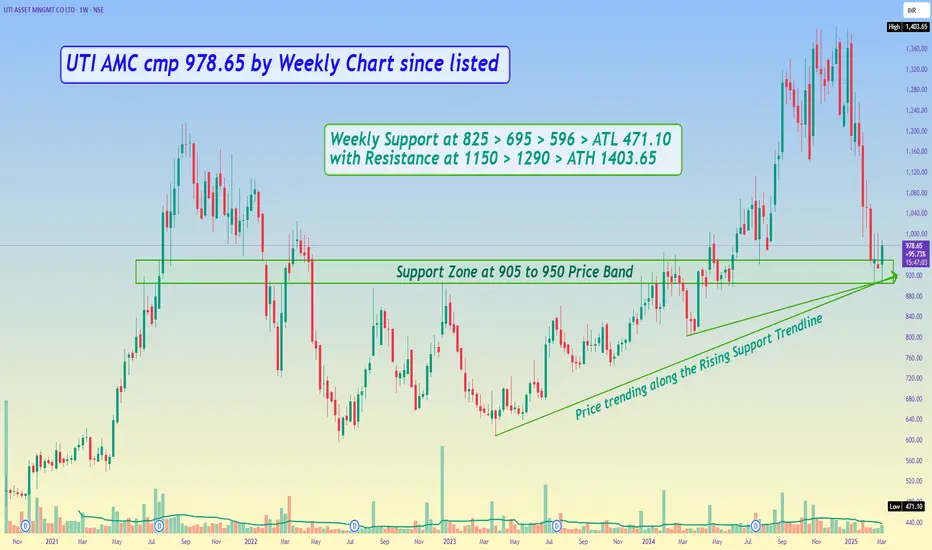
UTI AMC cmp 978.65 by Weekly Chart since listedUTI AMC cmp 978.65 by Weekly Chart since listed
- Support Zone at 905 to 950 Price Band
- Price trending along the Rising Support Trendline
- Weekly Support at 825 > 695 > 596 > ATL 471.10 with Resistance at 1150 > 1290 > ATH 1403.65
UTI ASSET MNGMT#Debt free #Asset #Management company with good ROCE & ROE
given Breakout in #Monthly Chart with good #Volume.
#IPO Price above closed.
#UTIAMC CMP 1334 TGT 1838 SL 1200 (Monthly Clbs)
#Profit #Growth witnessed in last two years with good ROCE
Good FII+DII Holding #Dividend
Follow us for more such suggestions.


Retesting Major Levels UTI AMCNSE:UTIAMC after giving a rounding bottom breakout on weekly charts is now retesting breakout levels. Keep in Radar.
Check out my other stock ideas below until this trade gets activated, I would love your feedback.
Disclaimer: This analysis is intended solely for informational and educational purposes and should not be interpreted as financial advice. It is advisable to consult a qualified financial advisor or conduct thorough research before making investment decisions.

UTIAMC - Rounding Bottom BreakoutUTIAMC has given a long term breakout of 3 years long rounding bottom pattern. Breakout volume is also significant. If it sustain above breakout level, then we can see a good momentum in short term and can expect below level in coming months.
🔊 UTIAMC - UTI ASSET MNGMT CO LTD
⌛Duration - Short Term (6 month to 8 month)
📊📈 Trade Logic - Rounding Bottom Breakout
CMP - ₹1263.70
Time Frame - Weekly
🎯Target 1 : ₹1425
🎯Target 2 : ₹1600
🎯Target 3 : ₹1850
🛑 Stop : ₹1000
🏆 Risk/Reward Ratio (1: 2.5)
Disclaimer: The stock information shared above is not a recommendation to buy, sell, or hold. It reflects my own analysis and is intended solely for educational purposes. Any actions you take based on this information are your responsibility, and the admin of this channel is not liable for any financial gains or losses. Please consult a financial advisor before making any investment decisions. I am not a SEBI-registered advisor.

UTIAMC-DO NOT MISSLogic-Simple weekly resistance breakout, retest and continuation.
Weekly closing above 910 will be a confirmation. 1000 will be immediate resistance.
A good investment stock for long term as well available at a fair valuation with more than 2% dividend yield. I am expecting similar rally as HDFC AMC in this stock but move would be slow.
Not a recommendation, just my personal opinion!

UTI AMC cmp 1187.95 by Weekly Chart views since listedUTI AMC cmp 1187.95 by Weekly Chart views since listed
- Support Zone at 1165 to 1180 Price Band
- Volumes seen rising by spikes intermittently
- Weekly basis : Support at 1123 > 1005 > 895 with Resistance is only at ATH 1219 done today
- 3 years long timeframe Bullish Rounding Bottom completed by New ATH 1219 along with Price and Volumes breakout

UTIAMC | Swing Trade📊 DETAILS
Sector: Finance - Investment
Mkt Cap: 11,921 cr
UTI Asset Management Company Ltd is primarily engaged in the activities of raising funds for and to render investment management services to schemes of UTI Mutual Fund. It is registered with SEBI under the SEBI (Mutual Funds) Regulations, 1996. It was the first to introduce Mutual Funds in India and is focused solely on Investment management and related services.
TTM PE : 23.59 (Average PE)
Sector PE : 42.15
Beta : 0.88
📚 INSIGHTS
MC Insights PRO
Stock with medium financial performance with average price momentum and valuation. These stocks may be affordable and are showing some investors interest.
7.49% away from 52 week high
Outperformer - UTI Asset Management Company up by 6.61% v/s NIFTY 50 down by -0.46% in last 1 month
📈 FINANCIALS
Piotroski Score of 5/9 indicates Average Financials
Disclaimer: This analysis is for educational purposes only, and I'm not a SEBI registered analyst.
If you found this analysis helpful, I encourage you to like and share it. Your observations and comments are also welcomed below. Your support, likes, follows, and comments motivate me to consistently share valuable insights with you.
🔍 More Analysis & Trade Setups 🔍
For more technical analysis and trade setups, make sure to follow me on TradingView: www.tradingview.com

UTIAMC showing a triangular breakoutBeing a pioneer in the mutual fund industry, this company is heavily relied on, especially due to the index funds it is running. This company after a long period since listing in late 2020 (maybe) and touching the top in September 2021, has now shown a good breakout from a triangular consolidation pattern. The consolidation was quite long between the price range of 620 and 860. While the strength is yet to be seen, maybe it will show up after crossing 860. Let's see how it works!


UTIAMC Cup & Handle Breakout BUY!Attached: UTIAMC Daily Live Chart as of 30th June 2023
- Today All AMC Stocks have seen a Massive Upsurge and it appears there are Tailwinds for this Sector hence Strength within these Stocks
- Price has given a Classic Cup and Handle Breakout today on the back of Strong Price Volume Action
One can buy at Current Market Price
For a Target of ~ 900
And Stop Loss < Day Low

UTI ASSET MANAGEMENT CO long term swingStock is fundamentally strong , looking good for medium to long term holding ,also made a double bottom showing buyers coming in , BUY above 710 levels (breakout retest) SL at 650 ,targets given on chart
FUNDAMENTALS :
# 0 debt company
# 60% DIIs holding and FIIs increasing stakes
# Steady growth in profits since 2012
# Reserves increasing
# Stock trading at low PE of 20

UTIAMC for 15% Gain approx..In UTIAMC volume breakout as per on chart and news support it
LTP : 860
TG : 1000
SL : Below 850

UTIAMCNote:
1. Views are personal and for educational purposes only. Recheck and take the trade as per your RR.
2. Always remember SL is your lifeline, not the big target...
3. Follow us for more patterns and like, share so that we feel it is helpful to many and share more patterns...
3. Views given here is not a tip rather it is for educational purpose... Aftermarket opens, the condition might change so learn to handle different conditions...
Keep an eye ladies and gentlemen. Cheers and Happy Trading

UTI AMC - Trendline BreakoutCan go Long if the immediate resistance (Previous Gap) is taken out.
Or can wait for re-tracement and then go Long.
This is only for analysis.

#UTIAMCSimplicity with MIZone acting as support and resistance
Rotation with SC and Trespassing in the previous body

Price DestructionWhen price break any well defined boundary below 200 Day Moving Average, then high probability price the trend .
If we enter after #Breakout then why not exit after #BREAKDOWN .


UTI AMC--> 10% upside potential in short term The above references an opinion and is for information purposes only. It is not intended to be investment advice. Seek a duly licensed professional for investment advice.


UTIAMCNote:
1. Views are personal and for educational purposes only. Recheck and take the trade as per your RR.
2. Always remember SL is your lifeline, not the big target...
3.Follow us for more patterns and like, share so that we feel it is helpful to many and share more patterns...
3. Views given here is not a tip rather it is for educational purpose... Aftermarket opens, the condition might change so learn to handle different conditions...
4. To learn more about patterns, Psychology behind the trade, and price action trading... contact us... Thanks...
Keep an eye ladies and gentlemen. Cheers and Happy Trading
