Buy, Sell, or Skip? Multi Timeframe Support ZonesUncover how support levels across multiple timeframes help clarify key buy/sell decisions—purely for technical education.
Chart used is 3 months old for educational purposes only.
Vasconengineers

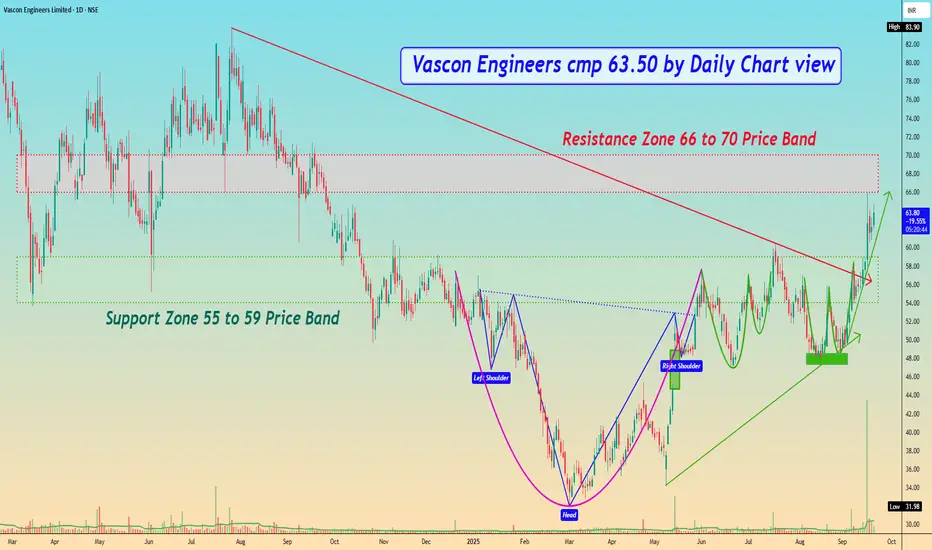
Vascon Engineers cmp 63.50 by Daily Chart viewVascon Engineers cmp 63.50 by Daily Chart view
- Support Zone 55 to 59 Price Band
- Resistance Zone 66 to 70 Price Band
- Heavy Volumes surge based breakout above Support Zone earlier Resistance Zone
- Multiple Bullish Patterns made around Support Zone with Head & Shoulders, Rounding Bottoms, Cup and Handle
Vascon Engineers cmp 55.70 by Weekly Chart viewVascon Engineers cmp 55.70 by Weekly Chart view
- Support Zone 49.50 to 53.50 Price Band
- Resistance Zone 49.50 to 53.50 Price Band
- Volumes are getting close to average traded quantity
- Common Technical Indicators BB, EMA, SAR, MACD, RSI indicating positive trend
- Multiple Bullish Technical Chart patterns have emerged on the Daily and Weekly Charts
- Rounding Bottom, Head & Shoulders, Cup & Handle, VCP, as one may observe and interpret
