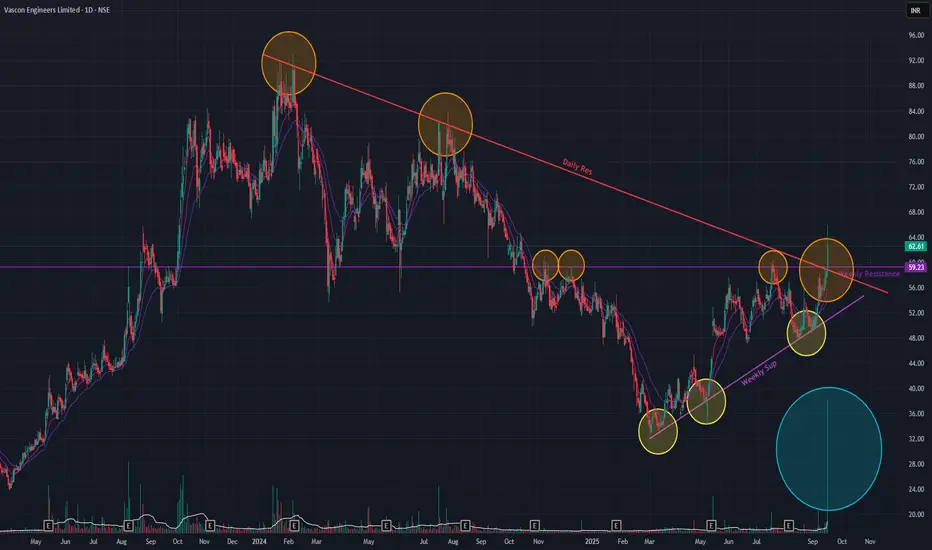
Vascon Eng (Daily Timeframe) - Is this the trend reversal ?Vascon is showing strong indications of a major trend reversal. After forming a series of higher lows since March 2025, the stock has now broken out of a clear Inverted Head & Shoulder pattern on the weekly timeframe.
The breakout is particularly significant as it occurred at a confluence of two major resistance zones: a long-term horizontal trendline dating back to February 2012 and the more recent descending trendline from January 2024. This bullish move was accompanied by a +7.06% surge on high volume and is supported by a positive crossover in the short-term EMAs.
If the bullish momentum continues, the next potential target is the 86 level . Conversely, a failure to sustain the breakout could see the price retrace to support around the 46 level .
Vasconengineersltd
Vascon Engineers cmp 55.70 by Weekly Chart viewVascon Engineers cmp 55.70 by Weekly Chart view
- Support Zone 49.50 to 53.50 Price Band
- Resistance Zone 49.50 to 53.50 Price Band
- Volumes are getting close to average traded quantity
- Common Technical Indicators BB, EMA, SAR, MACD, RSI indicating positive trend
- Multiple Bullish Technical Chart patterns have emerged on the Daily and Weekly Charts
- Rounding Bottom, Head & Shoulders, Cup & Handle, VCP, as one may observe and interpret
