Vaswani Industries LtdVASWANI – The stock is currently trading within an ascending channel pattern and is consolidating near the upper resistance of the channel.
A bullish Marubozu formed a solid green candle with little to no wick, indicating strong buying pressure. Additionally, a bullish engulfing candle fully covers the previous red candle, suggesting a reversal in strength.
If the stock closes above 56, it will confirm a breakout from the consolidation phase, with target prices set at 60 and 64.
Vaswaniinds

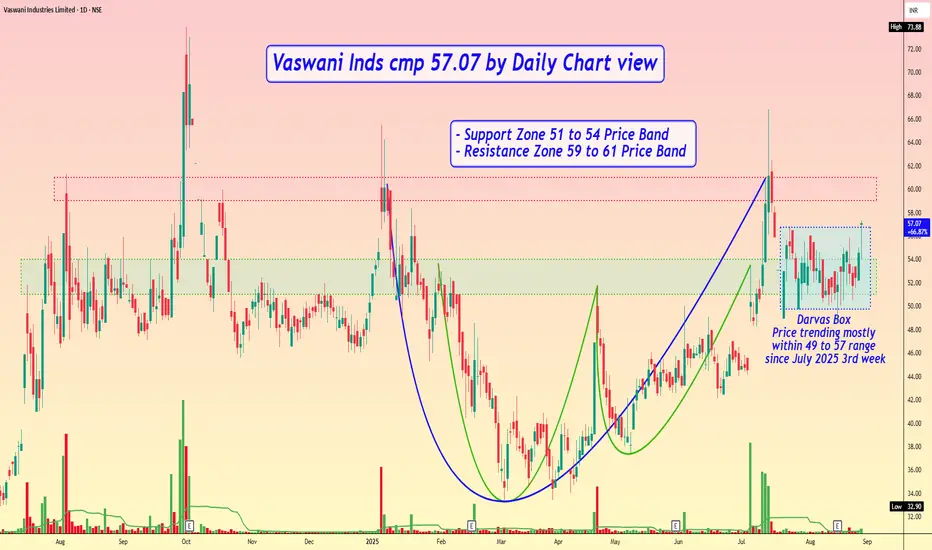
Vaswani Inds cmp 57.07 by Daily Chart viewVaswani Inds cmp 57.07 by Daily Chart view
- Support Zone 51 to 54 Price Band
- Resistance Zone 59 to 61 Price Band
- Volumes are in good sync with average traded quantity
- Bullish Rounding Bottoms made by Support Zone neckline
- Another Large Bullish Rounding Bottom made by Resistance Zone neckline
- Darvas Box - Price trending mostly within 49 to 57 range since July 2025 3rd week
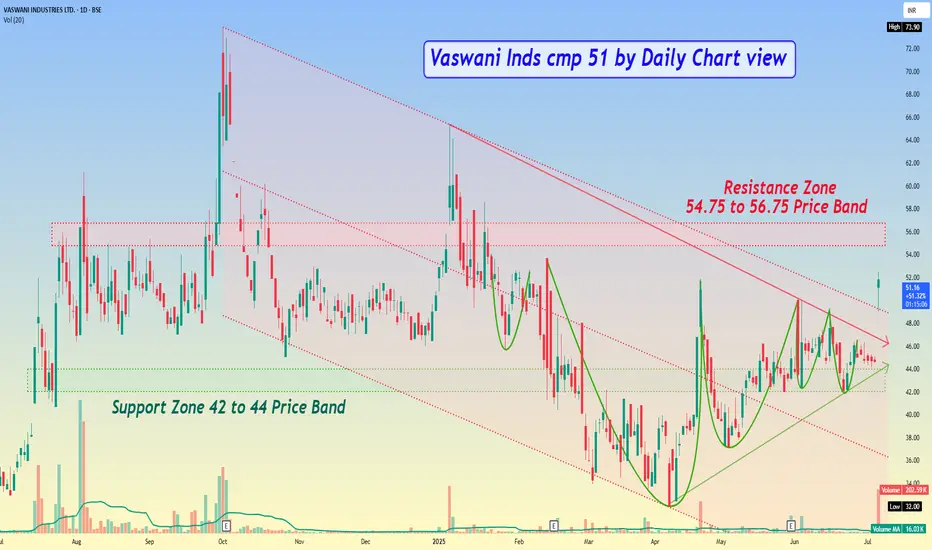
Vaswani Inds cmp 51 by Daily Chart viewVaswani Inds cmp 51 by Daily Chart view
- Support Zone 42 to 44 Price Band
- Resistance Zone 54.75 to 56.75 Price Band
- *Falling Parallel Price Channel Breakout done today*
- Bullish Rounding Bottoms with considerate VCP pattern too
- Heavy Volumes surge today way above average traded quantity
- *Gap Up Opening would need to be filled in and closed sooner or later on*
- *Most common Technical Indicators turning positive for BB, EMA, MACD, RSI, SAR, SuperTrend*