TMB : VCP Short Base BreakoutTMB has just completed a textbook VCP (Volatility Contraction Pattern) consolidation. We observed three clear rejections accompanied by consistent higher lows, along with a noticeable volume dry-up — all classic signs of tightening supply.
This was followed by a clean breakout backed by strong volume expansion, confirming demand stepping in. Fundamentally, both EPS and sales are improving QoQ, which adds further conviction to the setup. Overall, it checks all the boxes for a high-quality VCP trade.
I initiated the position with a conservative 0.1% risk, as I’m currently collecting more data and validating this setup type. Once I gain more confidence in the price action and consistency, I plan to gradually scale up the risk.
📢📢📢
If my perspective changes or if I gather additional fundamental data that influences my views, I will provide updates accordingly.
Thank you for following along with this journey, and I remain committed to sharing insights and updates as my trading strategy evolves. As always, please feel free to reach out with any questions or comments.
Other posts related to this particular position and scrip, if any, will be attached underneath. Do check those out too.
Disclaimer : The analysis shared here is for informational purposes only and should not be considered as financial advice. Trading in all markets carries inherent risks, and past performance is not indicative of future results. It’s essential to conduct your own research and assess your risk tolerance before making any investment decisions. The views expressed in this analysis are solely mine. It’s important to note that I am not a SEBI registered analyst, so the analysis provided does not constitute formal investment advice under SEBI regulations.
Vcppattern

Nifty 50 : The “Trump–Modi” Rally Meets Budget Reality 🇮🇳🇺🇸Right now, the Indian market feels like it’s standing at a very interesting crossroads — both technically and fundamentally. After the wild start to February 2026, what we’re seeing looks more like a relief rally trying to fight against stretched valuations.
From Budget Shock to Trade Deal Pop
Just a few days back, sentiment was terrible.
The Union Budget’s surprise hike in STT on Futures and Options (0.05% and 0.15%) caught traders completely off guard. That one move alone wiped out nearly ₹10 lakh crore in market cap in a single session. The market was in full panic mode.
But then came the twist.
The “Trump–Modi” trade deal on Feb 2 flipped the script overnight.
The U.S. cut reciprocal tariffs on Indian goods from a brutal 50% to 18%, and in return, India agreed to shift energy imports toward the U.S., committing nearly $500 billion in energy and tech deals.
That was enough to light a fire under the market. Nifty responded with one of its strongest single-day moves, jumping 2.55% and reclaiming the 25,700 zone. Pure relief rally.
But I’m Not Chasing This Move Yet
Even with all the excitement, I don’t think this is the time to blindly chase green candles.
The chart still suggests we might need some time-wise consolidation before any serious attempt at new all-time highs.
Key points of concern :
IT is dragging badly. While textiles and gems are flying, Nifty IT is down almost 5% thanks to H-1B fee hikes and weakness in U.S. tech. That’s a heavy index weight to ignore.
Valuations are stretched. Without stronger earnings support, this rally could easily lose steam near the 26,000–26,100 supply zone.
RBI risk ahead. The Feb 6 MPC meeting is key. A rate cut is unlikely, but the tone matters. If the RBI isn’t dovish enough, sentiment can cool quickly.
My Take
For now, I’d rather stay patient.
This move still feels more like a relief bounce than the beginning of a clean, sustainable breakout. I’d rather see some stability and a proper base form before getting aggressive with fresh positions. We can even expect a move to fill the gap formed during the relief rally.
Right now, the moving averages are still in a bearish crossover, which tells me the broader structure hasn’t fully turned bullish yet. Ideally, I want to see the 20-day EMA cross back above the 50-day EMA and, more importantly, the index sustaining above those levels. That kind of strength would give more confidence that the bullish momentum is real and not just a short-term pullback rally.
Until that happens, it’s better to step back, stay patient, and reassess rather than forcing trades.
📢📢📢
If my perspective changes or if I gather additional fundamental data that influences my views, I will provide updates accordingly.
Thank you for following along with this journey, and I remain committed to sharing insights and updates as my trading strategy evolves. As always, please feel free to reach out with any questions or comments.
Other posts related to this particular position and scrip, if any, will be attached underneath. Do check those out too.
Disclaimer : The analysis shared here is for informational purposes only and should not be considered as financial advice. Trading in all markets carries inherent risks, and past performance is not indicative of future results. It’s essential to conduct your own research and assess your risk tolerance before making any investment decisions. The views expressed in this analysis are solely mine. It’s important to note that I am not a SEBI registered analyst, so the analysis provided does not constitute formal investment advice under SEBI regulations.

APLAPOLLO : VCP Breakout with Fundamental ConfirmationInitiated a long position in APLAPOLLO following a high-conviction breakout from a multi-month Volatility Contraction Pattern (VCP). Although the price is currently extended from the 20- and 50-day EMAs, the structural strength of the breakout suggests the beginning of a fresh leg in the uptrend.
From a fundamentals perspective, the company continues to deliver strong and consistent sales and EPS growth, reinforcing its positioning as a proxy for India’s infrastructure-led growth cycle.
To manage the risk associated with being extended from the moving averages, I’ve opted for a wider stop-loss, allowing room for short-term volatility or a potential retest of the breakout zone. This approach gives the trade sufficient breathing space while the moving averages gradually catch up to price.
From a broader market standpoint, the recent ~10% correction in ITC following the government’s cigarette tax announcement has created temporary index-level pressure on the Nifty 50. However, this has triggered a clear sectoral rotation rather than broad-based weakness. Capital is rotating out of regulatory-impacted FMCG names and into high-growth industrial leaders like APL Apollo.
Given its insulation from regulatory shocks and its direct linkage to domestic capex growth, APL Apollo is exhibiting strong relative strength even as the broader market remains range-bound.
Initiated the position with 1% risk.
📢📢📢
If my perspective changes or if I gather additional fundamental data that influences my views, I will provide updates accordingly.
Thank you for following along with this journey, and I remain committed to sharing insights and updates as my trading strategy evolves. As always, please feel free to reach out with any questions or comments.
Other posts related to this particular position and scrip, if any, will be attached underneath. Do check those out too.
Disclaimer : The analysis shared here is for informational purposes only and should not be considered as financial advice. Trading in all markets carries inherent risks, and past performance is not indicative of future results. It’s essential to conduct your own research and assess your risk tolerance before making any investment decisions. The views expressed in this analysis are solely mine. It’s important to note that I am not a SEBI registered analyst, so the analysis provided does not constitute formal investment advice under SEBI regulations.

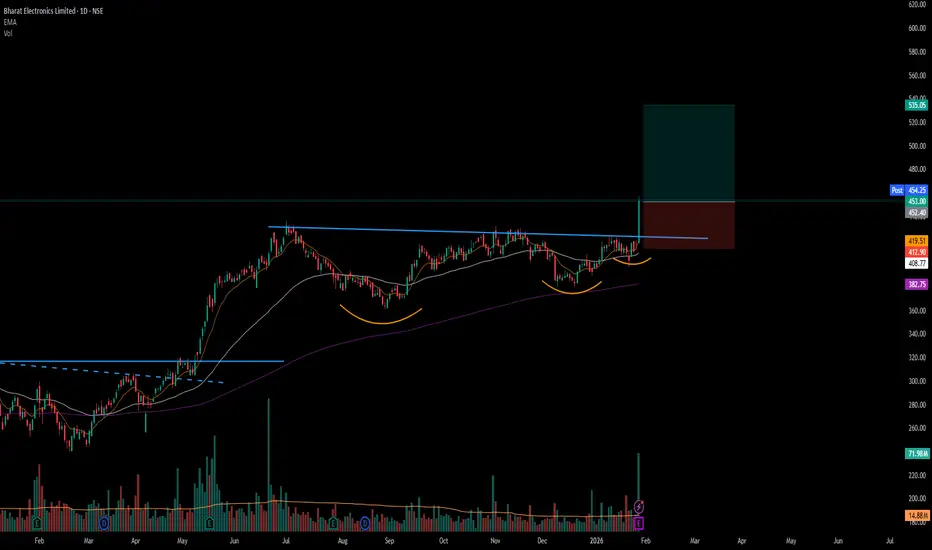
#BEL - VCP BreakOut in Daily Time Frame Script: BEL
Key highlights: 💡⚡
📈 VCP BreakOut in Daily Time Frame
📈 Volume spike during Breakout
📈 Base BreakOut
📈 RS Line making 52WH
📈 MACD Crossover
⚠️ Important: Market conditions are BAD, Avoid entering any Trade. Protect Capital Always
⚠️ Important: Always Exit the trade before any Event.
⚠️ Important: Always maintain your Risk:Reward Ratio as 1:2, with this RR, you only need a 33% win rate to Breakeven.
✅ Boost and Follow to never miss a new idea!✅
Disclaimer: I am not SEBI Registered Advisor. My posts are purely for training and educational purposes. Not a BUY or SELL recommendation.
Eat🍜 Sleep😴 TradingView📈 Repeat 🔁
Happy learning with MMT. Cheers!🥂
#DCBBANK - BreakOut in DTF with Volume Script: DCBBANK
Key highlights: 💡⚡
📈 C&H BreakOut in Daily Time Frame
📈 Volume spike during Breakout
📈 Base BreakOut
📈 RS Line making 52WH
📈 MACD Crossover
BUY ONLY ABOVE 200 DCB
⏱️ C.M.P 📑💰- 199.62
🟢 Target 🎯🏆 – 12%
⚠️ Stoploss ☠️🚫 – 6%
⚠️ Important: Market conditions are BAD, Avoid entering any Trade. Protect Capital Always
⚠️ Important: Always Exit the trade before any Event.
⚠️ Important: Always maintain your Risk:Reward Ratio as 1:2, with this RR, you only need a 33% win rate to Breakeven.
✅ Boost and Follow to never miss a new idea!✅
Disclaimer: I am not SEBI Registered Advisor. My posts are purely for training and educational purposes. Not a BUY or SELL recommendation.
Eat🍜 Sleep😴 TradingView📈 Repeat 🔁
Happy learning with MMT. Cheers!🥂

BPCL : Trading the Confluence of Price Action & Macro TailwindsThe stock has been consolidating within a defined range over the past few weeks and has recently started forming a solid base. While the breakout volume isn’t a classic “God-candle,” price action continues to hold firmly above key moving averages, which is a constructive sign. That said, the price is somewhat extended from the EMAs, increasing the probability of a mean-reversion move. Hence, the stop loss needs to be placed wider rather than just below the basing structure.
The conviction behind this trade comes largely from the current Goldilocks macro environment we’re witnessing in early 2026. With global crude prices remaining comfortably low, BPCL is benefiting from strong marketing margins across petrol and diesel, supporting near-term earnings visibility.
On the fundamental side, a major catalyst is the Government’s LPG compensation package. BPCL is expected to receive a significant share of the ₹30,000 crore payout allocated to OMCs, which materially improves cash flows in H2 FY26. This inflow also acts as a strong deleveraging trigger, further strengthening an already improving balance sheet that has seen a steady decline in debt-equity levels over recent quarters.
So took this position with 1% risk on the net capital.
📢📢📢
If my perspective changes or if I gather additional fundamental data that influences my views, I will provide updates accordingly.
Thank you for following along with this journey, and I remain committed to sharing insights and updates as my trading strategy evolves. As always, please feel free to reach out with any questions or comments.
Other posts related to this particular position and scrip, if any, will be attached underneath. Do check those out too.
Disclaimer : The analysis shared here is for informational purposes only and should not be considered as financial advice. Trading in all markets carries inherent risks, and past performance is not indicative of future results. It’s essential to conduct your own research and assess your risk tolerance before making any investment decisions. The views expressed in this analysis are solely mine. It’s important to note that I am not a SEBI registered analyst, so the analysis provided does not constitute formal investment advice under SEBI regulations.

Indian Bank - VCP BreakoutAfter 4 months of Ascending Trend we saw two and half months of horizontal consolidation. This consolidation was formed by way of a volatility contraction pattern. What we have witnessed today is a break out from the vcp with volume suggesting it may not be a fakeout.

NIFTYBEES : Position to systematically de-risk BPCL tradeToday’s sharp correction in BPCL and the broader Oil & Gas space reflects a classic “geopolitical discount.” With the U.S. threatening a steep 500% tariff, uncertainty around OMC earnings has surged, triggering risk-off positioning across the sector.
In response, I’m de-risking the portfolio by initiating an allocation into Nifty BeES. The Nifty 50 is currently consolidating around its 20-day and 50-day EMAs, a zone that historically acts as a strong demand area. The probability of price finding support at these levels and staging a rebound remains high.
While BPCL faces near-term headwinds from potential inventory losses and pressure from discounted Russian crude dynamics, the Nifty 50 is structurally supported by its Banking and IT heavyweights, which continue to benefit from improving earnings visibility and relative global stability.
This trade is therefore not a directional bet alone, but a strategic hedge—aimed at balancing portfolio risk, reducing volatility, and maintaining market participation amid heightened geopolitical uncertainty.
📢📢📢
If my perspective changes or if I gather additional fundamental data that influences my views, I will provide updates accordingly.
Thank you for following along with this journey, and I remain committed to sharing insights and updates as my trading strategy evolves. As always, please feel free to reach out with any questions or comments.
Other posts related to this particular position and scrip, if any, will be attached underneath. Do check those out too.
Disclaimer : The analysis shared here is for informational purposes only and should not be considered as financial advice. Trading in all markets carries inherent risks, and past performance is not indicative of future results. It’s essential to conduct your own research and assess your risk tolerance before making any investment decisions. The views expressed in this analysis are solely mine. It’s important to note that I am not a SEBI registered analyst, so the analysis provided does not constitute formal investment advice under SEBI regulations.

NIFTY : 50 D EMA Breach – A Key Level to Track📊 NIFTY – Technical View
• Nifty has closed below the 50-Day EMA, signalling short-term trend weakness.
• The previous 50 D EMA breach occurred around 25th September 2025.
• Notably, during that phase, the critical swing low formed just before the EMA breach was respected, acting as a strong base for the subsequent rally.
• A similar structure is visible now — the recent critical low before the current 50 D EMA breach becomes a key level to track.
• Price rejection near the upper channel / ATH zone highlights distribution at higher levels.
• As long as Nifty trades below the 50 D EMA, rallies are likely to face selling pressure.
I currently hold a position in NIFTYBEES. If the market fails to recover from current levels, there is a high probability that the stop-loss on this position may get triggered. I will continue to manage the trade strictly based on price action and risk parameters.
🧠 Market Character: Transitioning from buy-the-dip to selective, risk-managed trades.
⚠️ Focus: Protect capital, track the marked critical low, and stay reactive.
📢📢📢
If my perspective changes or if I gather additional fundamental data that influences my views, I will provide updates accordingly.
Thank you for following along with this journey, and I remain committed to sharing insights and updates as my trading strategy evolves. As always, please feel free to reach out with any questions or comments.
Other posts related to this particular position and scrip, if any, will be attached underneath. Do check those out too.
Disclaimer : The analysis shared here is for informational purposes only and should not be considered as financial advice. Trading in all markets carries inherent risks, and past performance is not indicative of future results. It’s essential to conduct your own research and assess your risk tolerance before making any investment decisions. The views expressed in this analysis are solely mine. It’s important to note that I am not a SEBI registered analyst, so the analysis provided does not constitute formal investment advice under SEBI regulations.

CSBBANK : Momentum Breakout with Sector StrengthThis trade is a classic momentum breakout setup. The price had been consolidating in a range since August 2025 and has now broken out with strong volume, indicating fresh participation. The broader finance and banking sector is also showing strength, which adds further confluence to the trade. Additionally, recent sales and EPS growth have been encouraging, supporting the bullish bias from a fundamentals perspective.
The only concern is that the price is currently extended from the 20 and 50 EMA, and there wasn’t a very clear basing structure before the breakout. However, considering the overall momentum and sectoral support, this can be managed by allowing some breathing room and using a slightly wider stop loss.
Based on this setup, the trade has been initiated with a defined risk of 1%.
📢📢📢
If my perspective changes or if I gather additional fundamental data that influences my views, I will provide updates accordingly.
Thank you for following along with this journey, and I remain committed to sharing insights and updates as my trading strategy evolves. As always, please feel free to reach out with any questions or comments.
Other posts related to this particular position and scrip, if any, will be attached underneath. Do check those out too.
Disclaimer : The analysis shared here is for informational purposes only and should not be considered as financial advice. Trading in all markets carries inherent risks, and past performance is not indicative of future results. It’s essential to conduct your own research and assess your risk tolerance before making any investment decisions. The views expressed in this analysis are solely mine. It’s important to note that I am not a SEBI registered analyst, so the analysis provided does not constitute formal investment advice under SEBI regulations.

Sai Life Sciences cmp 921.70 by the Daily Chart view since listeSai Life Sciences cmp 921.70 by the Daily Chart view since listed
- Support Zone 865 to 895 Price Band
- Resistance Zone 923 to ATH 943 Price Band
- Volumes are regularly spiking well above the average traded quantity
- Darvas Bos Setup seems like repeated basis the current technical chart setup
- Rising Price Channels are in good sync to each other at ending and fresh new start
- Considerate Bullish Rounding Bottoms and/or Rising VCP pattern, as one may interpret
- Darvas Box Setup : Stock trending within 845 to ATH 943 price band since ATH on 25-Aug-2025

Graphite India : VCP pattern ! Money may Double in 1.5 YearsHi Friends,
Graphite India looks promising now after ~08 years of time & price wise correction period. I am anticipating the stock to start its upward journey.
Chart Pattern : VCP
Targets, Stoploss & Entry price is mentioned in the chart .
Please feel free to share your views regarding this chart & analysis .
Note : I am not a SEBI registered advisor . Please consider my analysis only for Education purpose .

#AUTOBEES - VCP BO in DTFScript: AUTOBEES
Key highlights: 💡⚡
📈 VCP BO in DTF
📈 Volume spike seen during Breakout
📈 MACD Bounce
📈 RS Line making 52WH
📈 Sector is strong
If you have any doubts about the setup, drop a comment and I’ll reply.
✅Boost and follow to never miss a new idea! ✅
⚠️ Important: Always Exit the trade before any Event.
⚠️ Important: Always maintain your Risk:Reward Ratio as 1:2, with this RR, you only need a 33% win rate to Breakeven.
⚠️Disclaimer: I am not SEBI Registered Advisor. My posts are purely for training and educational purposes.
Eat🍜 Sleep😴 TradingView📈 Repeat 🔁

#CRAFTSMAN - VCP BO in DTFScript: CRAFTSMAN
Key highlights: 💡⚡
📈 VCP BO in DTF
📈 Volume spike seen during Breakout
📈 MACD Bounce
📈 RS Line making 52WH
✅Boost and follow to never miss a new idea! ✅
✅ If you have any doubts about the setup, drop a comment and I’ll reply.
⚠️ Important: Always Exit the trade before any Event.
⚠️ Important: Always maintain your Risk:Reward Ratio as 1:2, with this RR, you only need a 33% win rate to Breakeven.
⚠️Disclaimer: I am not SEBI Registered Advisor. My posts are purely for training and educational purposes.
Eat🍜 Sleep😴 TradingView📈 Repeat 🔁

#WELINV - VCP BO in DTFScript: WELINV
Key highlights: 💡⚡
📈 VCP BO in DTF
📈 Volume spike seen during Breakout
📈 MACD Bounce
📈 RS Line making 52WH
⚠️ Important: Always Exit the trade before any Event.
⚠️ Important: Always maintain your Risk:Reward Ratio as 1:2, with this RR, you only need a 33% win rate to Breakeven.
✅Boost and follow to never miss a new idea! ✅
Disclaimer: I am not SEBI Registered Advisor. My posts are purely for training and educational purposes.
Eat🍜 Sleep😴 TradingView📈 Repeat 🔁

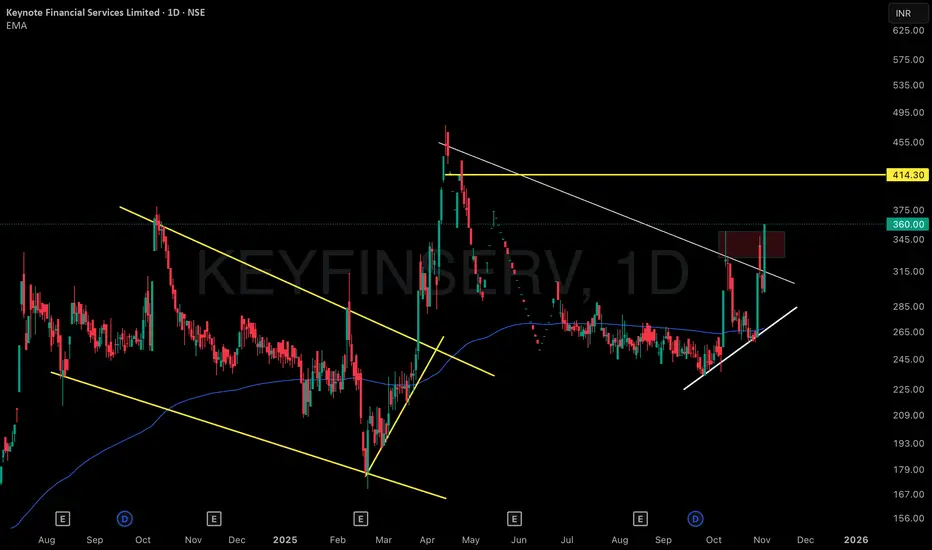
Recurring VCP Structures: Multi-Phase Consolidation & Expansion1 . This chart distinctly showcases a series of visually captivating Volatility Contraction Patterns (VCPs) across multiple phases, elegantly demarcated by yellow trendlines that map out both historical and present consolidation zones. Each contraction zone is marked by repeated, precise touches on trend boundaries, reflecting steady accumulation followed by eruptive volatility and sharp price expansions—almost like a pattern “echo” cycling through the chart.
2 . The highlighted VCP structures reveal not just one, but several contraction-and-expansion cycles, creating an intricate tapestry of market behaviour. Note how each phase includes a concentrated period of sideways price movement, where activity compresses before unleashing swift, directional breakouts. The interplay of these phases turns the chart into a textbook reference for sequential VCP observation, with periods of quiet consolidation—almost like calm before a storm—setting the stage for pronounced volatility bursts.
3 . Recent activity amplifies this effect: vivid volatility swings transition rapidly into tight consolidation, echoing earlier pattern cycles and further emphasizing the recurring structural nature. These technical formations, combined with strong boundary touches and clear momentum surges, make the chart an excellent study in pattern recognition, volatility monitoring, and visual market structure analysis—all shared purely for observational insight, with no predictions or directional bias.
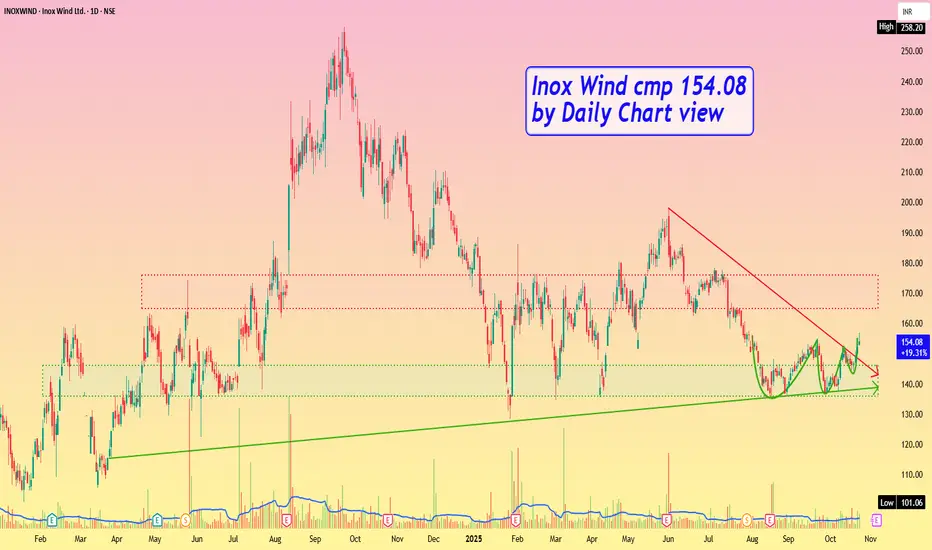
Inox Wind cmp 154.08 by Daily Chart viewInox Wind cmp 154.08 by Daily Chart view
- Support Zone 136 to 146 Price Band
- Resistance Zone 165 to 176 Price Band
- Volumes in good sync with avg traded quantity
- Falling Resistance Trendline Breakout seems sustained
- VCP pattern seems in making process by technical chart setup
UJJIVANSFB - VCP Breakout in DTF Script: UJJIVANSFB
Key highlights: 💡⚡
📈 VCP Breakout in DTF
📈 Short consolidation below Resistance
📈 Volume spike seen during Breakout.
📈 MACD Bounce
📈 Can go for a swing trade
⚠️ Important: Always Exit the trade before any Event.
⚠️ Important: Always maintain your Risk:Reward Ratio as 1:2, with this RR, you only need a 33% win rate to Breakeven.
✅Like and follow to never miss a new idea!✅
Disclaimer: I am not SEBI Registered Advisor. My posts are purely for training and educational purposes.
Eat🍜 Sleep😴 TradingView📈 Repeat 🔁

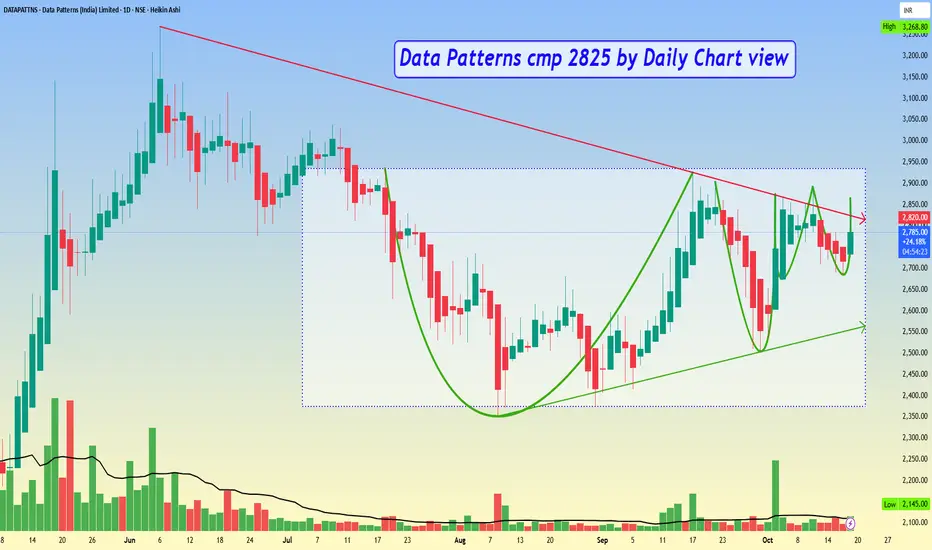
Data Patterns cmp 2825 by Daily Chart viewData Patterns cmp 2825 by Daily Chart view
* Support Zone 2585 to 2685 Price Band
* Resistance Zone 2935 to 3065 Price Band
* Stock has made a near tight and contracting VCP pattern
* Falling Resistance Trendline Breakout in the making process
* Darvas Box pattern with price trending between 2375 to 2935
* Bullish Rounding Bottom formed by the Resistance Zone neckline
* Volumes spiking intermittently by good numbers over past few weeks
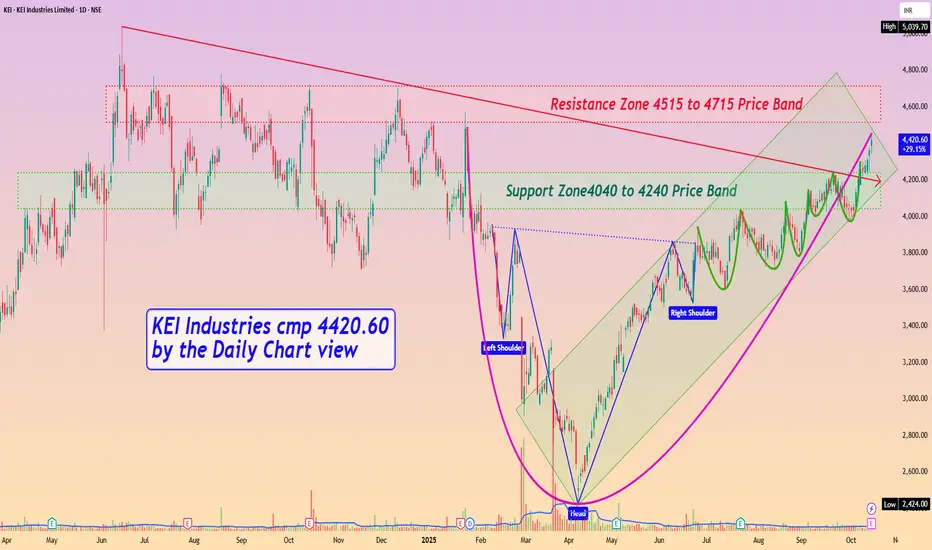
KEI Industries cmp 4420.60 by Daily Chart viewKEI Industries cmp 4420.60 by Daily Chart view
- Support Zone4040 to 4240 Price Band
- Resistance Zone 4515 to 4715 Price Band
- Falling Resistance Trendline Breakout seems sustained
- Support Zone under test retest phase over the past few days
- Price seen is traversing inside Rising Parallel Parallel Price Channel
- Volumes are seen to be in close sync with the average traded quantity
- Multiple Bullish Patterns formed of Rounding Bottom, Head & Shoulder and a tight VCP too
#CARRARO - Large Base BreakOut Script: CARRARO
Key highlights: 💡⚡
📈 VCP BreakOut in Daily Time Frame
📈 Volume spike during Breakout
📈 Large Base BreakOut
📈 MACD Bounce
📈 Can go for a swing trade
BUY ONLY ABOVE 514 DCB
⏱️ C.M.P 📑💰- 507
🟢 Target 🎯🏆 – 24%
⚠️ Stoploss ☠️🚫 – 12%
⚠️ Important: Market conditions are Okish, Position size 50% per Trade. Protect Capital Always
⚠️ Important: Always Exit the trade before any Event.
⚠️ Important: Always maintain your Risk:Reward Ratio as 1:2, with this RR, you only need a 33% win rate to Breakeven.
✅Like and follow to never miss a new idea!✅
Disclaimer: I am not SEBI Registered Advisor. My posts are purely for training and educational purposes.
Eat🍜 Sleep😴 TradingView📈 Repeat 🔁

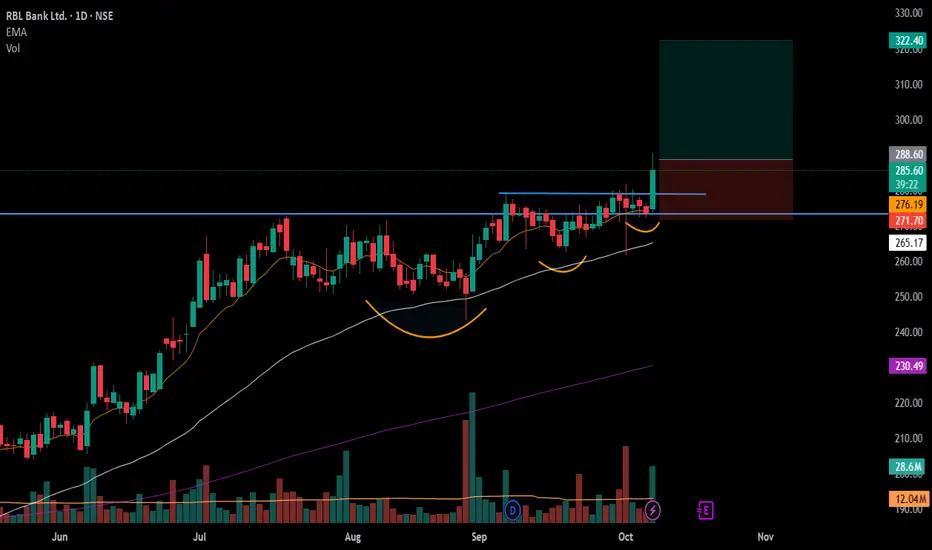
#RBLBANK - VCP BreakOut in Daily Time FrameScript: RBLBANK
Key highlights: 💡⚡
📈 VCP BreakOut in Daily Time Frame
📈 Volume spike during Breakout
📈 Large Base BreakOut – Zoom Out
📈 Private Bank Sector showing strength
📈 Can go for a swing trade
BUY ONLY ABOVE 288 DCB
⏱️ C.M.P 📑💰- 286.90
🟢 Target 🎯🏆 – 12%
⚠️ Stoploss ☠️🚫 – 6%
⚠️ Important: Market conditions are Bad, Position size 25% per Trade. Protect Capital Always
⚠️ Important: Always Exit the trade before any Event.
⚠️ Important: Always maintain your Risk:Reward Ratio as 1:2, with this RR, you only need a 33% win rate to Breakeven.
✅Like and follow to never miss a new idea!✅
Disclaimer: I am not SEBI Registered Advisor. My posts are purely for training and educational purposes.
Eat🍜 Sleep😴 TradingView📈 Repeat 🔁
Happy learning with MMT. Cheers!🥂
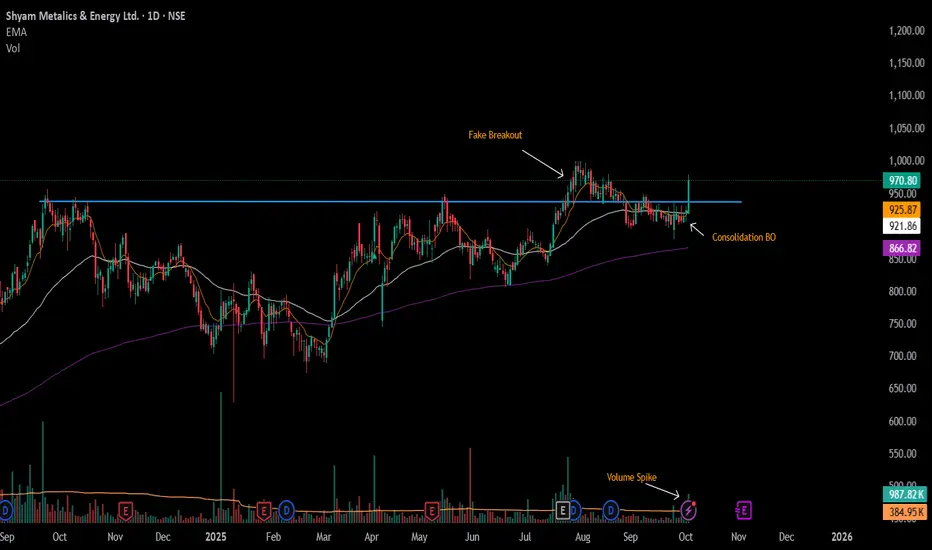
#SHYAMMETL - 2nd BreakOut in DTFScript: SHYAMMETL
Key highlights: 💡⚡
📈 VCP BreakOut in DTF which Failed
📈 2nd BreakOut in DTF after a short consolidation below Resistance
📈 Volume spike seen during Breakout.
📈 MACD Bounce
📈 Can go for a swing trade
⚠️ Important: Always Exit the trade before any Event.
⚠️ Important: Always maintain your Risk:Reward Ratio as 1:2, with this RR, you only need a 33% win rate to Breakeven.
✅Like and follow to never miss a new idea!✅
Disclaimer: I am not SEBI Registered Advisor. My posts are purely for training and educational purposes.
Eat🍜 Sleep😴 TradingView📈 Repeat 🔁