Potential Mega Breakout from Multi-Month ConsolidationTimeframe: Daily Chart | Analysis Type: Pure Price Action
🎯 Idea Summary
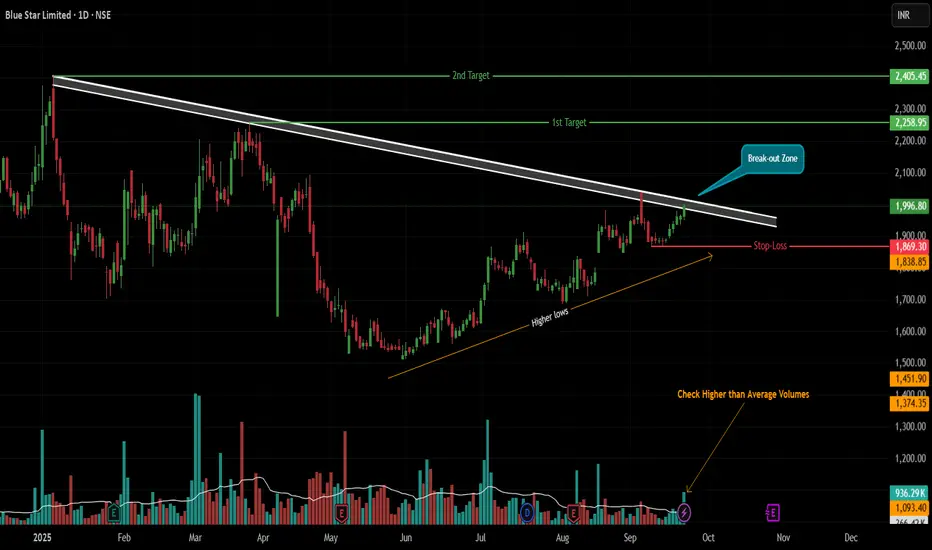
BLUESTAR is showcasing a textbook-perfect technical setup! A multi-month Descending Trendline resistance is converging with a bullish series of Higher Lows, forming a tight Volume Contraction Pattern (VCP). The stock is now squeezing at the apex, suggesting a powerful explosive move is on the horizon. A confirmed breakout could signal the start of a major bullish wave!
📊 Technical Rationale (Pure Price Action)
⚡ Major Descending Trendline (Resistance):
This key trendline originates from the swing high on 6th January 2025 📅.
It has been tested and respected as strong resistance on 25th March, 4th September, and 22nd September 2025. Each touch confirms the selling pressure. A breakout signifies a major trend reversal.
💪 Bullish Higher Lows & VCP (Strength):
Since 2nd June 2025, the stock has crafted a beautiful series of Higher Lows (HL) ↗️.
This shows buyers are aggressively defending higher levels, building a solid base for the next leg up. The contraction in price swings forms a Volume Contraction Pattern (VCP), indicating energy compression before a big expansion.
🧨 The Convergence (The Trigger):
Price is now knocking at the trendline resistance again. The coiling action is ultra-tight, suggesting a high-potential breakout is imminent!
⚖️ Trade Strategy
✅ Trigger for Entry: A BUY is triggered ONLY on a strong daily candle CLOSE ABOVE the descending trendline.
🔍 Confirmation Criteria (CRITICAL):
1) Volume: The breakout must be on VERY HIGH volume 📈. This is non-negotiable to confirm real buying interest and avoid fakeouts.
2) Candle Strength: The perfect signal is a thick, green Marubozu candle 🟢 (strong buying from open to close).
🛡️ Stop Loss (SL):
Aggressive: Low of the breakout candle.
Positional/Conservative: 1869 (The anchor of the HL structure).
🎯 Price Targets:
Target 1: 2258
Target 2: 2405
📌 Management: After T1, trail your stop loss to lock in profits on the way to T2.
⚠️ Key Considerations
⏳ Patience is a Virtue: Wait for the daily candle to CLOSE above the trendline. No premature entries!
🚫 False Breakout Risk: A weak close or low volume is a red flag. Stick to the rules.
✨ Pure Price Action: No lagging indicators. Just clean supply/demand analysis.
Disclaimer: This is an educational idea and not financial advice. Trading carries risk. Always do your own research and manage risk appropriately.
✨ Let me know if you spot the setup! Good luck and trade safe! ✨
Vcppattern
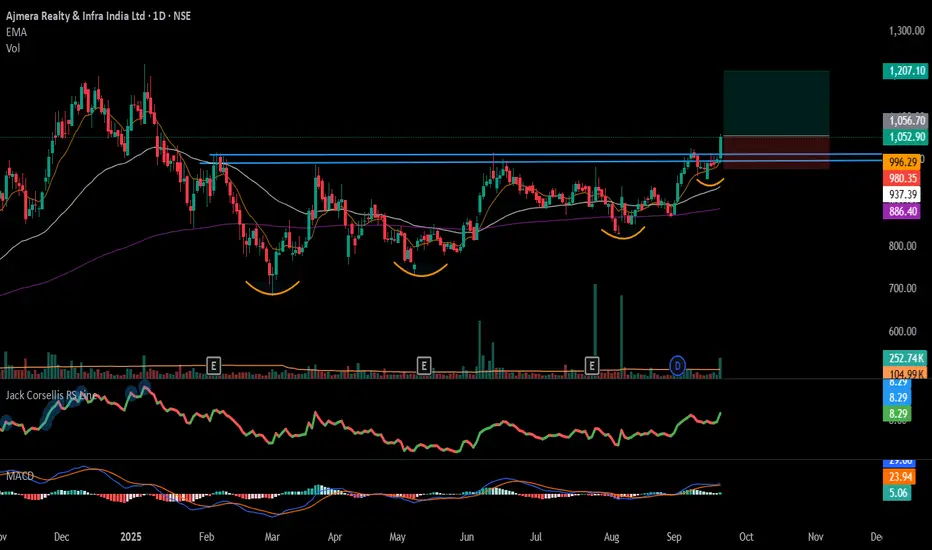
#AJMERA - VCP BreakOut in Daily Time Frame Script: AJMERA
Key highlights: 💡⚡
📈 VCP BreakOut in Daily Time Frame
📈 Volume spike during Breakout
📈 MACD Crossover
📈 Can go for a swing trade
BUY ONLY ABOVE 1055 DCB
⏱️ C.M.P 📑💰- 1052
🟢 Target 🎯🏆 – 15%
⚠️ Stoploss ☠️🚫 – 7.50%
⚠️ Important: Market conditions are Okish, Position size 50% per Trade. Protect Capital Always
⚠️ Important: Always Exit the trade before any Event.
⚠️ Important: Always maintain your Risk:Reward Ratio as 1:2, with this RR, you only need a 33% win rate to Breakeven.
✅Like and follow to never miss a new idea!✅
Disclaimer: I am not SEBI Registered Advisor. My posts are purely for training and educational purposes.
Eat🍜 Sleep😴 TradingView📈 Repeat 🔁
Happy learning with MMT. Cheers!🥂
LAURUSLABS : Breakout Stock#LAURUSLABS #vcppattern #vcpbreakout #breakoutstock #trendingstock
LAURUSLABS : Swing Trade / Short Term
>> Rally - Base - now ready for RAlly
>> Base = Beautiful Vcp pattern
>> VCP pattern Breakout with Volumes
>> Trending stock in Momentum
>> Good Strength & Volumes
Swing Traders can lock profit at 10% and keep Trailing
Please Boost, comment and follow us for more Learnings.
Disc : Charts shared are for learning purpose only, not a Trade recommendation. Do your own research and consult your financial advisor before taking any position.

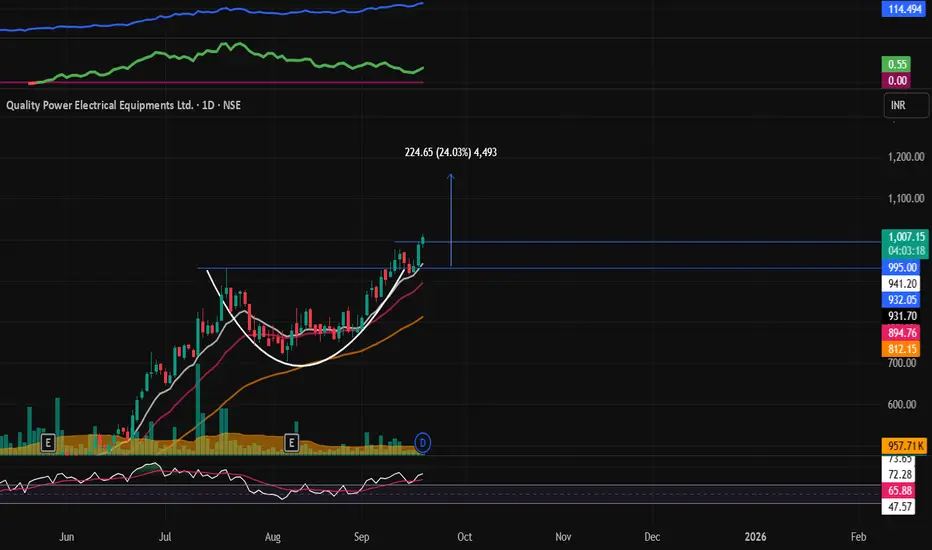
QPOWER : Breakout Stock#QPOWER #vcppattern #breakoutstock #momentumtrade #trendingstock #swingtrade
QPOWER : Momentum Pick
>> VCP Pattern
>> Breakout & Retest done
>> Trending stock
>> Good strength & Volumes building up
>> Good Upside potential
Swing Traders can lock profit at 10% and keep Trailing
Please Boost, comment and follow us for more Learnings.
Disc : Charts shared are for learning purpose only, not a Trade recommendation. Do your own research and consult your financial advisor before taking any position.
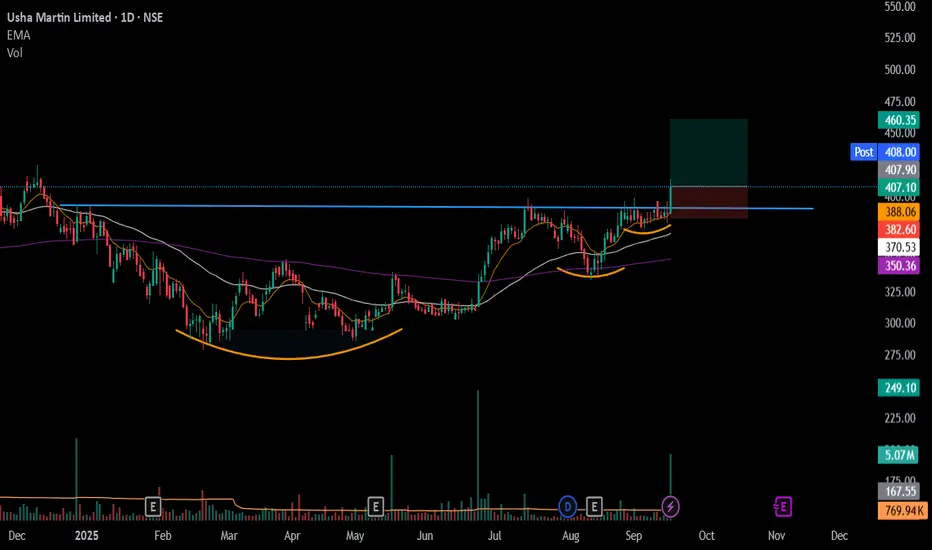
#USHAMART - VCP BreakOut in Daily Time Frame Script: USHAMART
Key highlights: 💡⚡
📈 VCP BreakOut in Daily Time Frame
📈 Price consolidated near Resistance before BO
📈 Volume spike during Breakout
📈 MACD Crossover
📈 Stock is near ATH
📈 Can go for a swing trade
BUY ONLY ABOVE 410 DCB
⏱️ C.M.P 📑💰- 407
🟢 Target 🎯🏆 – 12.90%
⚠️ Stoploss ☠️🚫 – 6.20%
⚠️ Important: Market conditions are Okish, Position size 50% per Trade. Protect Capital Always
⚠️ Important: Always Exit the trade before any Event.
⚠️ Important: Always maintain your Risk:Reward Ratio as 1:2, with this RR, you only need a 33% win rate to Breakeven.
✅Like and follow to never miss a new idea!✅
Disclaimer: I am not SEBI Registered Advisor. My posts are purely for training and educational purposes.
Eat🍜 Sleep😴 TradingView📈 Repeat 🔁
Happy learning with MMT. Cheers!🥂
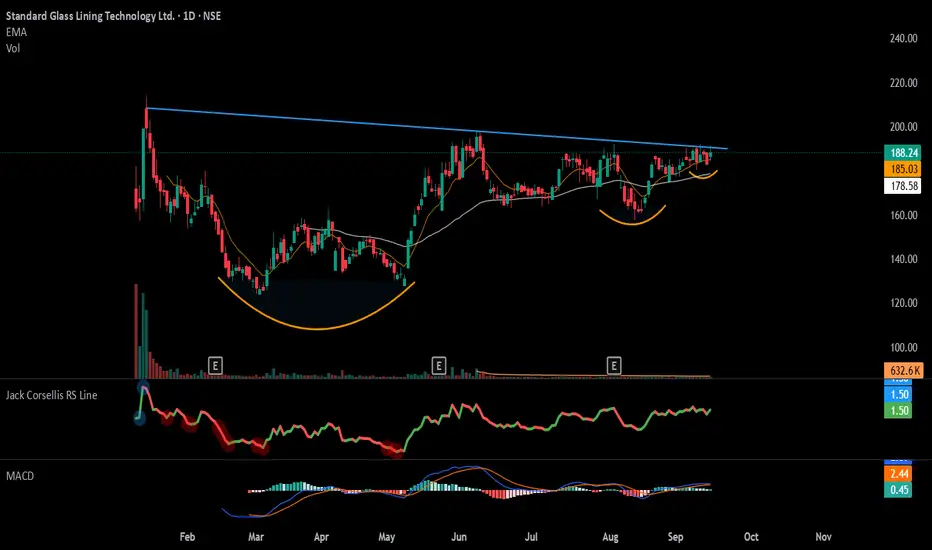
#SGLTL - IPO Base / VCP Set up in DTF Script: SGLTL
Key highlights: 💡⚡
📈 IPO Base set up in Daily Time Frame
📈 Wait for Volume spike during Breakout
📈 VCP Set up in DTF also
📈 Can go for a swing trade
BUY ONLY ABOVE 196 DCB
⏱️ C.M.P 📑💰- 185
🟢 Target 🎯🏆 – NA%
⚠️ Stoploss ☠️🚫 – NA%
⚠️ Important: Market conditions are Okish, Position size 50% per Trade. Protect Capital Always
⚠️ Important: Always Exit the trade before any Event.
⚠️ Important: Always maintain your Risk:Reward Ratio as 1:2, with this RR, you only need a 33% win rate to Breakeven.
✅Like and follow to never miss a new idea!✅
Disclaimer: I am not SEBI Registered Advisor. My posts are purely for training and educational purposes.
Eat🍜 Sleep😴 TradingView📈 Repeat 🔁
Happy learning with MMT. Cheers!🥂
SLong
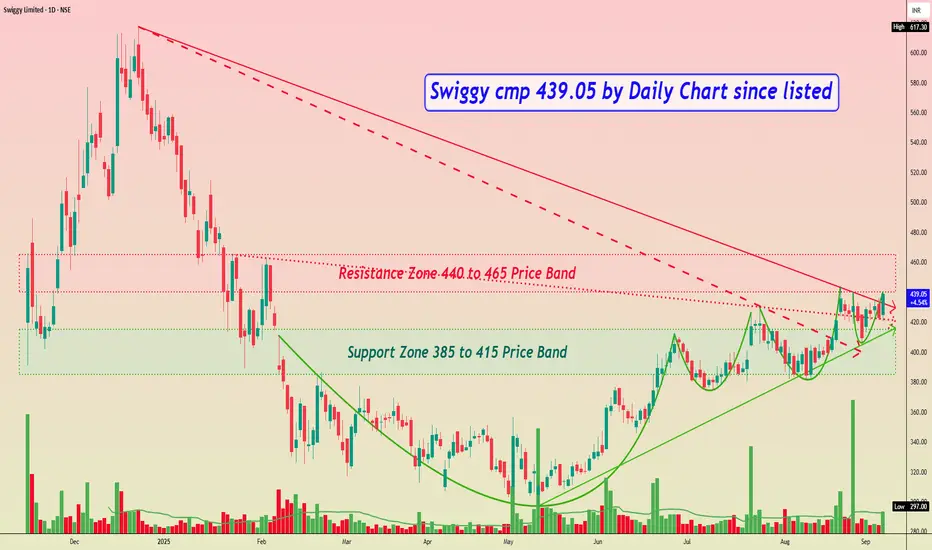
Swiggy cmp 439.05 by Daily Chart since listedSwiggy cmp 439.05 by Daily Chart since listed
- Support Zone 385 to 415 Price Band
- Resistance Zone 440 to 465 Price Band
- Rising Support Trendline well respected by Price momentum
- Bullish Cup and Handle followed by small Rounding Bottoms or a closely considerate VCP pattern
- Falling Resistance Trendline Breakout attempted with older Resistance Trendlines Breakout well sustained
- Volumes are spiking heavily at intermittent intervals and staying in close sync with the average traded quantity
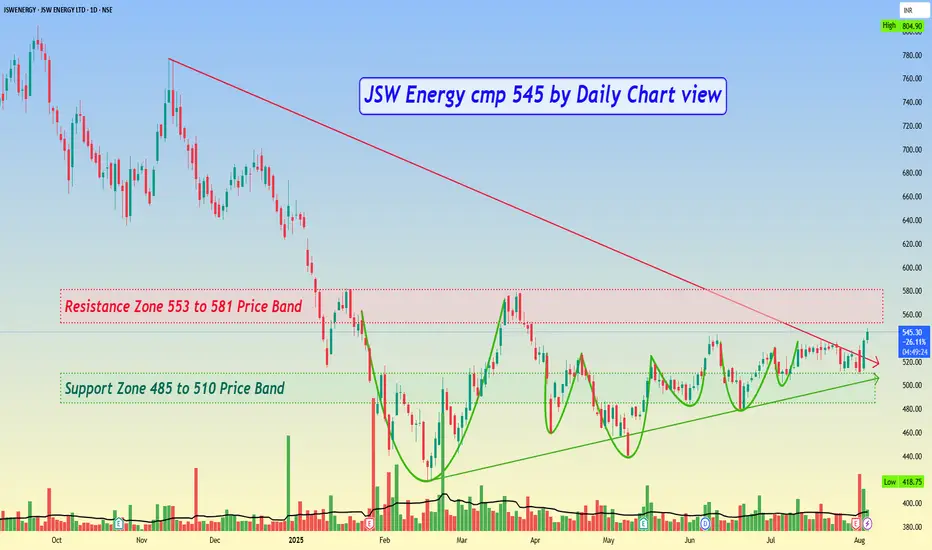
JSW Energy cmp 545 by Daily Chart viewJSW Energy cmp 545 by Daily Chart view
- Support Zone 485 to 510 Price Band
- Resistance Zone 553 to 581 Price Band
- Falling Resistance Trendline Breakout has well sustained
- Rising Support Trendline well respected by upwards Price Momentum
- Multiple Bullish Rounding Bottoms plus considerate VCP pattern too, as viewed individually
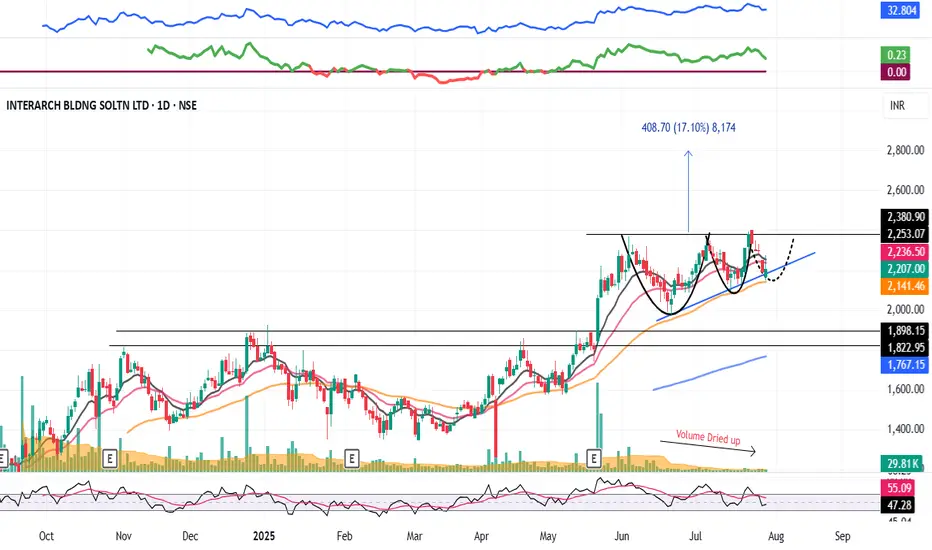
INTERARCH : Swing Pick (1-3 Months)#INTERARCH #vcppattern #chartpattern #ascendingtrianglepattern #breakoutstock #patterntrading #Swingtrading
INTERARCH : This will test Patience
>> VCP formation in process
>> Ascending Triangle forming
>> Breakout candidate
>> Good Strength & Volumes Dried up
>> Trending Stock in consolidation
Swing Traders can lock profits at 10% & Keep Trailing
Pls Comment , Boost and Follow for more such Analysis
Disc : Charts shared are for Learning Purpose and not a Trade recommendation, Consult your Financial advisor or a SEBI Registered Advisor before taking position in it.
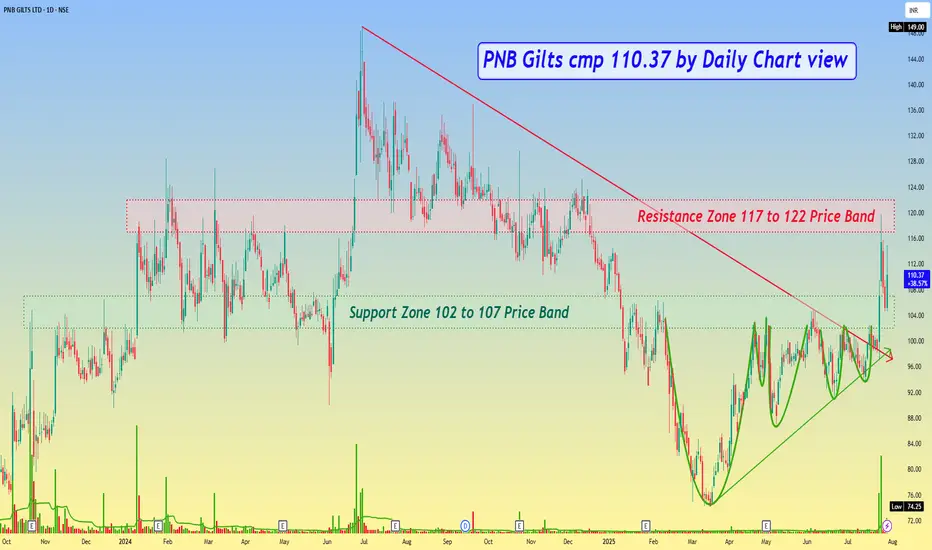
PNB Gilts cmp 110.37 by Daily Chart viewPNB Gilts cmp 110.37 by Daily Chart view
- Support Zone 102 to 107 Price Band
- Resistance Zone 117 to 122 Price Band
- Volumes are seen spiking heavily over past few days
- Support Zone is getting tested retested since last week
- Bullish Technical Chart indicates decent breakout probability
- Falling Resistance Trendline Breakout is seen to be well sustained
- Very closely considerate VCP pattern has formed below the Support Zone
- Majority Technical Indicators BB, EMA, SAR, MACD, RSI, SuperTrend trending positively
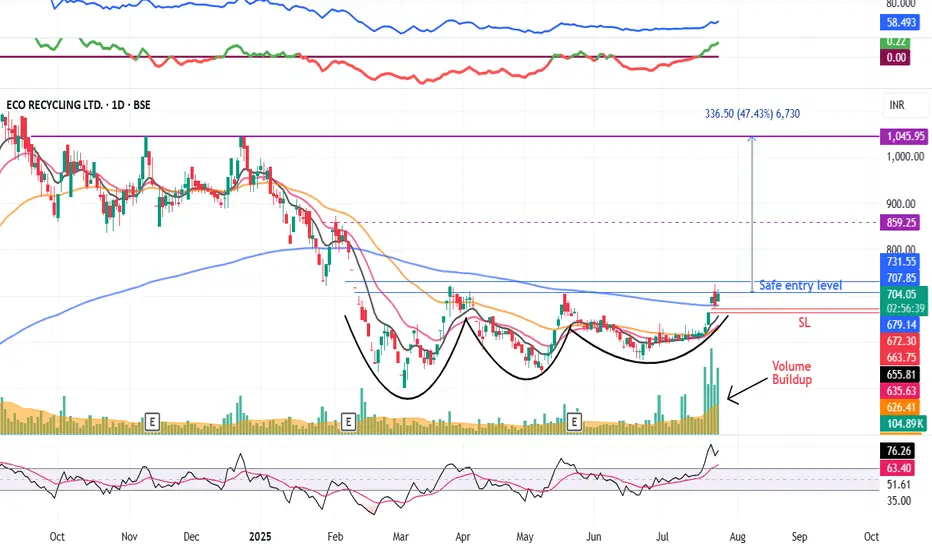
ECORECO - Swing Pick (1-3 Months)#ECORECO #vcppattern #basingpattern #swingtrade #patterntrading
ECORECO : Swing Trading
>> Good Base formation
>> VCP Pattern visible
>> Breakout candidate
>> Good Strength & Volume Buildup
>> Low Risk High Reward Trade
Swing Traders can lock profit at 10% and keep trailing.
Pls comment, Boost and follow us for more such Analysis
Disc : Charts shared are for Learning purpose and not a Trade recommendation. Consult ur financial advisor or a SEBI Registered Advisor before taking position in it.
HeranbaSwing Trade -
Look interesting at current level - still closing pending
If today close above break out level
Maybe we can see Good move upside.
Risk around 8-10% around
Target next resistance

Big Move Coming? Watch This Classic VCP Setup on Shriram FinanceHello everyone, i hope you all will be doing good in your trading and your life as well. Today i have brought a setup which name is VCP (Volatility Contraction Pattern) is one of the most powerful base setups, where the price contracts in multiple tight ranges, showing controlled strength. It signals that supply is drying up and the stock is getting ready for a strong move, usually a breakout. What makes it special is the combination of tightening price with lowering volume , and that's exactly what we can observe in Shriram Finance right now.
The stock has taken multiple supports from key EMAs like 9, 21, and 50 during this entire consolidation, a classic VCP sign. With each dip being bought quickly and bounce getting tighter, the stock is preparing for a potential breakout move.
Keep this one on radar , structure is clean, volume behavior is ideal, and if momentum comes, VCP patterns don’t disappoint.
For levels and risk-reward, please refer the chart above.
Disclaimer: This analysis is for educational purposes only. Please consult a financial advisor before making investment decisions.

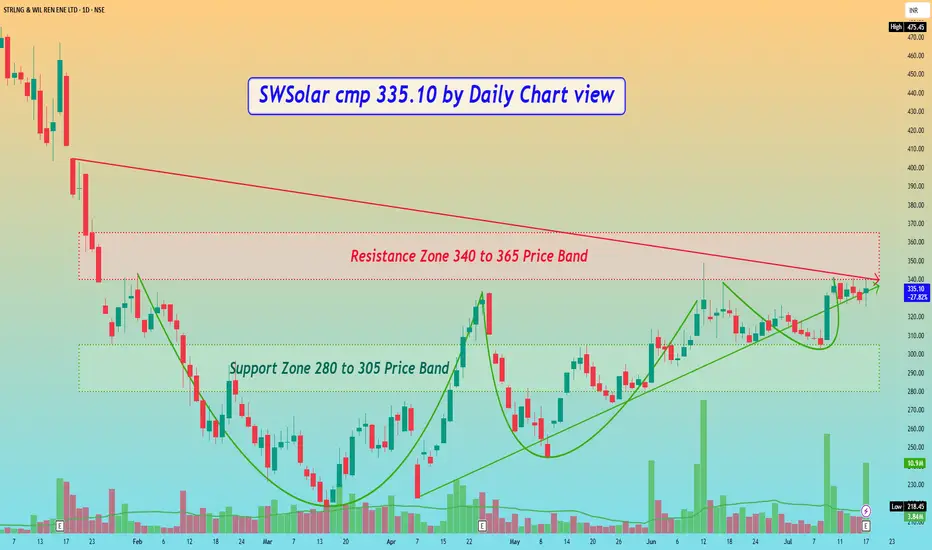
SWSolar Sterling & Wilson cmp 335.10 by Daily Chart viewSWSolar cmp 335.10 by Daily Chart view
- Support Zone 280 to 305 Price Band
- Resistance Zone 340 to 365 Price Band
- Bullish VCP Pattern completed on stock chart
- Volumes spiking heavily at regular intervals by demand based buying
- Resistance Zone Neckline Breakout maybe seen unfolding in the near future
SBIN – VCP Breakout📊 NSE:SBIN – VCP Breakout 🚀
Classic Volatility Contraction Pattern (VCP) in play:
1st contraction: -17.41%
2nd: -8.54%
3rd: -5.12%
Breakout above ₹822 with volume surge 🔥
Reduced volatility ➡️ Strong demand ➡️ Bullish breakout!
#SBIN #VCP #PriceAction #TechnicalAnalysis #StockMarketIndia

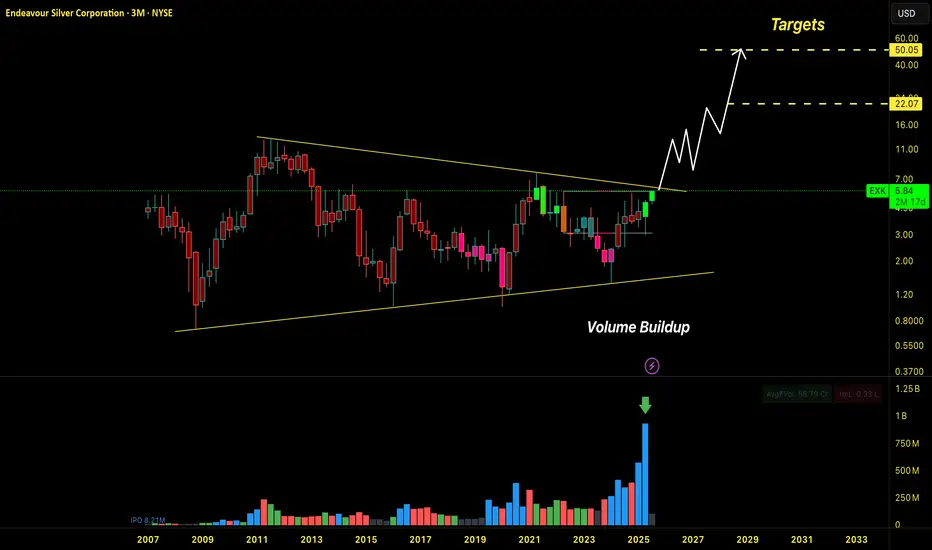
$EXK ready to explode and tear it's multi year resistance NYSE:EXK chart is special, this is a setup which has my high conviction.
Their Terronera project should be ready to ramp up this month, and it will also bring their costs AISC down, This will double their production to almost 15 million Aq. Eq ounces + Kolpa Project 5 million Ag eq., which they just acquired, will make them a 20 million Ag eq producer. As silver moves up their OPM% will keep inching up higher.
And the volume buildup is screaming a thumping buy.
MOTISONS : Breakout Stock#MOTISONS #swingtrade #vcppattern #breakout #trendingstock
MOTISONS : Swing Trade
>> Trending Stock
>> Breakout Candidate
>> VCP pattern
>> Good strength & Volume Buildup
>> Good Upside Potential
Swing Traders can lock profit at 10% and keep Trailing
Please Boost, comment and follow us for more Learnings.
Disc : Charts shared are for learning purpose only, not a Trade recommendation. Do your own research and consult your financial advisor before taking any position.

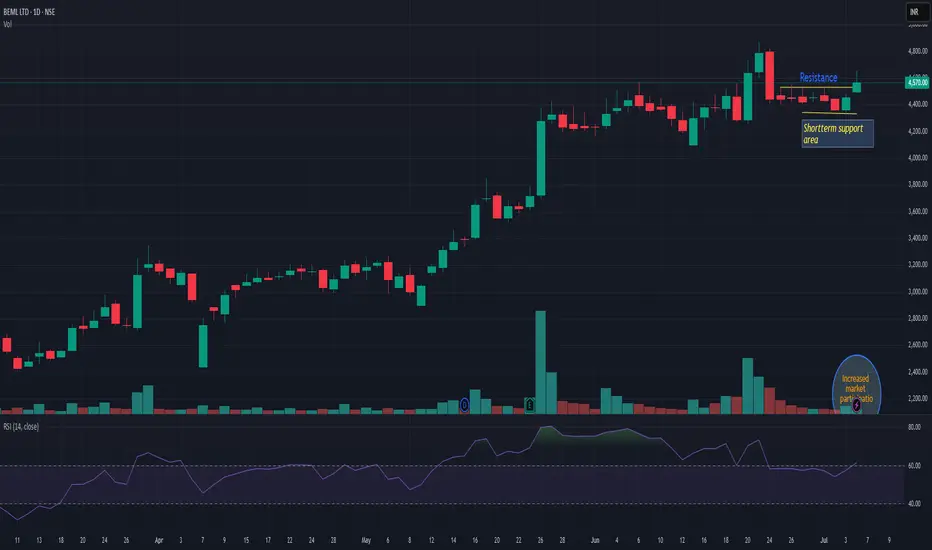
BEMLBEML is trading above resistance line with very decent volume. As long as it is trading above support line, momentum may continue. Recently fresh momentum has been observed on majority defense stock. If today it is closing above 4600 then we may see momentum for next 12-15%. Keep it on radar.
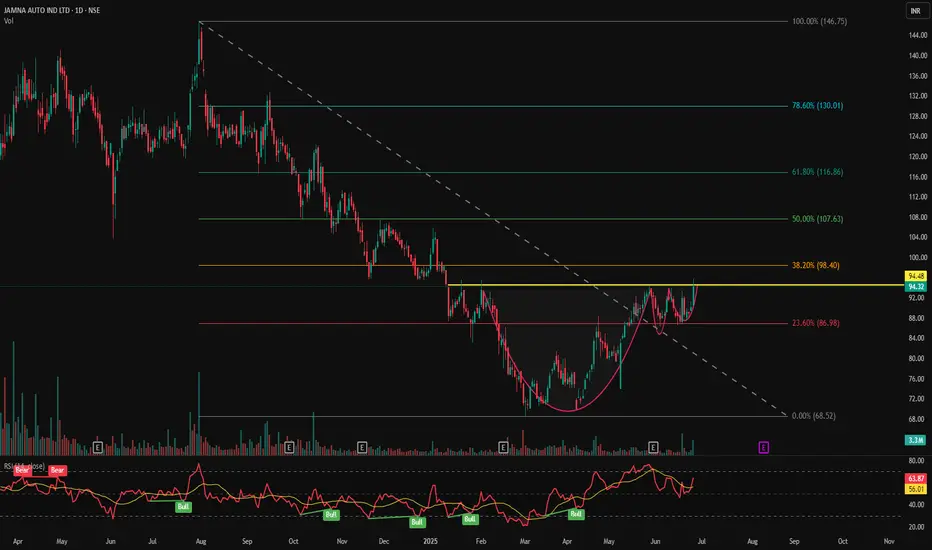
JAMNAAUTO - VCP Pattern Near Breakout📊 JAMNA AUTO (JAMNAAUTO) – VCP Pattern Near Breakout | RSI Momentum | Volume Surge | Daily Chart
📅 Chart Date: June 26, 2025
📈 CMP: ₹94.32 (+4.60%)
📍 Ticker: NSE:JAMNAAUTO
🔍 Technical Analysis Summary
☕ Cup & Handle Formation
The chart shows a well-formed Cup & Handle pattern
Neckline resistance at ₹94.48 – a break above this zone could trigger bullish continuation
Pattern suggests accumulation and breakout setup after prolonged downtrend reversal
📈 Volume
Rising volume on recent candles, supporting strength of potential breakout
Volume above 3.3M confirms strong buying interest
📊 RSI Indicator (14)
RSI currently at 63.87 and rising
Multiple historical RSI Bullish crossovers visible during base and handle formation
RSI > 60 indicates momentum is favoring bulls
📍 Key Price Levels
✅ Breakout Zone (Neckline): ₹94.48
🚀 Upside Targets (Post-breakout estimate):
₹102
₹110
₹120+
🛡️ Support Zones:
₹90 (immediate)
₹85 (handle base)
₹80 (cup base)
📌 Trade Setup Idea
Entry: On breakout above ₹94.50 with volume
SL: Below ₹89
Targets: ₹102 → ₹110 → ₹120+
Risk-Reward: Good, considering rounded base and handle plus RSI confirmation
⚠️ Disclaimer
This chart analysis is for educational purposes only. Always DYOR (Do Your Own Research) and consult a financial advisor before making investment decisions.
MAXHEALTH - 7 months consolidation VCP Breakout - ATHMAXHEALTH
1) 7 months consolidation - volatility contraction pattern breakout and Closed at it's All Time High. A potential up move is possible.
2) Pharma and Healthcare index looks solid to support Pharma stocks.

NOVAAGRINOVAAGRI giving classical VCP breakout. Recently given 2 times flag pattern breakout with high volume. And then again consolidation with dried volume. Today again formed a pole of flag with decent volume. Now as long as it is closing above resistance line which is around 51 then I think its good accumulation zone. Up side its open for large space! Track it closely.

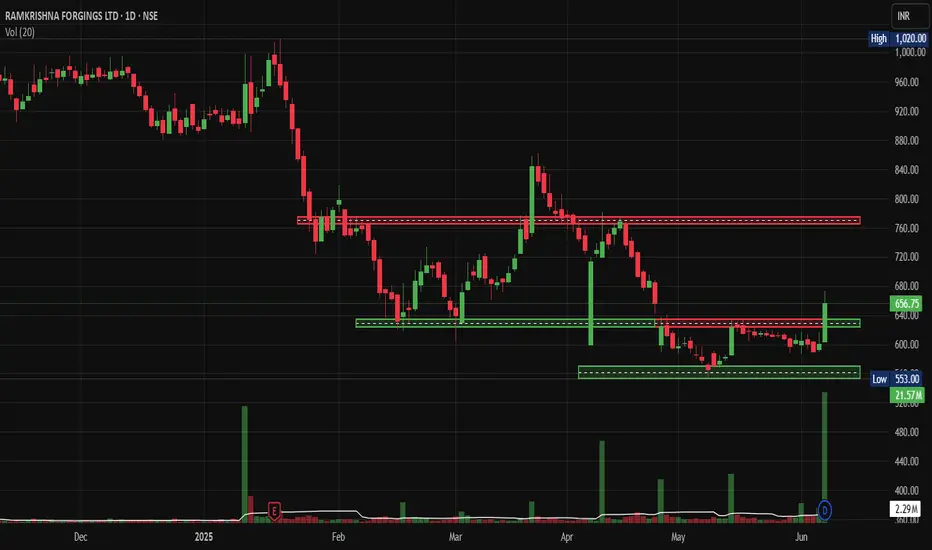
RKF Massive Breakout After 6-Month Consolidation.NSE:RKFORGE Hidden Auto Component Gem Ready for Massive Breakout After 6-Month Consolidation, after Breaking out Today With King Candle and Volumes.
Price Action:
- Current Price: ₹656.75 (+9.37% gain)
- Trading Range: ₹553.00 - ₹1,020.00
- Market Cap Category: Mid-cap stock with decent liquidity
- Chart Pattern: Extended consolidation phase with recent breakout attempt
Support and Resistance Levels
- Primary Resistance: ₹760-780 zone (red horizontal line)
- Secondary Resistance: ₹1,020 (previous high)
- Immediate Support: ₹620-640 zone
- Major Support: ₹553-580 zone (green horizontal rectangle)
- Critical Support: ₹553 (52-week low)
Base Formation:
- Base Type: Rectangle/Sideways consolidation base
- Duration: Approximately 6 months (January 2025 to June 2025)
- Base Depth: ~45% correction from highs
- Base Quality: Tight consolidation with reduced volatility
- Breakout Characteristics: Recent volume spike suggests potential base completion
Technical Patterns:
- Rectangle Pattern: Clear horizontal support and resistance boundaries
- Volume Accumulation: Declining volume during consolidation, spike on recent move
- Flag Formation: Potential bull flag pattern forming at current levels
- Double Bottom: Possible formation around ₹553-580 support zone
Volume Spread Analysis
- Volume Characteristics: 21.57M shares traded (above average)
- Volume Pattern: Higher volume on up days, lower on down days
- *Accumulation Signs: Volume spike coinciding with price breakout attempt
- Volume Confirmation: Recent breakout supported by increased participation
Trade Setup:
Entry Strategy:
- Primary Entry: ₹650-665 (current levels on pullback)
- Aggressive Entry: ₹680-690 (on breakout above resistance)
- Conservative Entry: ₹620-630 (on retest of support)
Exit Levels:
- Target 1: ₹750-760 (15% upside)
- Target 2: ₹850-880 (30% upside)
- Target 3: ₹980-1,000 (50% upside)
Stop Loss Levels:
- Tight Stop: ₹620 (5% risk)
- Swing Stop: ₹580 (12% risk)
- Position Stop: ₹550 (16% risk)
Position Sizing:
- Conservative Allocation: 2-3% of portfolio
- Moderate Allocation: 4-5% of portfolio
- Aggressive Allocation: 6-8% of portfolio (for risk-tolerant investors)
Risk Management:
- Risk-Reward Ratio: Minimum 1:2 for all entries
- Portfolio Risk: Maximum 2% portfolio risk per position
- Position Monitoring: Weekly review of technical levels
- Profit Booking: 25% at Target 1, 50% at Target 2, remainder at Target 3
Sectoral Backdrop:
Auto Components Sector Overview
- Sector Performance: Recovery phase post-COVID disruptions
- Growth Drivers: EV transition, export opportunities, aftermarket demand
- Challenges: Raw material inflation, supply chain disruptions
- Government Support: PLI schemes, Make in India initiatives
Forging Industry Dynamics
- Market Position: Specialised manufacturing with high entry barriers
- Demand Drivers: Commercial vehicle recovery, export growth
- Competitive Advantage: Technical expertise, established client relationships
- Cyclical Nature: Linked to auto industry cycles and capex spending
Fundamental Backdrop
Company Overview
- Business Model: Automotive forging components manufacturer
- Key Clients: Major OEMs in domestic and international markets
- Product Portfolio: Crankshafts, connecting rods, front axle beams
- Manufacturing Facilities: Multiple locations with modern equipment
Financial Health Indicators
- Revenue Growth: Recovery trajectory expected post-consolidation
- Margin Profile: Improving operational efficiency
- Debt Levels: Manageable debt-to-equity ratios
- Cash Flow: Positive operating cash flow generation
Growth Catalysts
- Export Expansion: Increasing share in global supply chains
- Product Diversification: Entry into new automotive segments
- Technology Upgrades: Investment in advanced manufacturing
- Market Recovery: Commercial vehicle segment revival
Risk Factors
- Cyclical Demand: Vulnerability to auto industry downturns
- Raw Material Costs: Steel price volatility impact
- Competition: Pressure from low-cost manufacturers
- Regulatory Changes: Environmental and safety compliance costs
My Take:
NSE:RKFORGE presents a compelling technical setup after a prolonged consolidation phase. The stock appears to be breaking out from a well-defined base with strong volume support. The risk-reward profile is attractive for medium-term investors, with clear support and resistance levels providing good trade management opportunities. However, investors should remain mindful of the cyclical nature of the auto components sector and size positions accordingly.
Keep in the Watchlist.
NO RECO. For Buy/Sell.
📌Thank you for exploring my idea! I hope you found it valuable.
🙏FOLLOW for more
👍BOOST if you found it useful.
✍️COMMENT below with your views.
Meanwhile, check out my other stock ideas on the right side until this trade is activated. I would love your feedback.
Disclaimer: "I am not a SEBI REGISTERED RESEARCH ANALYST AND INVESTMENT ADVISER."
This analysis is intended solely for informational and educational purposes and should not be interpreted as financial advice. It is advisable to consult a qualified financial advisor or conduct thorough research before making investment decisions.
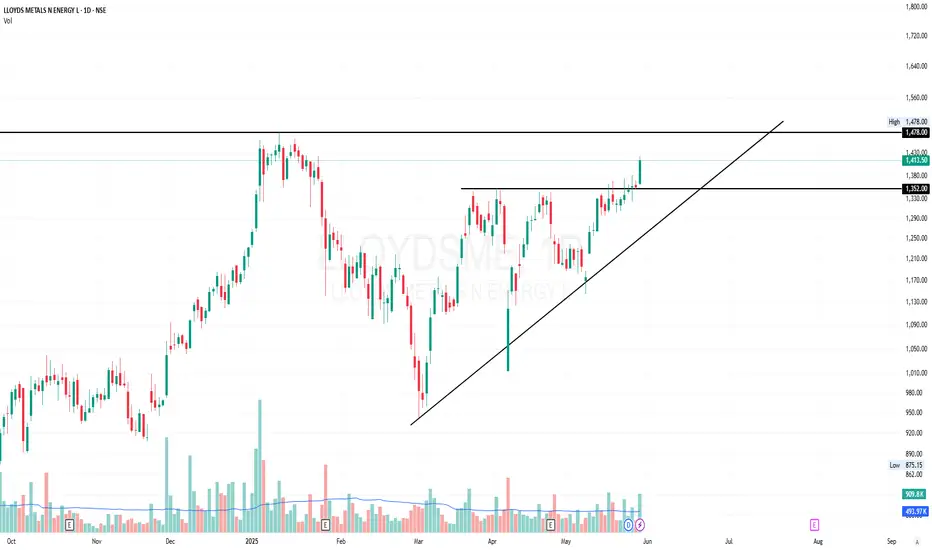
LLOYDSME - VCP BreakoutLLOYDSME
1) Time Frame - Daily.
2) A Volatility Contraction Pattern Breakout after a good consolidation.
3) The stock may find it's next resistance at the price 1478 (All Time High) & Move further if the momentum kicks in.