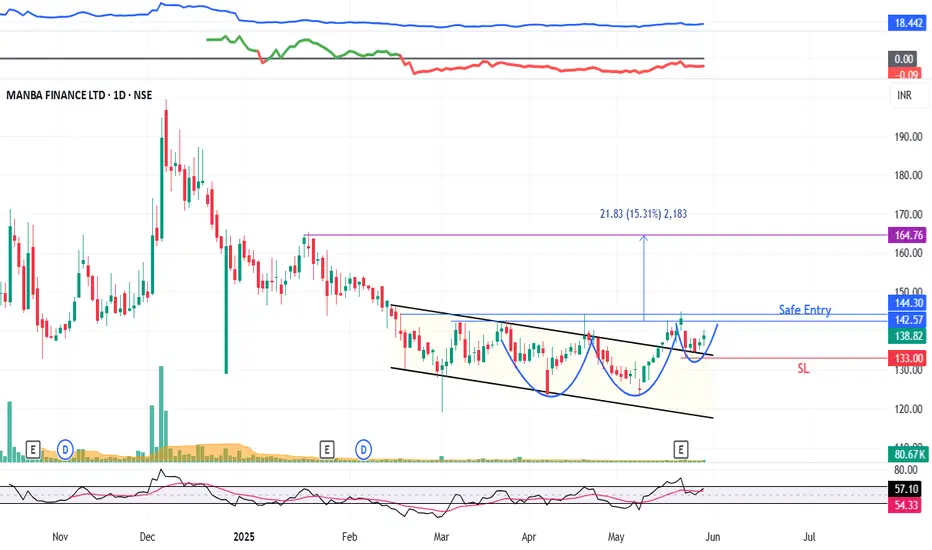
MANBA : Momentum stock (swing pick)#MANBA #breakoutstock #vcppattern #parallelchannelbreakout #momentumstock
MANBA : Swing Trade
>> Parallel Channel Breakout
>> VCP pattern formation
>> Trending Stock
>> Breakout Candidate
>> Good Strength & Volumes Dried up
Swing Traders can lock profit at 10% & keep trailing.
Disclaimer : Stock Charts shared are for Learning Purpose and not a Trade recommendation. Consult a SEBI Registered Advisor before taking position in it.
Even Technical Analysis is not 100%, so I reserve the Right to be wrong.
Vcppattern
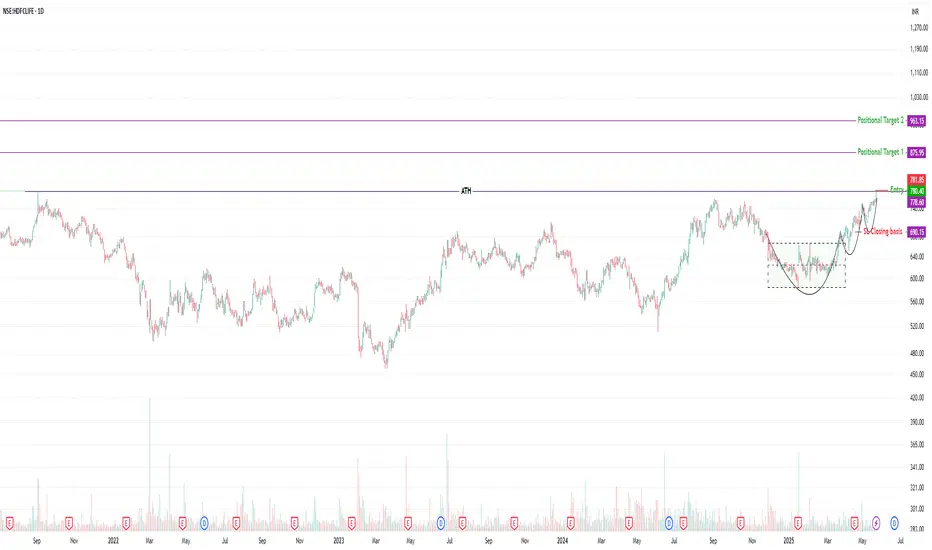
HDFC LIFE – VCP Breakout Setup | ATH ZoneHDFC LIFE – VCP Breakout Attempt | ATH Test After 44 Months
📈 Structure: Volatility Contraction Pattern (VCP)
📦 Base: Tight consolidation zone (rectangle)
📊 Trend: Higher Highs & Higher Lows
🟢 Volume: Gradually picking up
💥 Last Session: Wide range bullish candle
🔝 ATH Zone: Testing Sep 2021 high (44-month range)
📌 Price Action: Trading above Key DMAs
The stock formed a clean VCP structure with tight contractions and shallow pullbacks. It broke out from its recent base and is now testing the all-time high from Sep 2021, making this a high-stakes breakout watch.
Currently, it’s forming a breakout setup with entry above the previous day’s close — ideally confirming with more volume above ₹790.
📍 Trade Plan
Entry: 781.85
Stop Loss (Close Basis): 690.15
Target 1: 875.95
Target 2: 963.15
📊 Risk & Reward
Risk: 11.75%
Target 1: 12.02%
Target 2: 23.18%
RR to T1: 1 : 1.02
RR to T2: 1 : 1.97
⚠️ Risk Management Notes
Even though the structure is clean and momentum is building, risk remains high as the stock is trading at ATH levels — a zone where volatility can spike.
Always remember:
Protect capital first — never let a single trade ruin your portfolio
If it fails to hold above the breakout zone, pullbacks can be sharp
Don’t ignore market breadth and macro sentiment
Trade only with proper position sizing and SL discipline. If the breakout sustains with strength, this could enter a strong trend — but risk-reward must justify the trade.
📌 This is not a buy/sell recommendation. Just a technical view for educational purposes.
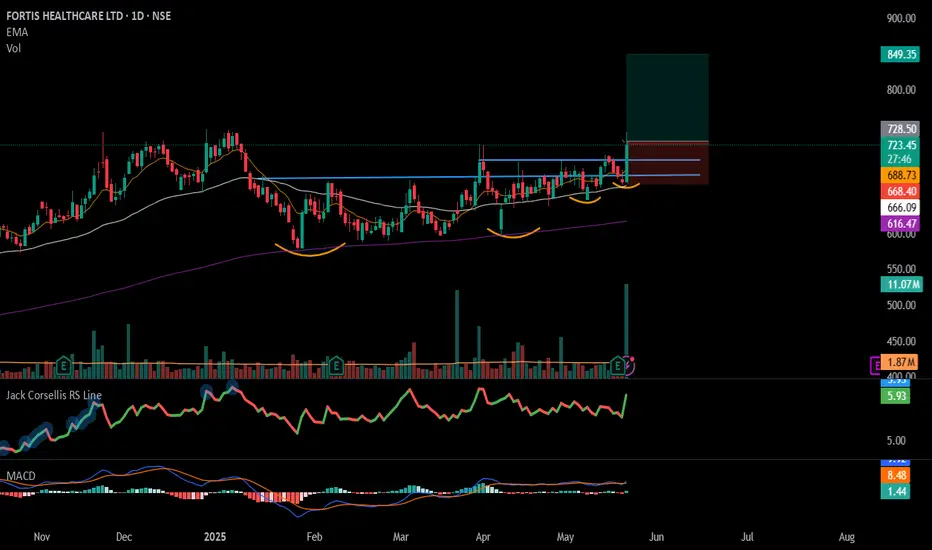
#FORTIS - VCP BreakOut in Daily Time Frame📊 Script: FORTIS
Key highlights: 💡⚡
📈 VCP BreakOut in Daily Time Frame.
📈 Price consolidated near Resistance.
📈 Volume spike seen
📈 MACD Crossover
📈 Can go for a swing trade
BUY ONLY ABOVE 728 DCB
⏱️ C.M.P 📑💰- 722
🟢 Target 🎯🏆 – 16%
⚠️ Stoploss ☠️🚫 – 8%
️⚠️ Important: Market conditions are Okish, Position size 50% per Trade. Protect Capital Always
⚠️ Important: Always Exit the trade before any Event.
⚠️ Important: Always maintain your Risk:Reward Ratio as 1:2, with this RR, you only need a 33% win rate to Breakeven.
✅Like and follow to never miss a new idea!✅
Disclaimer: I am not SEBI Registered Advisor. My posts are purely for training and educational purposes.
Eat🍜 Sleep😴 TradingView📈 Repeat 🔁
Happy learning with MMT. Cheers!🥂
HFCL, long, short termHFCL looks good for taking long position from here @84.7, base breakout with volume. A short term trade with stop of 81 can be taken

SARDAEN - Breakout WatchlistWhy This Stock?
✅ Base Breakout – Breaking above ₹526.2 with strong volume confirmation (4-5x past trading sessions).
✅ Trading Above Key DMAs – Strong price structure with good RSI.
✅ No Left-Side Resistance – Clean chart structure with potential for an uptrend.
✅ Formation of W Pattern + VCP – Classic bullish continuation setup.
✅ Resisted Market Fall – Showcasing relative strength despite overall weakness.
Safe traders wait for a weekly close above the break-out level ₹526.2.
Key Levels
📌 Entry: ₹538.50
📌 SL (Closing Basis): ₹423.10
📌 Breakout Level: ₹526.2
Fundamentals (Key Metrics)
Market Cap: ₹18,979 Cr.
Stock P/E: 27.9
ROCE: 15.3%
ROE: 14.1%
Sales Growth (YoY): Improving
OPM % YoY Improving
EPS YoY: Improving.
What Could Go Wrong?
⚠️ Overall Market Trend is Bearish – Any weakness in broader indices can drag the stock down.
⚠️ Sectoral Index is Weak – Lack of sectoral strength may limit upside potential.
⚠️ High SL Probability – Strong pullbacks can invalidate the breakout; hence, buy test quantities only.
⚠️ Deep SL
Why This is Worth Watching?
📈 Stocks that Fell Less in Correction – Often become early movers when the market stabilizes.
📈 Volume Picking Up – A good sign that institutional interest might be present.
🚨 Disclaimer: This is not a trade recommendation but a watchlist alert. Do your own research before making any trading decisions. 🚨

Shriram Finance – Potential Breakout or False Alarm?
Technical Overview 📈
✅ Uptrend intact – The stock has been taking support at a long-term trendline and briefly fell out during the correction. Now, it has reclaimed the trendline.
✅ Breakout from a Cup & Handle pattern – A bullish pattern indicating possible upside.
✅ Volume picking up – Still needs more confirmation for strength.
✅ Golden Crossover possible – If recent lows hold, further upside can trigger a 50 & 200 DMA crossover.
✅ Sector strength – The finance sector index is trading above key DMAs, showing resilience.
Fundamental Snapshot 💰
Revenue Growth: 📈 Increasing YoY
EPS Growth: 📈 Improving
Profit Growth: 🚀 23.4% CAGR over the last 5 years
Healthy Dividend Payout: 21.6%
Market Cap: ₹1,26,653 Cr
Stock P/E: 15.6
Book Value: ₹279
Dividend Yield: 1.34%
ROCE: 11.3% | ROE: 15.9%
Face Value: ₹2
⚠️ Risk Factors:
Low Interest Coverage Ratio
Market Volatility – Could still be forming Lower Highs - Lower Lows (LL-LH) structure.
Volume Needs to Improve for stronger confirmation.
(Source: Screener.in)
Risk-Reward Calculation 🎯
1️⃣ Early Entry (₹695.1)
Stop Loss (SL): ₹607 (-12.65%)
Target: ₹890.8 (+28.12%)
Risk-to-Reward (R:R) = 1:2.22 ✅
2️⃣ Safe Entry (₹732.35)
Stop Loss (SL): ₹607 (-17.08%)
Target: ₹890.8 (+21.7%)
Risk-to-Reward (R:R) = 1:1.27 ✅
💡 Conclusion:
Early Entry (1:2.22) offers a better reward potential but has a higher risk of pullback.
Safe Entry (1:1.27) is more conservative but offers a lower reward.
Conclusion & Trading Plan 🎯
🔹 No need to rush in! Gradual accumulation is a wiser approach at this stage.
🔹 Risk Management is Key! This could be a false breakout or a pullback trap. Wait for confirmation.
🔹 Volume confirmation is essential – Without strong volume, the move might fail.
📢 Educational Idea | Not a Trade Recommendation 📢
This setup is shared to alert traders of a potential winner once the market settles. Not all setups play out, and only 5-6 out of 10 might succeed. Hence, risk management and position sizing are key. 📉📊
📢 Disclaimer: This post is for educational purposes only. It is NOT financial advice. All trades carry risk, and market conditions can change. Do your own research and manage risk accordingly.

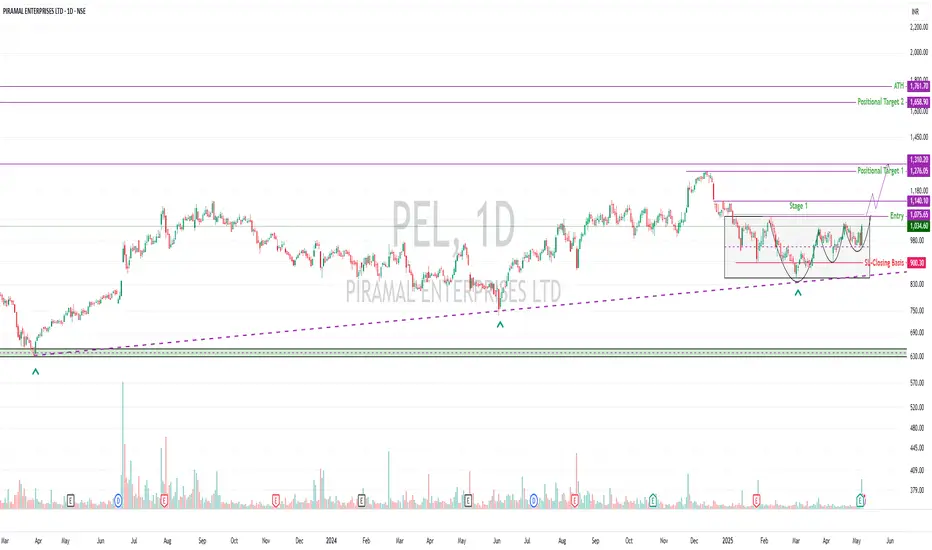
Piramal Enterprises| VCP traits | Breakout on volume📈 PEL | Piramal Enterprises Ltd
Multi-month base | VCP traits | Breakout on volume watch
🔍 Technical Highlights:
Volume spurt: 5x relative to recent sessions – clear institutional interest 🧠
Bullish engulfing candle on 7 May 2025, signaling a strong reversal attempt
Closed above 200 DMA, trading above 50 DMA, and just above 30 WMA – early signs of trend re-alignment
Price is forming a VCP-like structure within a Stage 1 base
Breakout is aligning with a Higher High–Higher Low (HH–HL) structure
Took support at a rising trendline that’s been respected since April 2023
⚠️ Key Risk Considerations:
Fundamentals are weak – poor ROE & ROCE, and RSI is unimpressive
Broader market is not supportive — Nifty 500 is still below 200 DMA
This may be an early breakout attempt — confirmation is everything
No clean follow-up yet post breakout day – wait for continuation
🧭 Why Watch This?
Despite fundamental weaknesses, technicals are improving rapidly:
Volume is stepping up
Price is testing long-term moving averages
Structure is getting tighter (VCP traits visible)
A clean breakout and follow-through above ₹1,075–₹1,140 could unlock Stage 2 potential
🎯 Trade Levels:
Entry: Above ₹1,075.6 (confirmation required)
SL (Closing Basis): ₹895.2
Positional Target 1: ₹1,276
Positional Target 2: ₹1,658
ATH Review Zone: ₹1,761
💰 Risk–Reward
Risk = ₹1,075.6 – ₹895.2 = ₹180.4
Reward to T1 = ₹1,276 – ₹1,075.6 = ₹200.4 → R:R = 1 : 1.11
Reward to T2 = ₹1,658 – ₹1,075.6 = ₹582.4 → R:R = 1 : 3.23
🛡️ Trader's Note
Position sizing is not optional — it's your only protection.
This is a setup driven by volume, structure, and levels — not by fundamentals.
If this breakout holds, momentum traders may pile in — but don’t front-run it blindly.
📌 Quarterly results are around the corner — trade with caution as earnings volatility can invalidate technicals.
📌 If price reaches ATH, review for new risk-reward alignment and partial booking.
📜 Disclaimer: This is a technical perspective, not investment advice. For educational purposes only. Trade safe, trade smart.
PLong
ICICI Bank-Aiming for Double Bottom Breakout?ICICI Bank – Technical Analysis & Trade Plan
📈 Trend Analysis:
Stock is in a strong uptrend with a higher high, higher low (HH-HL) structure intact.
Consolidating since September 2024, forming a base.
Double bottom formation visible, with a potential VCP (Volatility Contraction Pattern) at play.
Trading above key DMAs, confirming strength.
Sectoral strength: Finance & banking showing momentum and could lead the next market move.
📊 Market Context:
Broader market is showing slight improvement but still in a lower low, lower high (LL-LH) structure.
Index closed above 50 DMA, gaining some momentum, but another round of correction cannot be ruled out.
The main reason for selecting this stock is strong sector movement.
🔍 Trade Plan:
✅ Entry: Above ₹1,328
🚨 Immediate Resistance: ₹1,363
📌 Add more: If ₹1,363 is broken with strong volume
🎯 Positional Target: ₹1,555
❌ Stop Loss (SL - Closing Basis): ₹1,180.45
📉 Risk & Reward Calculation:
Risk (SL to Entry): ₹1,328 - ₹1,180.45 = ₹147.55 (~ 11.11% downside risk)
Reward (Entry to Target): ₹1,555 - ₹1,328 = ₹227 (~ 17.1% upside reward)
Risk-to-Reward Ratio (R:R): 1:1.54 (Moderate reward vs. risk)
⚠️ Risk Considerations:
Overall market still in LL-LH structure → Could just be a pullback within a broader downtrend.
Position Sizing Key:
Consider entering only 30% of the usual position size.
Gradual accumulation near ATH (All-Time High) levels is a wise approach.
📢 Disclaimer: This is not financial advice. Trading involves risk, and past performance does not guarantee future results. Always do your own research and use proper risk management .

Mazagon Dock| VCP & Double Bottom – Watch for a Breakout!Mazagon Dock ⚓ | VCP & Double Bottom – Watch for a Breakout! 🚀
Mazagon Dock (MAZDOCK) is forming a Volatility Contraction Pattern (VCP) + Double Bottom on the weekly chart. A potential breakout is in play.
📌 Entry: Above 2671 (preferably on a daily close).
📌 Immediate Resistance: 2966 (All-Time High). Watch price action at this level. A strong breakout with volume could signal further upside.
📌 Stop-Loss: 2201 (Daily close). ⚠️ SL is deep (~17.6%), so position sizing is critical.
Trading Strategy & Risk Management 🛡️
🔹Breakout Entry: Small position above 2671 with a tight SL for safety.
🔹Retest Strategy: If a breakout occurs, watch for a retest of 2671 as support.
🔹Volume Confirmation: A strong breakout with volume can signal continuation.
🔹Risk Factor: Already up 1600%+ from lower levels, so profit booking pressure is expected.
🔹 The Broader Market is not in a safe territory yet – gradual accumulation is advised.
🔹 Wait for a clean breakout → Start with a small position.
🔹 Market conditions matter – If the market weakens, even strong setups can fail.
Stock Behavior & Market Context 📈
Mazagon Dock has a history of breakout-consolidation-breakout moves. It has already surged 1600%+, making risk management essential. Many investors are sitting on heavy profits, so expect volatility.
🚢 Defense & Shipbuilding Outlook:
India is heavily investing in defense manufacturing, with Make in India boosting the sector. The naval expansion plans and growing demand for warships & submarines could provide strong tailwinds for MAZDOCK in the long run. Government contracts & global interest could further fuel its growth.
Final Thoughts
2025 is shaping up to be a year where risk management will be key. Early entries help reduce risk, but sticking to the stop-loss is non-negotiable. Keep this on your radar and trade light!
This setup has high potential but requires discipline. Position sizing and SL adherence are key due to the deep stop loss. If the market remains bullish, MAZDOCK could see a multi-month breakout.
🔥 Will history repeat? Can MAZDOCK deliver another breakout rally? Let’s see!

TATACONSUM – Cup & Handle Breakout | VCP Formation🔍 Technical Overview:
The stock has broken out of a classic Cup & Handle pattern.
Early bird entry was around ₹1143.45.
Currently trading near the 1-year ATH resistance at ₹1253.85.
A Volume Contraction Pattern (VCP) might be playing out, with visible contractions and tight price action in the handle.
Strong volume spikes seen during recent upmoves—indicating institutional interest.
📊 Price Levels:
📍 Entry Zone: ₹1143.45 – CMP
📍 Resistance to watch: ₹1253.85 – Breakout above this with volume can propel the stock higher.
📉 Stop Loss: ₹993.50 (on closing basis)
✅ Trading well above key DMAs (50, 100, and 200)
🌐 Market Context:
While Nifty is holding above its 50 & 200 DMA, the Nifty 500 index is still below the 200 DMA, indicating broader market caution.
Expect volatility and shakeouts in the near term.
Market breadth is improving but risk management remains crucial.
⚠️ Risk Note: The current setup is promising, but given the broader market's fragile structure, strict SL adherence and position sizing is key.

How to Find High-Performing SectorsIn this video, I’ll show you how to identify strong-performing stocks in a sectors before they take off — using breakout setups .
You’ll learn: ✅ How to scan sectors for strength using simple visual cues
✅ How to apply the breakout to sector-level charts
✅ Real examples of sector breakouts and what to watch next
✅ How to align your trades with sector momentum for better results
If you're serious about trading breakouts with an edge, mastering sector selection is a game-changer.
📈 Don’t forget to like, boost, comment, and subscribe for more practical trading content!

Identifying Winning Sectors Before the Big MoveIn this video, we dive deep into how to identify winning sectors before they make their big moves—with a real-world case study on the EMS (Electronic Manufacturing Services) sector.
You'll learn:
How to spot early signs of sector strength using price action and volume.
Why the EMS sector is showing promising signs based on recent market behavior.
Whether you're a swing trader, positional investor, or just looking to sharpen your edge—this video will equip you with actionable insights to stay ahead of the curve.
⚠️ Important: Market conditions are getting better, Position size 20% per Trade. Protect Capital Always
⚠️ Important: Always Exit the trade before any Event.
⚠️ Important: Always maintain your Risk:Reward Ratio as 1:2, with this RR, you only need a 33% win rate to Breakeven.
✅Like and follow to never miss a new idea!✅
Disclaimer: I am not SEBI Registered Advisor. My posts are purely for training and educational purposes.
Eat🍜 Sleep😴 TradingView📈 Repeat 🔁
Happy learning with MMT. Cheers!🥂

#AVANTIFEED - Multi Year Breakout Candidate📊 Script: AVANTIFEED
Key highlights: 💡⚡
📈Multi Year Breakout
📈 VCP in Weekly Time Frame
📈 BO with Volume in Daily Time Frame
📈 MACD gave a Bounce
📈 Price consolidated for 6 Years
📈 One can go for Swing Trade
⚠️ Over All Market condition is bad, Practice paper trading
🟢 If you have any questions regarding the setup, please feel free to leave your inquiries in the comments, and I will respond promptly.
BUY ONLY ABOVE 800 DCB
⏱️ C.M.P 📑💰- 786
🟢 Target 🎯🏆 – 30%
⚠️ Stoploss ☠️🚫 – 15%
⚠️ Important: Always Exit the trade before any Event.
⚠️ Important: Always maintain your Risk & Reward Ratio.
✅#Boost, #Like & #Follow to never miss a new idea! ✅
Disclaimer: I am not SEBI Registered Advisor. My posts are purely for training and educational purposes.
Eat🍜 Sleep😴 TradingView📈 Repeat 🔁
Happy learning with MMT. Cheers!🥂

#KSCL - VCP BO in DTF📊 Script: KSCL
Key highlights: 💡⚡
📈 VCP in DTF
📈 BO with Volume
📈 MACD gave a Bounce
📈 Price consolidated for 140Days
📈 One can go for Swing Trade
⚠️ Over All Market condition is bad, Practice paper trading
🟢 If you have any questions regarding the setup, please feel free to leave your inquiries in the comments, and I will respond promptly.
BUY ONLY ABOVE 1036 DCB
⏱️ C.M.P 📑💰- 1036
🟢 Target 🎯🏆 – 16%
⚠️ Stoploss ☠️🚫 - 8%
⚠️ Important: Always Exit the trade before any Event.
⚠️ Important: Always maintain your Risk & Reward Ratio.
✅#Boost, #Like & #Follow to never miss a new idea! ✅
Disclaimer: I am not SEBI Registered Advisor. My posts are purely for training and educational purposes.
Eat🍜 Sleep😴 TradingView📈 Repeat 🔁
Happy learning with MMT. Cheers!🥂

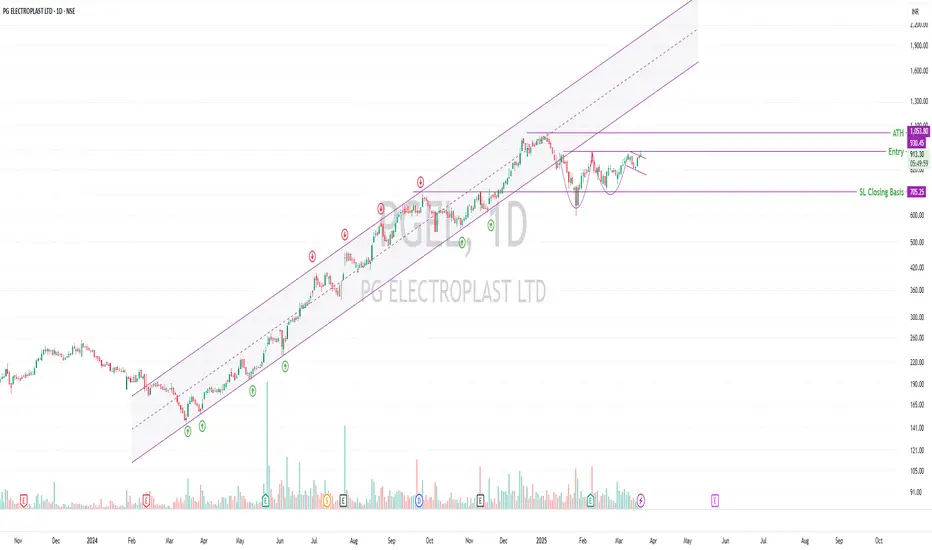
PG ELECTROPLAST LTD (NSE: PGEL):Double Bottom & CNH📈 PG ELECTROPLAST LTD (NSE: PGEL) – Trade Setup & Analysis
🔹 Trend: Stock is in an uptrend, previously a cycle winner. Corrected significantly in the recent market fall but is now recovering and trading close to ATH.
🔹 Technical Highlights:
Trading above key DMAs ✅
Double bottom, VCP, and CNH formation (not textbook-perfect but forming)
Volume missing but RSI improving 📈
Price action near ATH to watch – a high-volume breakout could signal a strong move.
🔹 Key Levels:
Entry: ₹925.70
SL (Closing Basis): ₹705.25 🛑
ATH Resistance: ₹1,053.80
🔹 Market Structure:
LL-LH trend in the broader market, so caution advised ⚠️
Gradual accumulation suggested, wait for confirmation on breakout with volume.
Breakouts are prone to failure in weak markets – risk management is key.
🔹 Fundamentals:
Market Cap: ₹26,226 Cr
Stock P/E: 124 (High Valuation ⚠️)
Book Value: ₹40.5
Dividend Yield: 0.02%
ROCE: 18.7% | ROE: 18.9% ✅
Sales Improving YoY but OPM% needs improvement
EPS Improving, Profits Rising ✅
📌 Final Thoughts:
Monitor price action near ATH – strong volume breakout = potential buy.
Weak market structure means all setups carry a higher failure risk.
Company fundamentals are decent, but valuations are stretched.
🔍 Do your own research before committing capital. This is a potential mover but needs confirmation!
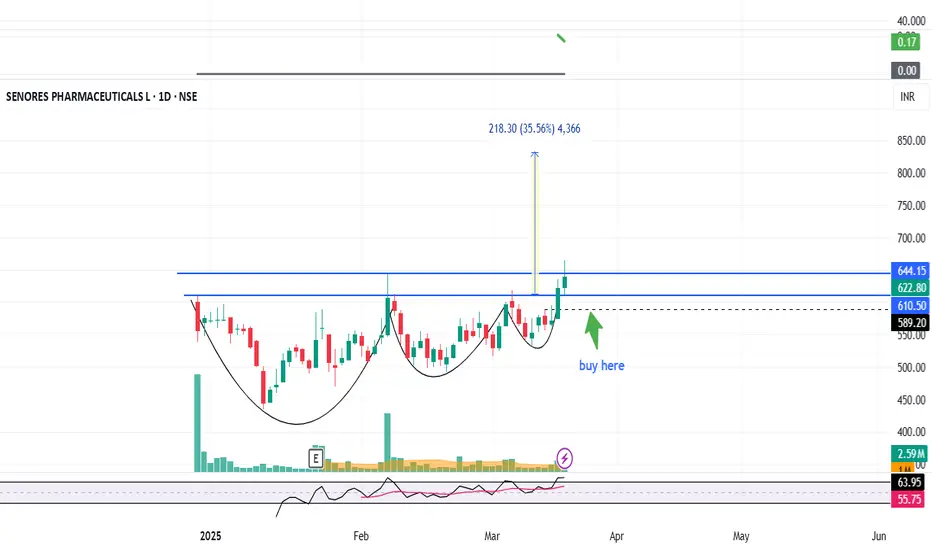
SENORES : Breakout Candidate#SENORES #breakoutsoon #swingtrade #vcppattern #vcpbreakout
SENORES : Swing Trade / Momentum trade
>> wait for Retracement till black line
>> Volumes and Strength Building up
>> Beautiful VCP pattern
>> Low Risk High Reward Trade
Swing Traders can lock profit at 10% and keep Trailing
Please Boost, comment and follow us for more Learnings.
Note : Markets are still Tricky and can go either ways so don't be over aggressive while choosing & planning your Trades, Calculate your Position sizing as per the Risk Reward you see and most importantly don't go all in
Disc : Charts shared are for learning purpose only, not a Trade recommendation. Do your own research and consult your financial advisor before taking any position.
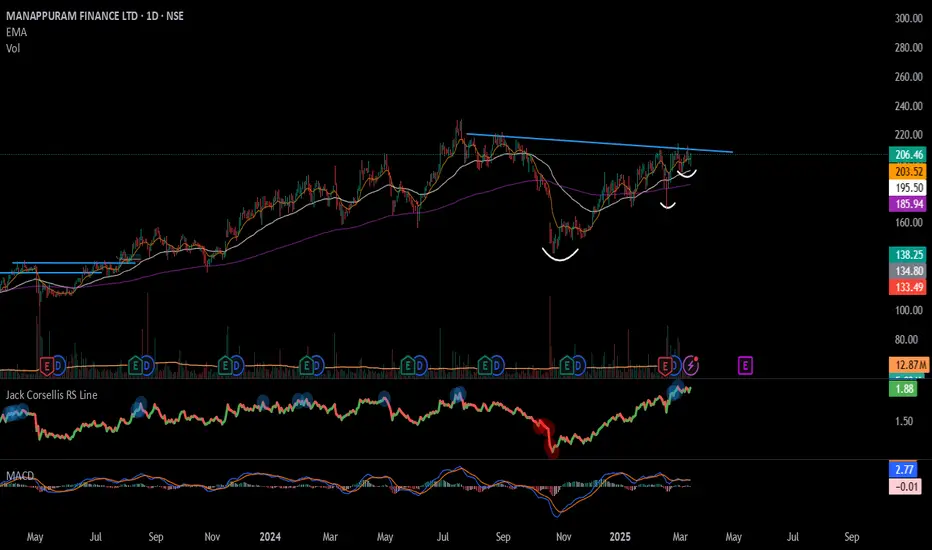
#MANAPPURAM - Potential BO / Keep in Radar/ March25📊 Script: MANAPPURAM
Key highlights: 💡⚡
📈 VCP formation in Daily chart.
📈 Price gave a good up move and went into consolidation.
📈 Wait for Volume spike on Breakout.
📈 Wait for BO with Volume
📈 One can go for Swing Trade.
BUY ONLY ABOVE 215 DCB
⏱️ C.M.P 📑💰- 206
🟢 Target 🎯🏆 – NA%
⚠️ Stoploss ☠️🚫 – NA%
️⚠️ Important: Market conditions are not great, Paper Trade Only. Protect Capital Always
⚠️ Important: Always Exit the trade before any Event.
⚠️ Important: Always maintain your Risk & Reward Ratio.
✅Like and follow to never miss a new idea!✅
Disclaimer: I am not SEBI Registered Advisor. My posts are purely for training and educational purposes.
Eat🍜 Sleep😴 TradingView📈 Repeat 🔁
Happy learning with MMT. Cheers!🥂
Pearl Global Industries Ltd – Stock Worth Watching!🔹 Why is it Interesting?
✅ Uptrend Intact – Stock continues to move higher.
✅ Higher Highs & Higher Lows (HH-HL) Structure – Bullish price action remains strong.
✅ Respecting Trend Channel – Trading within an ascending channel, bouncing off key levels.
✅ Above Key Moving Averages (DMAs) – Staying strong above critical supports.
✅ Bullish Patterns Forming –
📍 Triple Bottom – A strong base for a potential breakout.
📍 VCP (Volatility Contraction Pattern) & Cup & Handle – Classic bullish setups on the daily timeframe.
🎯 Trading Plan
🔹 Entry: Small test position above ₹1500 on a daily close.
🔹 Safer Entry: Wait for a weekly close above ₹1500 for confirmation.
🔹 Stop-Loss (SL): ₹1162 (closing basis)
🔹 Risk per Trade: ₹1500 - ₹1162 = ₹338 (~22.53%)
🔹 Key Condition: Volume should improve—wait for a clean breakout.
📊 Key Fundamentals
💰 Market Cap: ₹6,842 Cr
📈 Stock P/E: 31.8
📊 ROCE: 21.4% | ROE: 21.9%
📊 Sales & EPS Improving YoY – Strong growth trend
⚠️ Why Small Position?
🚨 Market is in a downtrend – We are trading against the broader trend.
🚨 Deep SL (~22.53%) – If the market falls further, stop-loss might get hit.
🔥 Why Consider It?
👉 Stocks like these can be potential winners once the market stabilizes. Keeping it on the watchlist is worthwhile!
📊 Monitor price action closely before committing fully!

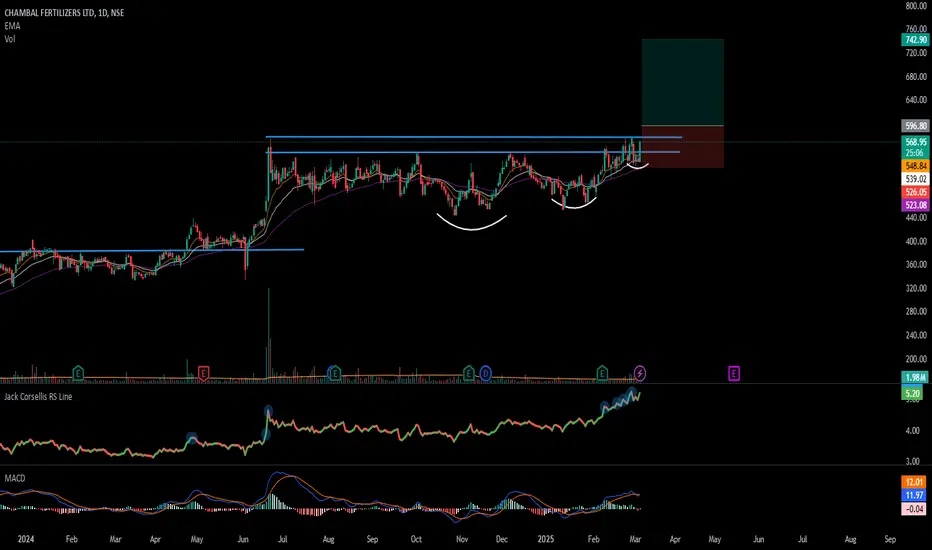
#CHAMBLFERT – VCP Pattern Forming! Keep It on Your Radar! 📊 Script: CHAMBLFERT
Key highlights: 💡⚡
📈 VCP in DTF
📈 Wait BO with Volume in DTF
📈 Wait for consolidation
📈 MACD needs to give a Bounce
📈 Price consolidated for 258 days
📈 One can go for Swing Trade
⚠️ Over All Market condition is bad, Practice paper trading
🟢 If you have any questions regarding the setup, please feel free to leave your inquiries in the comments, and I will respond promptly.
BUY ONLY ABOVE 596 DCB
⏱️ C.M.P 📑💰- 562
🟢 Target 🎯🏆 – 20%
⚠️ Stoploss ☠️🚫 – 10%
⚠️ Important: Always Exit the trade before any Event.
⚠️ Important: Always maintain your Risk & Reward Ratio.
✅#Boost, #Like & #Follow to never miss a new idea! ✅
Disclaimer: I am not SEBI Registered Advisor. My posts are purely for training and educational purposes.
Eat🍜 Sleep😴 TradingView📈 Repeat 🔁 – MMT
Happy learning with MMT. Cheers!🥂
AVANTI FEEDS - VCP Pattern Breakout Watchlist 📈 AVANTI FEEDS - VCP Pattern Breakout Watchlist 🔥
Formation: VCP (Volatility Contraction Pattern)
Today's Action: Forming a Wide Range Candle with rising volume 📊
Key Level: If closes above ₹797, can consider adding a small quantity ✅
Technical Strength: Trading above 50 & 200 DMA 📈
Support Levels: Marked below for reference
Volume: Picking up, indicating accumulation by smart money 💰
💡 Why Add to Watchlist?
✅ Wide Range Candles forming as price moves up with volume 🔥
✅ Sector Showing Strength – Group movements seen in similar stocks 🚀
✅ Accumulation Signs – Strong hands likely entering 📊
⚠️ Market Condition:
The market is weak & unstable 📉, so this is just an alert to keep on your radar. Once the market stabilizes, such setups tend to move well. Don't go all in—watch and buy in small quantities only.
📌 Action Plan:
👉 Keep on Watchlist 👀
👉 Wait for a strong close above ₹797
👉 Gradual accumulation, not aggressive buying
🔎 Do Your Homework in a Bear Market! 🧐
Stocks like this don’t just appear—they are selected based on patterns, volume action, and sector strength 📈
Bear markets separate smart investors from the crowd—use this time to analyze & learn 🧠
Bull markets don’t give time to learn—by then, prices move too fast! 🚀
In a bull market, mistakes are forgiven. In a bear market, even small mistakes can hurt 😓
📢 Final Thought:
📚 Bear markets are for learning.
💎 Bull markets reward those who prepared.
🚀 Stay ahead, do your research, and execute with discipline!
📢 Disclaimer: This is not financial advice. Do your own research before taking any trade. Risk management is key! 🚨

#CHOLAFIN - VCP / C&H BO in DTF📊 Script: CHOLAFIN
Key highlights: 💡⚡
📈 VCP in DTF
📈 BO with Volume
📈 MACD gave a Bounce
📈 Price consolidated for 85Days
📈 One can go for Swing Trade
⚠️ Over All Market condition is bad, Practice paper trading
🟢 If you have any questions regarding the setup, please feel free to leave your inquiries in the comments, and I will respond promptly.
BUY ONLY ABOVE 1435 DCB
⏱️ C.M.P 📑💰- 1433
🟢 Target 🎯🏆 – 6%
⚠️ Stoploss ☠️🚫 – 2.90%
⚠️ Important: Always Exit the trade before any Event.
⚠️ Important: Always maintain your Risk & Reward Ratio.
✅#Boost, #Like & #Follow to never miss a new idea! ✅
Disclaimer: I am not SEBI Registered Advisor. My posts are purely for training and educational purposes.
Eat🍜 Sleep😴 TradingView📈 Repeat 🔁
Happy learning with MMT. Cheers!🥂

Muthoot Finance | VCP Pattern in Play Muthoot Finance | VCP Pattern in Play 🔍
Technical Overview
📈 Trend: Uptrend, trading within an ascending channel.
🔄 Pattern: Volatility Contraction Pattern (VCP) in progress, signaling potential explosive movement.
📉 Correction: The stock corrected ~15% during the recent market sell-off but rebounded strongly, re-entering the channel. It’s now only ~9% off its recent ATH, showcasing resilience.
Key Levels to Watch
✅ Entry Point: Breakout above ₹2279 with strong volume and a wide-range candle.
🎯 Targets:
T1: ₹2492 (R:R = 1:1)
T2: ₹3200+ (post-market stabilization, aiming for R:R = 1:2)
🛡️ Stop Loss: ₹2067.9 (below the most recent swing low to manage risk).
Strategy
1️⃣ Enter 30% position on a clean breakout above ₹2279. Wait for a retest and continuation to add the rest.
2️⃣ If the breakout is sharp and you miss the entry, wait for a retest and continuation before entering, do not enter in FOMO.
3️⃣ Once T1 is hit, book partial profits to lock in gains, given the weak market conditions.
4️⃣ Hold the remaining position as per your risk appetite and trail your SL to protect profits.
Why This Stock?
⭐ Resilience: Despite the correction, Muthoot Finance re-entered the channel, showing strength against market headwinds.
📊 Strong Indicators: RSI is rising, signaling bullish momentum, and the VCP pattern suggests tightening volatility before a potential breakout.
📉 Controlled Drawdown: From its ATH, the stock fell just ~9%, demonstrating relative strength compared to the broader market.
⭐Trading above Key DMAs
Key Risks to Consider
⚠️ Weak Market Conditions: Broader market trends remain bearish, trading below the 200 DMA, increasing the chance of a failed breakout.
⚠️ Volume Dependency: Strong breakout volume is essential to validate the pattern.
⚠️ Market Correlation: Any further market correction could pressure this trade setup and the probability of hitting the SL increases. So trade light.
Who Should Trade This?
1️⃣Aggressive Traders: Can follow the breakout strategy with proper position sizing.
2️⃣Conservative Traders: Wait for market stabilization and a close of NIFTY 50, Nifty 500 above the 200 DMA before entering any trade.
Actionable Insights
🔒 Lock Partial Profits at T1: Secure gains to mitigate risk in this volatile environment.
📈 Trail Your Stop Loss: Once T1 is achieved, manage the trade dynamically to maximize returns.
Disclaimer
This analysis is for educational purposes only and not financial advice. Please conduct your own research and analysis before making any investment decisions. Trading involves significant risk.
Trade wisely and stay disciplined! 🚀📊

#ASTRAZEN - Potential All Time High BreakOut / Feb'25📊 Script: ASTRAZEN
Key highlights: 💡⚡
📈 Stock is in a Stage 2 Up Trend
📈 VCP under formation in DTF
📈 Wait for more consolidation
📈 BO with volume spike, then only enter
📈 MACD can give a Bounce
📈 RS Line is making 52WH
📈 EMA Rule in place
📈 Price consolidated for 73Days
📈 One can go for Swing Trade
⚠️ Over All Market condition is bad, Practice paper trading
🟢 If you have any questions regarding the setup, please feel free to leave your inquiries in the comments, and I will respond promptly.
BUY ONLY ABOVE 7955 DCB
⏱️ C.M.P 📑💰- 7498
🟢 Target 🎯🏆 – NA%
⚠️ Stoploss ☠️🚫 – NA%
⚠️ Important: Always Exit the trade before any Event.
⚠️ Important: Always maintain your Risk & Reward Ratio.
✅#Boost, #Like & #Follow to never miss a new idea! ✅
Disclaimer: I am not SEBI Registered Advisor. My posts are purely for training and educational purposes.
Eat🍜 Sleep😴 TradingView📈 Repeat 🔁
Happy learning with MMT. Cheers!🥂
