Vedanta Ltd. - Stock AnalysisDate : 02-Dec-2025
LTP : Rs. 538.40
Technical View:
• NSE:VEDL is in primary uptrend since Nov 2023 and currently trading through it's secondary uptrend since 29-Aug-2025.
• During it's previous Secondary Downtrend, it has retraced 31% from 526.95 on 16-Dec-2024 to 363 on 7-Apr-2025.
• NSE:VEDL was going through almost a year long Accumulation Phase and has formed a Rounding Bottom Pattern.
• NSE:VEDL has breakout from a Neckline of Rounding Bottom Pattern with higher than average volume which is indicating a start of Participation Phase.
• NSE:VEDL is trading above 20 DEMA and 50 DEMA since last few sessions.
• MACD is trading at 9.03 and RSI is trading at 66.99.
• NSE:VEDL is looking bullish from here onwards.
• Resistance Levels : (R1) Rs. 625 --> (R2) Rs. 690
• Support Level : Rs. 493
If you have liked this analysis, please Like/Boost this idea and follow me for more ideas.
Disclaimer : I am not a SEBI registered analyst/consultant and not recommending anyone to take any BUY or SELL position in stock market. Investing in stock market is risky and one should do a self analysis and validation before investing in stock market. My ideas are published for learning purpose only and are available to everyone at no cost/charge.
Vedantatechnicalanalysis

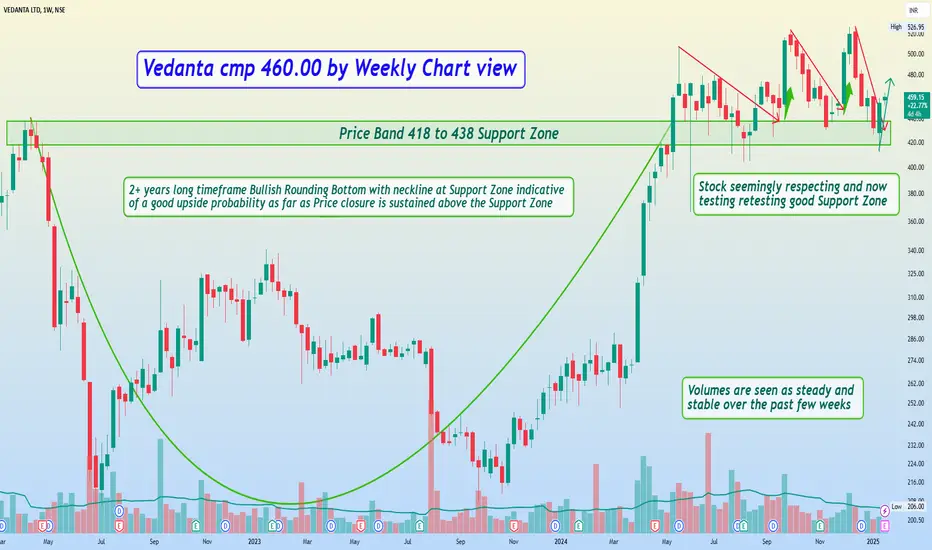
Vedanta cmp 460.00 by Weekly Chart viewVedanta cmp 460.00 by Weekly Chart view
- Price Band 418 to 438 Support Zone
- Volumes are seen as steady and stable over the past few weeks
- Stock seemingly respecting and now testing retesting good Support Zone
Vedanta cmp 449.75 by Weekly Chart viewVedanta cmp 449.75 by Weekly Chart view
- Price Band 418 to 436 Support Zone
- Next Support Zone 321 to 331 at Price Band
- Volumes are seen as steady and stable over the past few weeks
- Stock seemingly respecting and testing retesting good Support Zone 420 to 440
- 2+ years long timeframe Bullish Rounding Bottom with neckline at Support Zone
- Technical setup indicative of good upside probability until Price closure sustains above Support Zone
