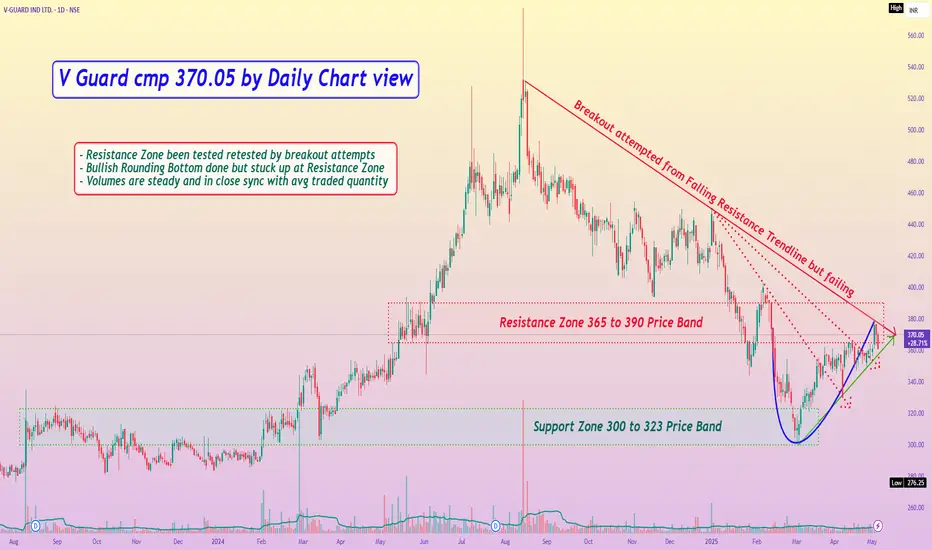
V Guard cmp 370.05 by Daily Chart viewV Guard cmp 370.05 by Daily Chart view
- Support Zone 300 to 323 Price Band
- Resistance Zone 365 to 390 Price Band
- Resistance Zone been tested retested by breakout attempts
- Bullish Rounding Bottom done but stuck up at Resistance Zone
- Volumes are steady and in close sync with avg traded quantity
- Breakout attempted from Falling Resistance Trendline but failing
Vguardanalysis
VGUARD OUTLOOKI used Trend Break and Fibonacci retracement tools to discover VGUARD stock's recent uptrend break and then reversed to previous levels to find probable support levels.
Analysis:
Starting Point: Mentioned on the chart
Ending Point: Mentioned on the chart
Disclaimer: This is for educational purposes only. Conduct your own research and consider your risk tolerance before trading.

VGUARD coming out of 4 year consolidation !!!Breakout with High Volume and but with High RSI
Wait for retest.
Good Fundamentals and Good Mutual Fund holdings

Long VGUARD...Upswing ReversalVGUARD
CMP - 221
Stop - 215 on DCB
Expectation -
1 - 260
2 - 300, Review at 260
Expected Holding Period - 40 trading days or earlier
Ideas being shared only for educational purpose

VGuardV-guard industries is currently in consolidation phase for sometime. We can see some sudden movements in the upcoming sessions


