Vimta Labs Limited - Breakout Setup, Move is ON...#VIMTALABS trading above Resistance of 607
Next Resistance is at 1113
Support is at 498
Here are previous charts:
Chart is self explanatory. Levels of breakout, possible up-moves (where stock may find resistances) and support (close below which, setup will be invalidated) are clearly defined.
Disclaimer: This is for demonstration and educational purpose only. This is not buying or selling recommendations. I am not SEBI registered. Please consult your financial advisor before taking any trade.
VIMTALABS

Vimta Labs Limited - Breakout Setup, Move is ON...#VIMTALABS trading above Resistance of 952
Next Resistance is at 1214
Support is at 691
Here are previous charts:
Chart is self explanatory. Levels of breakout, possible up-moves (where stock may find resistances) and support (close below which, setup will be invalidated) are clearly defined.
Disclaimer: This is for demonstration and educational purpose only. This is not buying or selling recommendations. I am not SEBI registered. Please consult your financial advisor before taking any trade.

Vimta Lab Rounding Pattern Breakout Vimta Lab given Rounding Pattern Breakout on 1 Day as well as on 1 Week . It's a good movement after a good consolidation phase of 1 Month Approx . It may move 10 -15% Easily .
Entry Was Near 730
SL 5%
Tgt - Trial Basis . No body knows . Kitna Up jayega. So. Trail SL.
Consult your financial advisor before making any position in stock market.
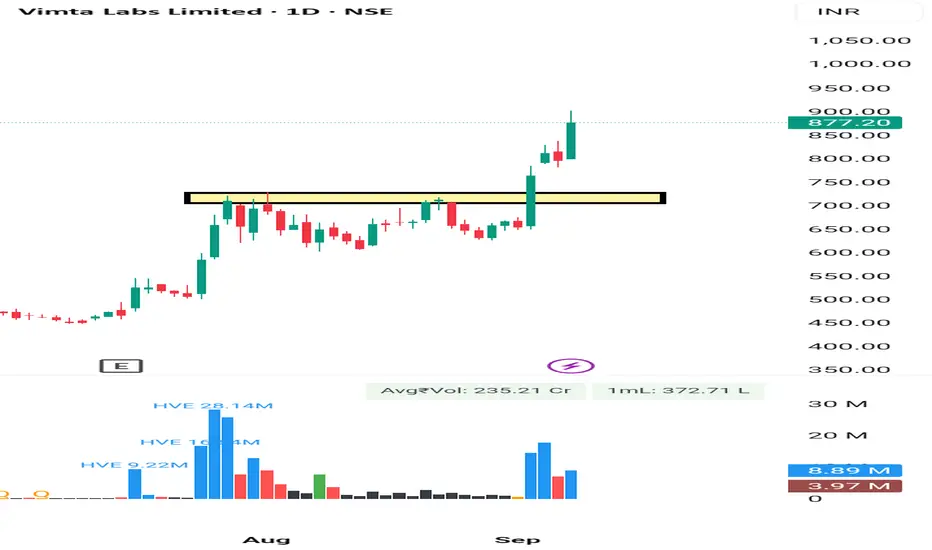
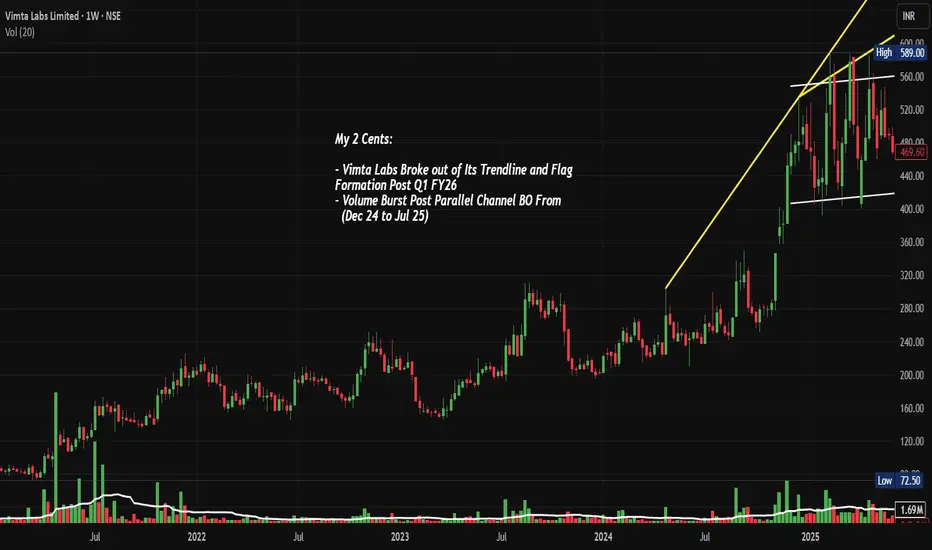
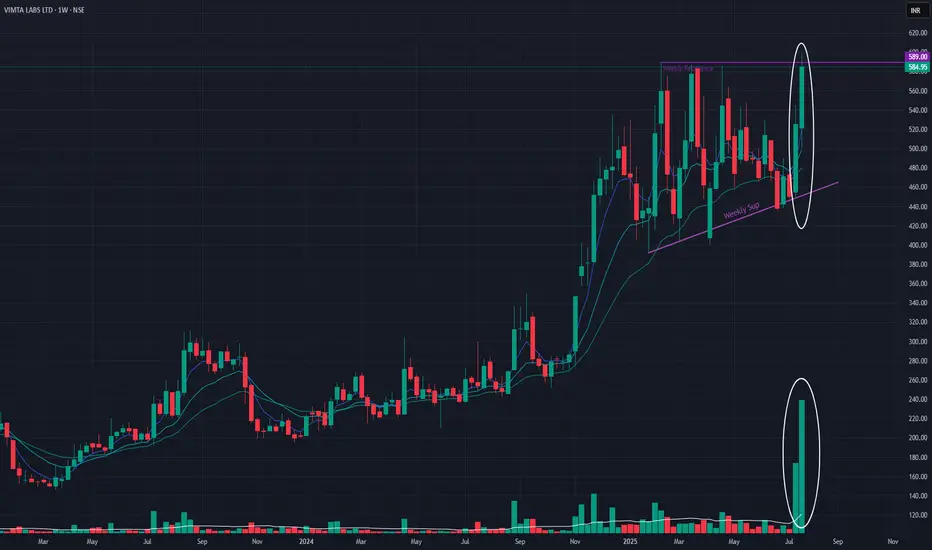
VIMTALABS: Parallel Channel & Flag BO, Chart of the WeekNSE:VIMTALABS Explodes 50%: From Parallel Channel Prison to Trendline Freedom Post Q1 FY26 Flag Breakout. Let's analyse it in the "Chart of the Week"
As per the Latest SEBI Mandate, this isn't a Trading/Investment RECOMMENDATION nor for Educational Purposes; it is just for Informational purposes only. The chart data used is 3 Months old, as Showing Live Chart Data is not allowed according to the New SEBI Mandate.
Disclaimer: "I am not a SEBI REGISTERED RESEARCH ANALYST AND INVESTMENT ADVISER."
This analysis is intended solely for informational purposes and should not be interpreted as financial advice. It is advisable to consult a qualified financial advisor or conduct thorough research before making investment decisions.
Price Action Analysis:
- Current Price: ₹887.20 (as per chart)
- 52-Week Range: ₹252 to ₹903
- Market Cap: ₹3,901 Crores
- Recent Performance: Stock has shown exceptional momentum with 171% returns in the past year
Volume Spread Analysis:
- Breakout Volume: Exceptional volume spike during the August 2025 breakout
- Volume Confirmation: Higher volumes on up-moves, lower on corrections
- Accumulation Phase: Steady volume during the consolidation phase indicates smart money accumulation
Chart Patterns:
- Long-term Ascending Trendline: Yellow trendline acting as dynamic support since May 2024
- Parallel Channel Breakout: Stock consolidated in a 6-month parallel channel (₹400-550) from December 2024 to July 2025
- Flag and Pennant Formation: Classic continuation pattern post Q1 FY26 results
- Volume Breakout: Massive volume surge accompanying the breakout, confirming genuine momentum
Key Technical Levels:
- Base Formation: ₹400-450 level established during Dec 2024 - Jul 2025 consolidation
- Primary Support: ₹550-600 (previous resistance turned support)
- Secondary Support: ₹500 (parallel channel upper boundary)
- Immediate Resistance: ₹700-750 (psychological levels)
- Final Resistance: ₹900-1000
Fundamental and Sectoral Backdrop:
Company Overview:
- Contract Research and Testing Organization serving biopharmaceutical, food, consumer goods, electronic, electrical, agrochemical, healthcare, and medical device sectors
Financial Performance:
- Q1 FY26 Results: Net profit rose 53.83% to ₹19 Crore, sales increased 30.29% to ₹98 crore
- Recent Quarter: EBITDA margins at 35.7%
- Debt Position: The Company is almost debt-free
Sector Dynamics:
- CRO/CRAMS Sector: Strong tailwinds from global pharmaceutical outsourcing
- Biologics Focus: Company expanding in high-growth biologics testing segment
- Regulatory Compliance: Successfully completed US FDA GCP certification
Other Highlights:
- Consistent revenue growth across quarters
- Strong margin expansion and operational efficiency
- Debt-free balance sheet providing financial flexibility
- Expanding service offerings in high-margin biologics
- Beneficiary of the global pharma outsourcing trend
Key Risk Factors:
- High valuation metrics post recent rally
- Dependence on the pharmaceutical sector cycles
- Regulatory compliance requirements
- Competition from larger CRO players
Market Sentiment:
- Recent 31% surge to hit a new 52-week high of ₹902, reflecting strong investor interest
- Strong institutional interest evidenced by consistent buying
- Positive analyst coverage post strong quarterly results
Full Coverage on my Newsletter this Week
Keep in the Watchlist and DOYR.
NO RECO. For Buy/Sell.
📌Thank you for exploring my idea! I hope you found it valuable.
🙏FOLLOW for more
👍BOOST if you found it useful.
✍️COMMENT below with your views.
Meanwhile, check out my other stock ideas on the right side until this trade is activated. I would love your feedback.
As per the Latest SEBI Mandate, this isn't a Trading/Investment RECOMMENDATION nor for Educational Purposes, it is just for Informational purposes only. The chart data used is 3 Months old, as Showing Live Chart Data is not allowed according to the New SEBI Mandate.
Disclaimer: "I am not a SEBI REGISTERED RESEARCH ANALYST AND INVESTMENT ADVISER."
This analysis is intended solely for informational purposes and should not be interpreted as financial advice. It is advisable to consult a qualified financial advisor or conduct thorough research before making investment decisions.
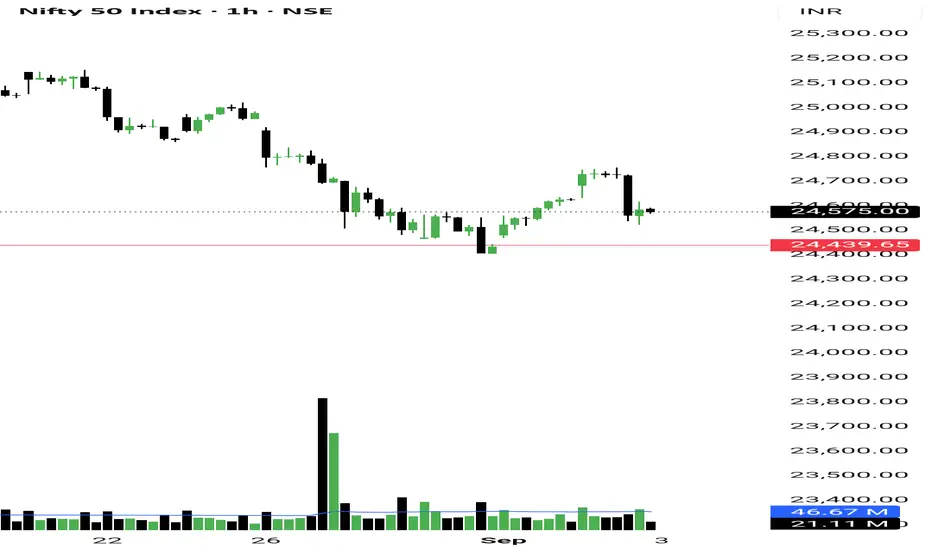
We are in the 2nd phase in Nifty So the market moved exactly as we planned. NSE:NIFTY hit the 24750 target and then a Sell-on-Rise move dragged it lower into the close.
This is why I mentioned yesterday that my stance would stay ‘Cautiously Bullish’.
- Now, Nifty’s Pivot has shifted up to 24619.
- PP stands at 0.16%.
- Sellers’ volume is heavier than buyers by about 35 million.
If we connect these points, if Nifty opens below Pivot and breaks the 24550 support, then we may see a quick drop towards 24450. If that level also gives way, then 24250 could come into play.
But remember, individual stocks will still perform better. So stay stock-specific this and next week. Don’t chase breakouts, and avoid buying on MTF for now.
This looks like a shakeout phase — needed to bring liquidity before Bulls take control again. Market trends always move in 3 phases:
1. Accumulation
2. Manipulation
3. Distribution
Right now, we are in phase 2 (manipulation). The key is to spot where liquidity is building — that’s where you’ll find the exact bottom.
NSE:BANKNIFTY is still holding support at 23575. If that breaks, 52680 can be expected in the coming days. Resistance sits at 54029.
Sector-wise, construction and sugar look strong for tomorrow.
My Today’s trades and performance:
1. NSE:MOBIKWIK – up 18.23%
2. NSE:VIMTALABS – up 16.83%
Both hit upper circuits, so we booked full profit. Also fully booked $NSE:OLAELEC.
That’s all for today. Take care. Have a profitable tomorrow.
Vimta LabsVimta Labs
VLL is is in the business of contract research and testing in the fields of biologics, small molecules, agro -chemicals, food & beverages, electronics, clinical diagnostics, medical devices, home and personal care products, and environment testing
On July 12th 2024, company approved the scheme of amalgamation of its Wholly Owned Subsidiary company viz. Emtac Laboratories Pvt. Ltd. with the Holding Company
Market Cap: ₹ 2,603 Cr.
Promoter holding: 36.7 %
FII holding: 3.49 %
DII holding: 1.42 %
Public holding: 58.4 %
Debt: ₹ 8.52 Cr.
Debt 3Years back: ₹ 19.0 Cr.
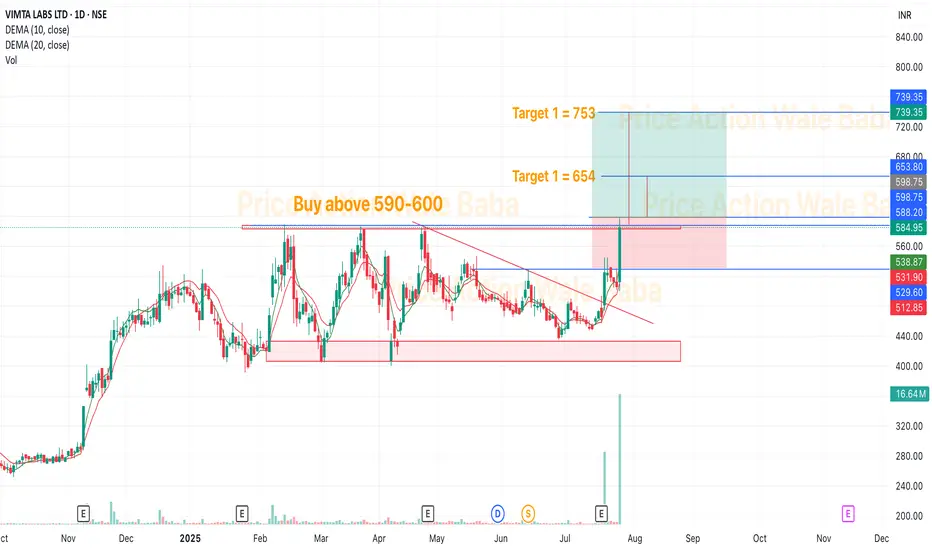
Looks good to buy and hold for the given Targets.
Vimta Labs Ltd (Weekly Timeframe) - Potential BreakoutThis week, the stock has breached the resistance zone and made a new All Time High with huge volume. In Daily Timeframe, the stock has clearly been forming an Ascending Triangle Pattern which is a Bullish pattern. If the stock breaches the resistance zone with good volume, then it may reach new All Time Highs of 780 range.
Awaiting further Price Action.

Long Vimta Labs LtdVimta labs has broken out after almost 2 years. Buy between 580-530 and EXIT if closes below 490

VIMTALABS - SWING TRADEEntry - 415
Target - 475
SL - 397.5
Price retraced to EMA 10 & resuming Upmove
EMA 10 > EMA 21 > EMA 50 > EMA 150 > EMA 200

Topline Growth + Op Leverage ComboChart is self explanatory.
Vimta Labs is one of the well known food testing companies in India.
As per Management guidance,
1. Company is targeting 500 Cr Revenue for 2026; and
2. Margin Expansion upwards of 30%
At expected Revenue of 500 Cr and EBIT margins of 32% by 2026 - EBIT will be around 160 Cr and Net Profit 80 Cr at current NPM of 15%
This equates to an EPS of 37 approximately.
Now here's the tricky part - Finding a reasonable PE for this company.
Ever since it got listed in 2020 at peak PE of 45, the parameter has been declining steadily and is ranging at 20 plus minus 5 now since mid 2021.
At PE of 20, this would mean share price of 20 x 37 EPS = 740 by 2026 which is 25% CAGR approx.
This is a very rough calculation, and things can go wrong, like they did when the company postponed the revenue target from 2025 to 2026.
The price has formed bearish patterns at resistance levels, and it remains to be seen if it can give a breakout in the upside after a small traceback.
Either way, it makes sense to study the business which has been able to 7x its EPS in 3 years, at 25% ROCE.
Note : This is not an investment advice. This post is meant for educational purpose only. Kindly do your own due diligence before investing

VIMTA LABS TARGET UPDATE 13-4-2023Look fresh in range 340-360 for upside 400-430 med term with SL 320..!!!

Vimta Lab IHnS and now new BO#VimyaLab had BO of IhnS at 330 level and now again a BO at 450 levels.
Can be added for 34% upside from here for 610.
CMP 461 Qtr Sales growth is flat but ROCE is healthy.

FOCUS VIMTALABVannakam Makkale, found some decent breakout from a consolidation range in VIMTALAB. Focus, as per your risk reward. First target will be around 597. As I always say whatever we do must follow risk reward and money management.
Thank you for following and share it with your friends and family 😊
@trade_withpriceaction ❤

VIMTALABS TL & BO !!NSE:VIMTALABS
#NSE:VIMTALABS trading @ one year old resistance and Trendline.
Levels marked on chart.

ADSC Mini Swing Call // Monday July 18th 2022 // NSE: VIMTALABSADSC Mini Swing Call // Monday July 18th 2022 // NSE: NSE:VIMTALABS
// This is a swing trade call and not an intra-day trade. Please do not expect the stock to go up on the same day of posting or within a few sessions. Please follow the notes along with the posting before, during and after entering the trade //
CMP / LTP: 398
TARGET: 418+ (15% Around)
STOP LOSS: 388 (10% Max)
Standard Notes:
- Please follow the Stop Loss strictly and preferably on a daily closing basis.
- Duration: 3-5Trading Days is suggested for all the mini swings and is an indicative period.
- If SL / Target are not triggered and you still wish to hold the trade, this can be done as long as SL is followed or trailed.
Disclosure: I may or may not have a position in this trade.
Disclaimer: All the recommendations are subject to market conditions. Please trade at your own risks.

VIMTALABS - Uptrend continue Looking at the today's close and current trend of VIMTALABS
Close crossed Monthly Pivots
Stock is out of Squeeze
Closed Marubozu
Also above 20 - SMA on Daily / Weekly/Monthly time frames
The monthly trend is Positive and the Weekly trend is also Changed to +ve
Close Crossed Weekly-13 Upside.

VIMTALABSCMP: 415
Cup and handle breakout at All Time High.
385-90 can act as support.
450, 470 can be seen.

VIMTALAB - Positional Long1. Clear Cup & Handle Breakout in weekly
2. Retested support but not broken amidst market sell offs - indicates strength (visible in Daily chart)
3. All time highs

VIMTALABS - New ATH soon! Key Highlights:
1. Bullish market structure on HTF
2. Broke above the horizontal level
3. Support from 200 MA
4. RSI indicates a possible uptrend
5. Good breakout on the weekly time frame
6. Volume lacking at the moment
Disclaimer: This is NOT investment advice. This chart is meant for learning purposes only. Invest your capital at your own risk.
Rajat Kumar Singh (@johntradingwick)
NSE Certified Technical & Fundamental Analyst

Vimta, Head and shoulders breakout#vimtalabs
Vimta labs looks good to add at 340-350 range.
Has shown good volumes at breakout area.
#vr


VIMTA Labs LONG after multiyear breakoutVimta Labs is engaged in the business of testing food and drugs. It also does contract research for clinical research and pre-clinical studies.
Company was expected to give good quarter and has delivered.
VIMTA LABS: Q2 CONS NET PROFIT 97M RUPEES VS 75M (YOY); 81M (QOQ) || Q2 REVENUE 754M RUPEES VS 593M (YOY); 613M (QOQ)
DII have bought significantly in the last quarter, Some news is coming up
TARGET : See CHART
