Vodafone - IdeaVodafone idea is the most trending stocks when comes to trading, because of small prices and movement.
Here, I have done some analysis of it and where you can find its trend.
1. Trend Understanding
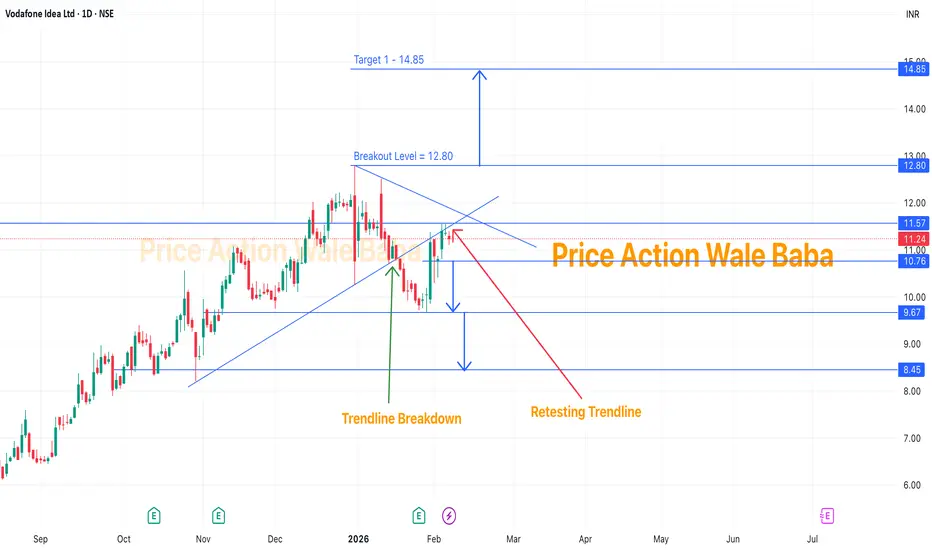
- Vodafone idea was consolidating and then give the breakdown from rising channel or bearish flag.
- Then it had made a low of 9.68 and pull back to re-testing trendline.
- So, it is on trendline retesting and not going up.
2. Bearish Strategy
- So, what's now?? We should check if it will go down from here and again touch 9.68, then it will formed a head and shoulders pattern with neckline level 9.68.
- When it breaks 9.68 we can sell it for the target of 8.45.
3. Bullish Strategy
- Now, to see upside, we have to wait when it will breaks it high of 12.80.
- Once, it will breaks and sustain above 12.80, we will see target of 14.85 and more.
So, untill it can be sideways and consolidation in range of 12.80 and 9.68.
Vodafone
Part 1 Ride The Big Moves Common Mistakes to Avoid
Holding OTM options too close to expiry hoping for a miracle.
Selling naked calls without understanding unlimited risk.
Over-leveraging with too many contracts.
Ignoring commissions and slippage.
Not adjusting positions when market changes.
Practical Tips for Success
Backtest strategies on historical data.
Start with paper trading before using real money.
Track your trades in a journal.
Combine technical analysis with options knowledge.
Trade liquid options with tight bid-ask spreads.

"Together for Tomorrow"📌 Vodafone Idea Ltd – Chart at Crucial Support Zone
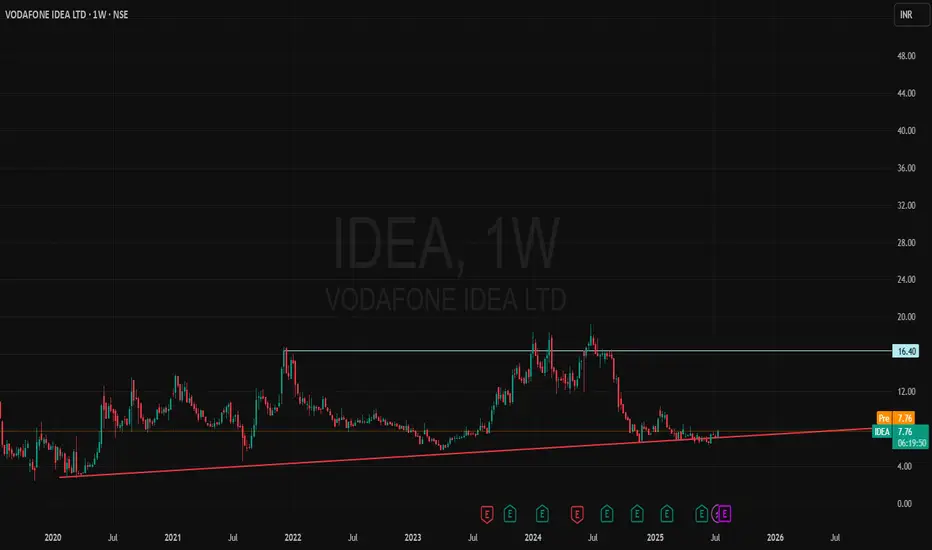
🔍 Stock has successfully respected long-term support near ₹6.10–7.40 multiple times since 2021.
✅ Recent bounce backed by strong volume and improving technical structure.
✅ Gradual accumulation visible since past few weeks.
✅ RSI and price action both attempting to hold higher lows.
✅ OBV and momentum indicators hinting at early signs of recovery.
✅ Price trading inside a broad ascending triangle pattern since 2020 – potential breakout above ₹9 could confirm long-term trend reversal.
🧠 Risk-Reward looks favourable for long-term positional investors from current levels, with strict SL near ₹6.10.
🎯 Ideal for positional traders & long-term investors with a medium-term view.
📝 Note: Please do your own due diligence. This is not a recommendation, just a view based on charts and fundamentals.
🧠 Disclaimer: For educational and research purposes only. No buy/sell advice.
📝 Chart Purpose & Disclaimer:
This chart is shared purely for educational and personal tracking purposes. I use this space to record my views and improve decision-making over time.
Investment Style:
All stocks posted are for long-term investment or minimum positional trades only. No intraday or speculative trades are intended.
⚠️ Disclaimer:
I am not a SEBI registered advisor. These are not buy/sell recommendations. Please consult a qualified financial advisor before taking any investment decision. I do not take responsibility for any profit or loss incurred based on this content.
"Vodafone Idea: Potential Turnaround or Risky Swing Opportunity? "Vodafone Idea: Potential Turnaround or Risky Swing Opportunity?"
Stock: Vodafone Idea Ltd.
Analysis:
Vodafone Idea has faced significant challenges, with the stock currently down 58.34% from its 52-week high, reflecting its struggle in a competitive market. However, recent developments suggest the possibility of a turnaround for this stock, making it an interesting pick for high-risk, short-term investors.
Key Highlights:
Recent Developments:
Preferential Issue: Recently announced, which is expected to help the company stabilize its finances.
Government Support: Positive policy news for the telecom sector could provide a much-needed boost.
Technical Setup:
Volume Activity: High volume seen recently, indicating renewed interest.
Moving Averages: Convergence of key moving averages suggests a potential reversal.
Institutional Support:
FII Stake: Gradual increase in FIIs' holdings reflects cautious optimism.
Financials:
While the company is still loss-making, financial metrics show signs of improvement, supported by external measures.
Trade Plan:
CMP: ₹8.
Target: ₹11 (short-term swing).
Risk: High. This stock remains speculative, suitable for those with a high-risk appetite.
Stop Loss: ₹6.5 for risk management.
Disclaimer:
This analysis is for educational purposes only and is not financial advice. The stock is speculative and comes with high risks. Please conduct your own research or consult a financial advisor before making any investment decisions.

IDEA: What is your idea sirji?As we all know and seen about the rise and fall of Idea stock due to AGR Dues and all other reason.
Let me know your opinion about should we again hop back on idea for next set of rally or idea is going to lose all its gloery this time.
IMO we have to wait till we can see a close above 12 rs on monthly time frame.
It does not constitute and cannot replace investment advice. We therefore recommend that you contact your personal financial advisor before carrying out specific transactions and investments.

IDEA 200 ?Hi guys
currently this is a one wave analysis i will share more chart of idea if this is happen
I am sharing a analysis of idea share which is current trading at 10rs levels, I am thinking this share will change their trend from 5-4 Rs where this share will complete its second wave as per my analysis we can sit in this share with the previous low which is of 2.40rs and currently i am sharing what i have vision. i will post again chart of idea if it cross above 40.
share your thoughts in comments
Thanks
ishu prajapati

Vodafone Idea : View on penny stock Alert! Bearish Pattern Spotted! 🐻
📊 Pattern: Broadening Pattern
📌 Symbol/Asset: IDEA
🔍 Description: Stock is making Broadening pattern and we can see resistance around 20-22 levels.
In history stock has corrected 50% from the rise so will this time we will see correction of 50% or more ??
23 is crucial resistance level and if stock not able to breakout then we might see good fall.
👉 Disclosure: We are not SEBI registered analysts, this is not a buy or sell recommendation.

#IDEA long trade idea setup (27/11/23)Greetings Folks,
today I have prepared a setup of NSE:IDEA on NSE
the analysis is as follows-
- the price is in retracing mode
- having retraced more than 50% , price is ready to start moving up again
- i am using the support below for entry not the current range support because the price has some imbalance to be filled and just to be on safer side
don't play with fire, always use a predefined stoploss

#IDEA LONG TRADE IDEA SETUPGreetings Folks,
today I have prepared a setup of IDEA on NSE
the analysis is as follows-
- The price is on a good bullish trend
- The price is making a famous triangle pattern
- wait for breakout with good volume, if breaks down then wait for price to settle on the support below
don't play with fire, always use a predefined stoploss

#IDEA SHORT TRADE IDEA SETUP Greetings Folks,
today I have prepared a setup of IDEA on NSE
the analysis is as follows-
- The price has been on a good uptrend, now in my opinion i think price has to retrace to recharge its momentum
- i have marked the nearest support zone for price to settle, but just for safety i have marked another support zone below
- be very cautious if you want to counter trade the trend
don't play with fire, always use a predefined stoploss

#IDEA LONGTERM LONG TRADE SETUPGreetings Folks,
today i have prepared a setup of IDEA on NSE
the analysis is as follows-
- The price structure is very optimal for swing trade right now
- price is trying break the static resistance which has been tested before
- if it breaks it with good strength, we can look for buys at minor retracements at lower time frame
don't play with fire, always use a predefined stoploss

What an #idea Sirji!!!Breakout in Vodafone Idea, levels & stop loss in the analysis.
#vodafoneidea #idea #stocks #stockmarket #elliottwave #trading

IDEA BREAKOUTIdea looks good by breaking falling trendline resistance with good margins and succeed to close above that, giving bullish divergence breakout on RSI indictor too by breaking pervious resistance on that so we can see a nice up move in this stock from here.
Cause of long-:
1- Falling trendline breakout.
2- Rsi indictor breakout.
NOTE-: THIS IS ONLY FOR EDUCATIONAL PURPOSE

Vodafone - Idea If it had to bounce this was the perfect level 08.00Rs as per fib golden level 0.618, also it had taken support on same level 3 times , if it breaks this level it will be weak enough to touch approx. 6.00 rs level which is also a bottom of highlighted channel in light yellow, however it is a good sign to bounce from the same level where it took support 3 times, now upside i see a target of 22-25 rs in 6 mnth - 1yr may be as per previous data analysis , where it meets the bigger channel drew in light green, 16- 17 rs would be its 1st hurdle or can say point of profit booking as per previous channel high where it would also face resistance from Ema 200, which it has not broken since 2012. If we check RSI formation it broke its descending trendline and retested the same and now is upwards. all signs and analysis shows bullishness for coming few months.

Vodafone idea long term analysis Recently monthly chart of Vodafone idea breaks the Trend line. We can see sharp fall in monthly chart. If Vi does not sustain this level the next support will be 5.2 and 4.55. As per current price action looks like Vi can get up to 1.5 Rs or may be less than that.
Desclaimer : This is my view as per current price action. If price pattern changes also change my view. This is not any buy or sell recommendation.

Idea Chart Analysis !!📈 Idea 📉
My Findings :-
1. Breakdown of Support Zone.
2. Breakdown of Head and Shoulder Pattern.
3. Close below Seven Month Low.
Bias- Short
Target- 7.95 and 5.75
SL- 11.55
RR- 1: 1.5
All Important Supports and Resistances are drawn in chart.
All levels are of Spot and on closing basis.
Disclaimer : Consult Your Financial Advisor Before Taking Any Decision On This Analysis.

VODAFONE IDEA - UPDATE Vodafone IDEA on hourly chart seen bullish channel breakout ...which is also indicate strong trend reversal signal , this stock has very good prospectus As telecom sector near term 5G spectrum allotment going to start soon in major cities in india from JAN 2022 and other good booster packages to this sector from GOVT also on card.
BUY Vodafone IDEA cmp@ 13.80
short term target 16
stop loss 12.50
Bullish technical indicators on hourly chart .
1. Stock at support 200 SMA
2. CHANNEL BREAKOUT SEEN ON HOURLY CHART at upper-side.
3. Moving avg crossover
4. MA ADX turn bullish green.
* I hope this idea will helpful to your study and anlysis ..take call at own risk !!
WISH YOU HAPPY TRADING !!

MULTIBAGGER IDEA - VODAFONE IDEAVODAFONE IDEA multiyear chart
strong support at 6 level then around again 10-11 level buy opportunity cause of ...
1. positive outlook about fundamentals from now.
2. technical bullish setup on chart which clearly indicate some signals which mentions on chart.
this stock has potential to prove multibagger stock in years to come
BUY VODAFONE IDEA @ 10.50-11 level
Target 60 ( 1-3 years )
Stop Loss 5.50

VODAFONE IDEA -- B POSITIVE VODAFONE IDEA on 15 MIN chart seen Golden crossover of 20, 50 SMA .
Momentum can be upside from here where bottom has seen at 13.25 , stock movement now at upper side channel from lower pattern , if that support hold then one can keep stop loss bellow 13.25 for target above 15 ,
200 SMA seen at 15 level and if market take good support from here then at closing above 15 level, 16-18 can be near term target.
positive indicators.
1. Golden crossover 20,50 SMA
2. Trend line breakout
3. MACD above center
WISH you HAPPY TRADING.!!

VODAFONE IDEA - INTRADAY SETUP - 06/01/2022VODAFONE IDEA --intraday seen double bottom support on 15 min chart so pick as intraday 06/01/2022, as one can buy around intraday deep at strong support level 14.80-15 for target 15.60-15.80 stop loss 14.45
BUY IDEA @ 14.80-15
TARGET 15.60-15.80
STOP LOSS 14.45
* please do own analysis and study ..this idea can helpful for same...take call at own risk. !!
WISH YOU HAPPY TRADING. !!

BUY VODAFONE IDEAMonthly close above the AVWAP will trigger a fresh buying interest in the stock.
1st target 26
2nd target 64
3rd target - will update post 2nd target

Inverted Head & Shoulder Chart Pattern - Vodafone Idea (Daily) Inverted Head & Shoulder Chart Pattern
Vodafone Idea ( Daily timeframe )
Target is 20.9 (i.e. depth of the head when placed on expected breakout point of 13.85 on the neckline of inverted head & shoulder)
It has entered the 5th wave ( Elliott Wave Count)
MACD is in positive crossover state above the zero line of the histogram
Histogram has solid green bar formations
RSI is above 60 and Stochastic (14,3,3) is in positive crossover state too
+DI is above the -DI in the Directional Movement Index (DMI)
ADX is well above 15 (indicating momentum speed)
On the weekly tide chart too, all indicators/oscillators are favourable

Positional BUY Trade | IDEA | LONG-TERMNSE:IDEA
One weekly time frame it gave breakout of 200 MA with increased volume.
200MA is placed at 15.11 level.
Any dip above 15 level will be good buying opportunity.
SL can be 13.45
Short term target can be 18.05
Mid Term Target can be 20
Long term target can be 23.40.
***************Please note this is my own study/opinion, it is not a trade recommendation**********************
Please Consult your financial advisor before making any investment.
