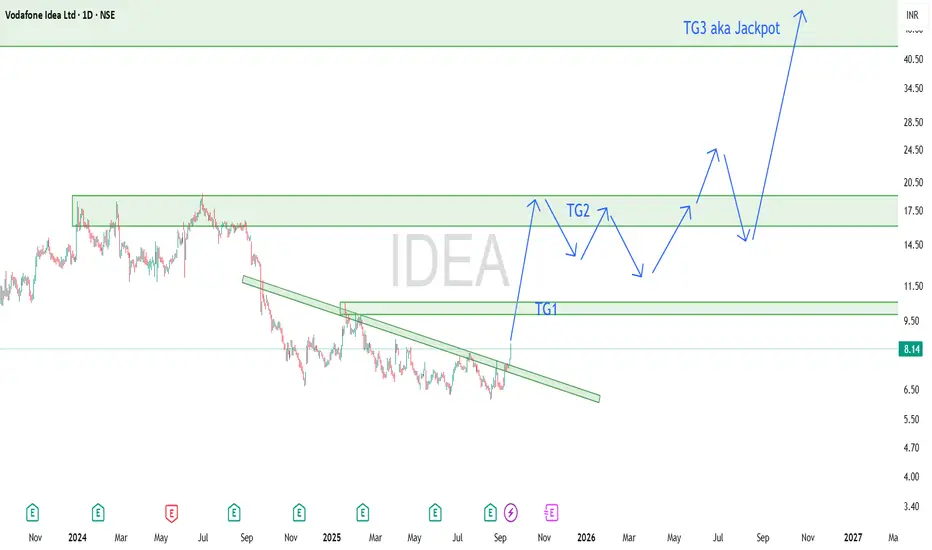
How to make Vodafone Idea a multibagger by 2026-2027After consolidating heavily at the bottom IDEA is finally moving up, We can plan for a long term view for insane profits, it will take months though. If your view is short just keep looking for bullish inside candle after a retracement and enter or Look out for good options CE setups in intraday for the next year or so, You can ride using 20 and 50 SMAs.
I'm gambling on the path(shown in arrows) it might take to reach jackpot, Remember holding that long will be a BUMPY ride, there might be deep retracements, expert traders will add more on those, Noobs will end up panicking and sell on the low of retracements and regret later. We also might see a couple of months long consolidations. If you are happy with the TG1, TG2 gains, you can book early and enter again when a good bullish setup forms.
OR this plan will fail miserably but its worth trying ;)
Entry at CMP or around 7
SL at 5.95
Targets 10, 18, 40 and beyond..
Vodafoneidea
KOTAKBANK 1D Time frame🔍 Current Price & Context
Current Price: ₹2,034.10
Day’s Range: ₹2,027.40 – ₹2,054.60
52-Week Range: ₹1,679.05 – ₹2,301.90
Previous Close: ₹2,031.00
Market Cap: ₹4,04,634 Cr
P/E Ratio: 21.10
Dividend Yield: 0.12%
Beta: 0.97
📊 Technical Indicators
Relative Strength Index (RSI): Approximately 49.64, indicating a neutral stance.
MACD: Positive, suggesting bullish momentum.
Moving Averages:
5-Day: ₹2,032.84
50-Day: ₹2,012.95
200-Day: ₹1,984.69
Pivot Points:
S1: ₹2,029.97
Pivot: ₹2,036.07
R1: ₹2,042.17
🧮 Strategy / Trade Ideas
Long Setup:
Entry: Consider entering near support levels (~₹2,020) if bullish reversal signals appear.
Stop Loss: Place below ₹1,980 to manage risk.
Target: First resistance around ₹2,042, then ₹2,070.
Short Setup:
Entry: If price fails to break above resistance (~₹2,042) and shows signs of reversal.
Stop Loss: Above ₹2,080.
Target: Downside toward ₹2,020, then ₹1,990.

Vodafone Idea (VI) chart pattern analysis + fundamentals + peer Vodafone Idea (VI) chart pattern analysis + fundamentals + peer comparison + learnings
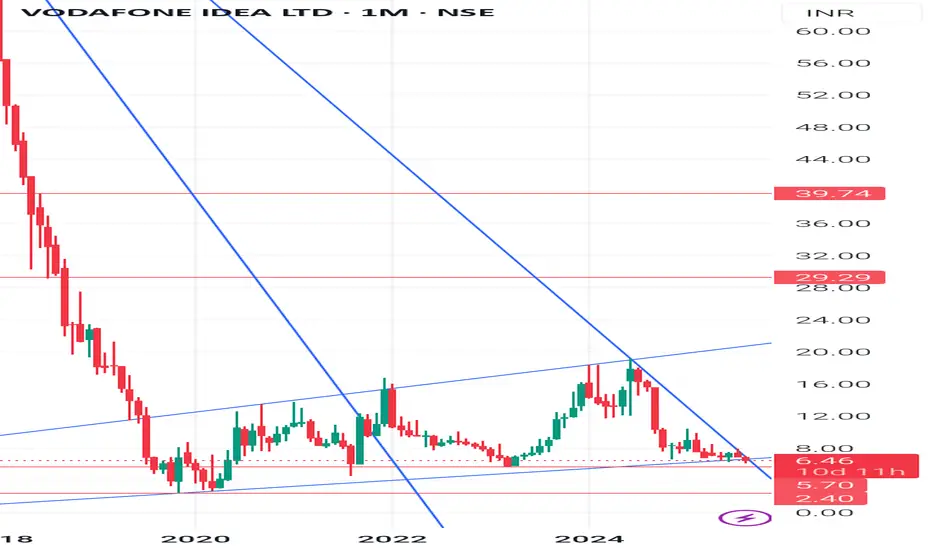
-Technical Chart Analysis – Vodafone Idea (Weekly)
-CMP (Current Market Price): 6.46 (+5.04%)
-Trend: Stock has been in a long-term downtrend since 2018.
👉Key Support Levels:
5.70 (immediate)
4.20 (medium-term)
2.40 (long-term bottom)
👉Resistance Levels:
8.50 (immediate)
12.20 (medium-term)
16.80, then 29.3 & 39.7 (long-term hurdles)
👉Pattern Observation:
Price is struggling near a channel support line.
Stock is in a make-or-break zone – either bounces back from current support or risks sliding further.
Any weekly close above 8.5 will confirm strength and may lead to 12–16 zone.
👉 Fundamental Comparison (Vodafone Idea vs Competitors)
(FY24 / recent data approx)
Company Revenue ( Cr) Net Profit Debt ( Cr) Market Share (Telecom) P/E Ratio ARPU (Avg Revenue/User)
Vodafone Idea - 42,000 Loss (-29,000 Cr) - 2.1 lakh Cr - 19% NA (Loss-making) - 145
Bharti Airtel - 1.4 lakh Cr Profit (- 8,300 Cr) - 1.6 lakh Cr - 33% - 68x - 208
Reliance Jio - 98,000 Cr Profit (- 20,000 Cr) - 1.1 lakh Cr - 38% - 22x - 182
🔑 Key Observations:
-VI is the only loss-making player in top 3.
-Heavy debt (- 2.1 lakh Cr) makes survival tough without tariff hikes or govt. relief.
-ARPU (revenue per customer) is lowest among peers, which shows weak monetization.
-Airtel & Jio are fundamentally stronger with consistent profits.
👉 Basic Learnings for Students / New Investors
1. Chart Patterns Reflect History – A stock in downtrend for years (like VI) shows structural weakness; don’t catch falling knives without reason.
2. Support & Resistance Levels – Help in risk management; always watch where the stock can bounce or fall.
3. Debt is a Red Flag – Too much borrowing restricts growth; fundamentals matter more than temporary price spikes.
4. Compare with Competitors – If peers are profitable (Airtel, Jio) and one is struggling (VI), investors must be cautious.
5. Turnaround Bets are Risky – Such stocks may give multi-bagger returns if revived, or wipe out wealth if debt crushes survival.
Disclaimer👉
This analysis is for educational purposes only. It is not financial advice or stock recommendation. Always consult a SEBI-registered advisor before investing. Market investments carry risk.
#VodafoneIdea #StockMarketIndia #TechnicalAnalysis #FundamentalAnalysis #Airtel #RelianceJio #TelecomSector #StockMarketForBeginners #InvestmentLearning #SupportResistance #ChartAnalysis
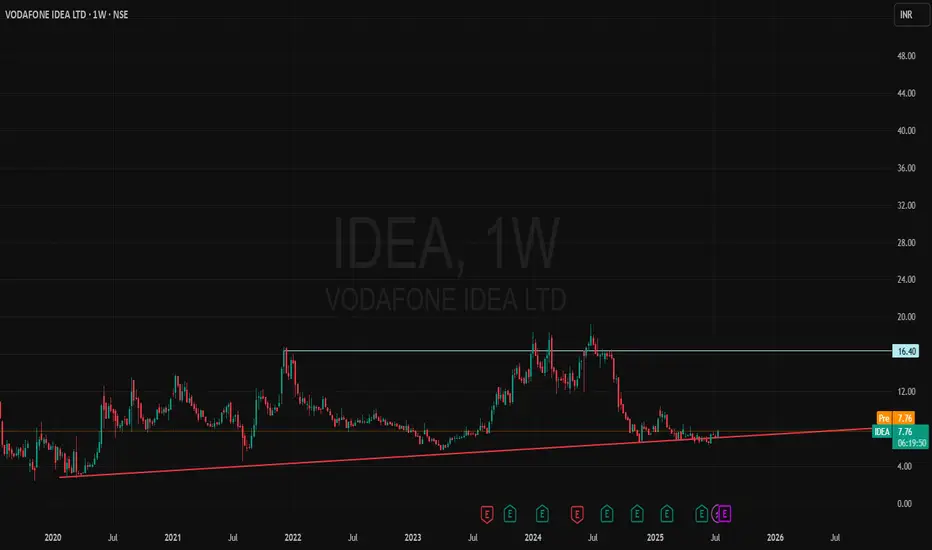
"Together for Tomorrow"📌 Vodafone Idea Ltd – Chart at Crucial Support Zone
🔍 Stock has successfully respected long-term support near ₹6.10–7.40 multiple times since 2021.
✅ Recent bounce backed by strong volume and improving technical structure.
✅ Gradual accumulation visible since past few weeks.
✅ RSI and price action both attempting to hold higher lows.
✅ OBV and momentum indicators hinting at early signs of recovery.
✅ Price trading inside a broad ascending triangle pattern since 2020 – potential breakout above ₹9 could confirm long-term trend reversal.
🧠 Risk-Reward looks favourable for long-term positional investors from current levels, with strict SL near ₹6.10.
🎯 Ideal for positional traders & long-term investors with a medium-term view.
📝 Note: Please do your own due diligence. This is not a recommendation, just a view based on charts and fundamentals.
🧠 Disclaimer: For educational and research purposes only. No buy/sell advice.
📝 Chart Purpose & Disclaimer:
This chart is shared purely for educational and personal tracking purposes. I use this space to record my views and improve decision-making over time.
Investment Style:
All stocks posted are for long-term investment or minimum positional trades only. No intraday or speculative trades are intended.
⚠️ Disclaimer:
I am not a SEBI registered advisor. These are not buy/sell recommendations. Please consult a qualified financial advisor before taking any investment decision. I do not take responsibility for any profit or loss incurred based on this content.
IDEA: What is your idea sirji?As we all know and seen about the rise and fall of Idea stock due to AGR Dues and all other reason.
Let me know your opinion about should we again hop back on idea for next set of rally or idea is going to lose all its gloery this time.
IMO we have to wait till we can see a close above 12 rs on monthly time frame.
It does not constitute and cannot replace investment advice. We therefore recommend that you contact your personal financial advisor before carrying out specific transactions and investments.

IDEA At Weekly SupportHello Everyone,
vodafone idea taken support of weekly trendline with rsi oversold zone closing abve 10 is good opportunity for bulls till resistancce 16,18,22

Idea - An idea may change your life7.50 - 60 new strong support area
9 - 9.10 Strong resistance area
Stock may stuck n reverse a little before turning around
Once close above 9.10 next stop only at 11 & 13.60
Trade accordingly

Bullish Gartley Pattern in Vodafone IdeaHi TradingView Traders,
I am seeing a Bullish Bat Harmonic Pattern in Vodafone Idea.
I am hoping that it’ll drop more 20%-22% from this point. Then a reversal is possible.
And Bullish Harmonic Pattern always tend to give greater returns.
Disclaimer: This is just for educational purposes and not any advice for trading to buy/sell.
Please share a valuable feedback in comments if you if you see any more patterns or ratios.
Give it a rocket if you like this technical analysis.

IDEA 200 ?Hi guys
currently this is a one wave analysis i will share more chart of idea if this is happen
I am sharing a analysis of idea share which is current trading at 10rs levels, I am thinking this share will change their trend from 5-4 Rs where this share will complete its second wave as per my analysis we can sit in this share with the previous low which is of 2.40rs and currently i am sharing what i have vision. i will post again chart of idea if it cross above 40.
share your thoughts in comments
Thanks
ishu prajapati

Idea - Waiting to happen16.30 - 15.65
Decisive Candle Needed above or below
Waiting for some news for trend to set
Expect big moves in coming days

Idea - Major breakout - Cup & Handle - Can double from here !Idea has got several major news in past few days !!
Strong volumes breakout as well !!
Breakout zone is 18.5 and above
Support is around 16
It can easily hit 27-35 levels in coming months !!

Time to get IDEATelecom stocks are positive for long term and Vi is now preparing for turnaround with 5G rollout. Management has done everything they can to ensure things change for the company. It is finally breaking above its previous high. A double bottom breakout is on screen. Waiting for some pullback to enter this.

VODAFONE IDEA - Bullish Swing Reversal with VolumesNSE: IDEA is closing with a bullish swing reversal candle supported with volumes.
Today's volumes and candlestick formation indicates strong demand and stock should move to previous swing highs in the coming days.
The stock has been moving along the horizontal support for the past few days which is indicating demand.
One can look for a 15% to 28% gain on deployed capital in this swing trade.
The view is to be discarded in the event of the stock breaking previous swing low.
#NSEindia #Trading #StockMarketindia #Tradingview #SwingTrade

Vodafone has no Idea for BullishnessVodafone Idea attempted twice to break the resistance zone but unfortunately it couldn't and fall from around 18 Rupees so it becomes strong reistance in bigger time frame but after that in shorter time frame we can see that around 15 is became strong resistance which means whether it is bigger or Shorter timeframe it looking negative overall

vodafone Long ideaVodafone is at Trendline and Horizontal Support
Pivot volume(Volume spike) has come this week.

#IDEA long trade setup (23/01/24)Greetings Folks,
today I have prepared a setup of NSE:IDEA on NSE
the analysis is as follows-
- the price was on a great bullish run
- right now, the indices as well as the stocks has fallen more than anticipated
- the circle marked has the highest probability of being a support now
- no market falls continuously, if this is a start of bearish run, we may see a little retracement in up side
don't play with fire, always use a predefined stoploss

Vodafone Idea : View on penny stock Alert! Bearish Pattern Spotted! 🐻
📊 Pattern: Broadening Pattern
📌 Symbol/Asset: IDEA
🔍 Description: Stock is making Broadening pattern and we can see resistance around 20-22 levels.
In history stock has corrected 50% from the rise so will this time we will see correction of 50% or more ??
23 is crucial resistance level and if stock not able to breakout then we might see good fall.
👉 Disclosure: We are not SEBI registered analysts, this is not a buy or sell recommendation.

IDEA : Best trading opportunity in penny stock Exciting Bullish Pattern Alert! 🐂
📊 Pattern: Flag & Pole
📌 Symbol/Asset: IDEA
🔍 Description: Stock has continuosly making patterns. And all are bullish patterns
Stock has just given breakout of Flag & Pole and now it has retested the same levels.
We can see huge momentum if 13.50 levels is not broken.
👉 Disclosure: We are not SEBI registered analysts, this is not a buy or sell recommendation.

#IDEA long trade idea setup (27/11/23)Greetings Folks,
today I have prepared a setup of NSE:IDEA on NSE
the analysis is as follows-
- the price is in retracing mode
- having retraced more than 50% , price is ready to start moving up again
- i am using the support below for entry not the current range support because the price has some imbalance to be filled and just to be on safer side
don't play with fire, always use a predefined stoploss

Vodafone IdeaSeems bullish with 16% left for 1:2 RR ratio. Despite Poor fundamentals and 100% overvalued. Do you agree?

#IDEA LONG TRADE IDEA SETUPGreetings Folks,
today I have prepared a setup of IDEA on NSE
the analysis is as follows-
- The price is on a good bullish trend
- The price is making a famous triangle pattern
- wait for breakout with good volume, if breaks down then wait for price to settle on the support below
don't play with fire, always use a predefined stoploss

#IDEA SHORT TRADE IDEA SETUP Greetings Folks,
today I have prepared a setup of IDEA on NSE
the analysis is as follows-
- The price has been on a good uptrend, now in my opinion i think price has to retrace to recharge its momentum
- i have marked the nearest support zone for price to settle, but just for safety i have marked another support zone below
- be very cautious if you want to counter trade the trend
don't play with fire, always use a predefined stoploss

#IDEA LONGTERM LONG TRADE SETUPGreetings Folks,
today i have prepared a setup of IDEA on NSE
the analysis is as follows-
- The price structure is very optimal for swing trade right now
- price is trying break the static resistance which has been tested before
- if it breaks it with good strength, we can look for buys at minor retracements at lower time frame
don't play with fire, always use a predefined stoploss
