Good Support Spotted In Lux Industries LtdLux Industries Ltd is trading near Long-Term Support and Law Of Polarity (LOP). It can undergo any pattern in coming time say triangle, double bottom, wedge or v shape recovery.
Highest volume activity near this zone, RSI is around a small support.
One can have a first mover advantage investing around current level. Stock might see max downside till 1150 in case of market volatility or on some bad news.
Volume Indicator

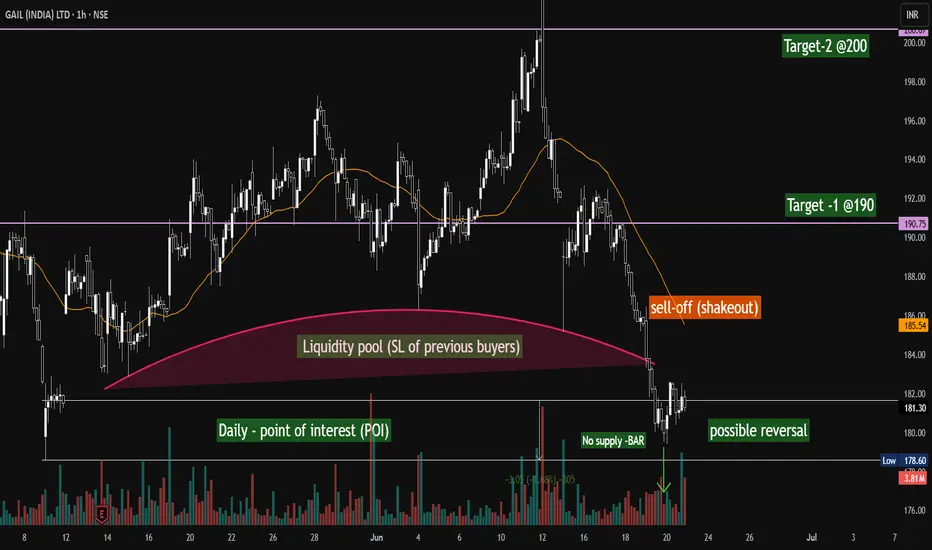
GAIL (INDIA) - Possible Reversal on the corner...GAIL (India) Ltd – 1H Chart Analysis (NSE) | June 21, 2025
Spotted a potential setup with key institutional footprints on the 1H chart:
🟥 Liquidity Pool Grab: Price dipped into the liquidity zone (SL sweep of previous buyers), potentially clearing weak hands.
📉 Shakeout Sell-Off: A sharp decline hints at a textbook shakeout—classic Wyckoff-style distribution at work.
✅ Daily POI + No Supply Bar: Price tapped into a higher timeframe (Daily) Point of Interest, accompanied by a low-volume no-supply bar—suggesting buyer strength.
🔁 Possible Reversal Brewing: Early signs of bullish intent emerging. Watching this zone for confirmation.
🎯 Targets in Sight:
Target 1: ₹190
Target 2: ₹200
Patience pays !!! —waiting for a break of structure and strength to follow through.
ALL TIME HIGH BREAKOUTEclerx services LTD has given breakout of all time high with good volume on both daily and weekly timeframe.

KOPRAN 12 MONTH LONG CONSOLIDATION BREAKOUT Kopran Ltd. is an interesting consolidation breakout stock
1. 12 month's Consolidation breakout in the chart
2. RSI on all time frames above 60
3. Price Breakout with huge Volume candles
4. ABCD pattern on weekly chart
5. Major supports with cluster of moving averages in zone of 247 - 273 which can act as multiple support area.
Lets See How it Evolves.
Disclaimer: NOT A BUY / SELL RECOMMENDATION I am not an expert I just share interesting charts here for educational purpose and not to be taken as buy/sell recommendation. Please seek expert opinion before investing and trading as trading/ investing in market is subject to market risks. I do not hold any position in the stock as on date but I may look to buy on dips with my own Risk Reward matrix.

HindalcoHindalco Has Came to important where the Price has Bounce from there three time any close below 425 can weaken the stock
Disclaimer:- I am not SEBI registered Analyst kindly consult your Advisor before taking any trading Decision .

ASHOKLEY : PRICE Action : EV FocusedGOOD price volume action seen
Taking support from Previous trend Line .
Now It is forming a Inverted Head and Shoulder pattern
R: Favourable

ALEMBICLTDALEMBICLTD:- keep on eye at crucial level. short term target 111.45
Hello traders,
As always, simple and neat charts so everyone can understand and not make it too complicated.
rest details mentioned in the chart.
will be posting more such ideas like this. Until that, like share and follow :)
check my other ideas to get to know about all the successful trades based on price action.
Thanks,
Ajay.
keep learning and keep earning.

Wipro: Complete Head And Shoulder pattern Wipro: complete Head and Shoulder pattern
Only for aducation parpose

Dalbharat Long (08 Sep)Dalbharat Long (08 Sep)
RSI-65
Breakout retest with strong volumes
Buy at CMP- 1640
SL- 1560
Target- 1798, 1940
Join us, Learn more, Earn more
Disclaimer- We are not SEBI registered advisor.
Charts and views are only for educational purpose.

Titan Titan Previous Support will be acting as resistance one can short below 2260 sl 2300 tgt 2120
Disclaimer :- I am not SEBI registered Analyst kindly consult your Financial Advisor before taking any financial Decisions .

Abbot India This share is now support area and trade are limit band zone with support and resistance.
And given the all target SL and entry level up and down side. And very High probhility up side zone trading area. If cross than 21 EMA

Gland showing strength Gland looks like is moving towards 3750 soon
has given a long term trend-line breakout
after making multiple support at around 3200
Stay tuned for another rally


SPANDANA - breakout with volumesTrendline breakout
a close above 400 can take it to 445 very qiuckly
stay tuned
high volumes
and really good valuation stock

VEDL offers good Upside in Medium TermPrice is nearing its 52 weeks high with 7.1x above-average weekly deliveries.
With ARS & SRS Positive during almost 10% correction, VEDL could be a good Medium Term bet.

TRIVENI Giving Move !Stock is in uptrend.
Giving a all time high breakout with good volumes.
Formed a Cup and Handle Pattern and giving breakout.
Go Long if Stock Sustain above 212 or can go long after retest from the same level.
Trail your SL for good gains.
Also Please do your own analysis before buying.

PNB volume increasing with increase in pricePNB was bearish on weekly chart now formed higher low higher high on weekly chart, also
PSU index is also going bullish could be good positional trade.

zinc short term bearish . breaking the trend line
sell trade for intraday - entry at 242 to 240 range

Mahindra & Mahindra good buy above 815
M&M testing its resistance multiple times.
Volumes have been increasing since the 12th of April.
Good buy above 815 level.


Himatsingka: Power of Patterns and Volume confirmation.NSE:HIMATSEIDE
(1) Volume profile: Accumulation phase is running.. between 59.05 to 66.90 Levels And P.O.C. is standing at 62.70
(2) Rectangle Pattern range: 42.90 to 70
(3) Average high volume above trading.
(4) Previous swing high was 70
(5) RSI entered into overbought zone today i.e 22/06/2020. It indicates bulls are active.
Trade Set Up:
Bullish Breakout above 70
Target : 97.05
Stop Loss : 59 (Under P.O.C.)
Risk is yours and Reward is too yours totally.


Bajaj Consumer trend breakout with VolumeBajaj Conumer coming out of down trend with the volume. Good Bet for Risk Taker as its still in multi year low zone.
