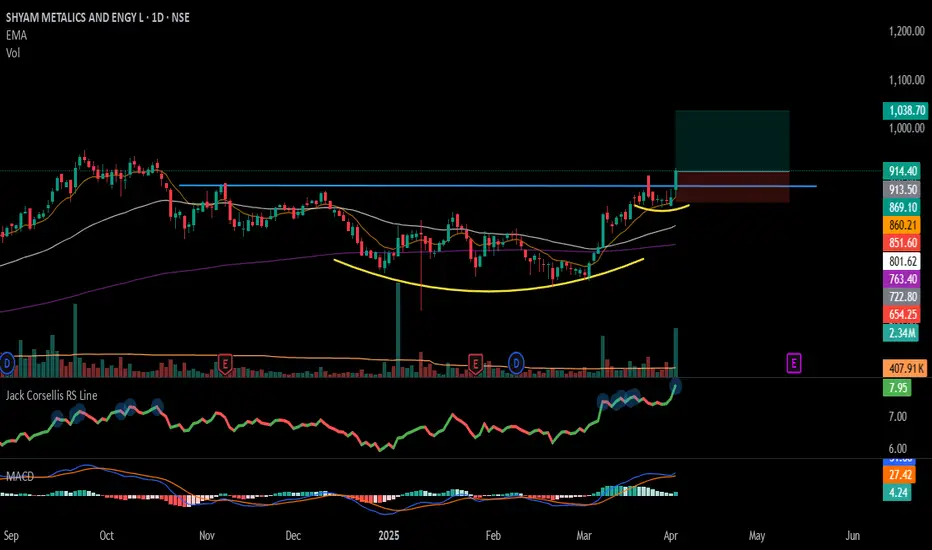
#SHYAMMETL - Cup & Handel Break Out in Daily Time Frame. 📊 Script: SHYAMMETL
Key highlights: 💡⚡
📈 Cup & Handel Break Out in Daily Time Frame.
📈 Price consolidation near Resistance & gave a BO with Volume
📈 Volume spike seen.
📈 MACD Bounce
📈 RS making 52WH
📈 One can go for Swing Trade.
BUY ONLY ABOVE 915 DCB
⏱️ C.M.P 📑💰- 914
🟢 Target 🎯🏆 – 14%
⚠️ Stoploss ☠️🚫 – 7%
️⚠️ Important: Market conditions are getting better, Position size 50% per Trade. Protect Capital Always
⚠️ Important: Always Exit the trade before any Event.
⚠️ Important: Always maintain your Risk:Reward Ratio as 1:2, with this RR, you only need a 33% win rate to Breakeven.
✅Like and follow to never miss a new idea!✅
Disclaimer: I am not SEBI Registered Advisor. My posts are purely for training and educational purposes.
Eat🍜 Sleep😴 TradingView📈 Repeat 🔁
Happy learning with MMT. Cheers!🥂
VOLUMEBREAKOUT
#SARDAEN VCP Formation in DTF - Keep In WL 📊 Script: SARDAEN
Key highlights: 💡⚡
📈 VCP BreakOut in Daily chart.
📈 Price gave a good up move and consolidated before BO.
📈 Volume spike on Breakout
📈 MACD Cross Over
📈 One can go for Swing Trade.
BUY ONLY ABOVE 511 DCB
⏱️ C.M.P 📑💰- 506
🟢 Target 🎯🏆 – 20%
⚠️ Stoploss ☠️🚫 – 108
️⚠️ Important: Market conditions are not great, Paper Trade Only. Protect Capital Always
⚠️ Important: Always Exit the trade before any Event.
⚠️ Important: Always maintain your Risk & Reward Ratio.
✅Like and follow to never miss a new idea!✅
Disclaimer: I am not SEBI Registered Advisor. My posts are purely for training and educational purposes.
Eat🍜 Sleep😴 TradingView📈 Repeat 🔁
Happy learning with MMT. Cheers!🥂

#MANAPPURAM - Weekly Time Frame VCP Break Out with Volume📊 Script: MANAPPURAM
Key highlights: 💡⚡
📈 VCP formation in Weekly chart.
📈 Volume Spike seen
📈 Can Enter Breakout on if price sustains
📈 MACD Bullish
📈 RS is Bullish
📈 One can go for Swing Trade.
BUY ONLY ABOVE 240 WCB
⏱️ C.M.P 📑💰- 235
🟢 Target 🎯🏆 – 35%
⚠️ Stoploss ☠️🚫 – 17%
️⚠️ Important: Market conditions are getting better, Position size 50% per Trade. Protect Capital Always
⚠️ Important: Always Exit the trade before any Event.
⚠️ Important: Always maintain your Risk:Reward Ratio as 1:2, with this RR, you only need a 33% win rate to Breakeven.
✅Like and follow to never miss a new idea!✅
Disclaimer: I am not SEBI Registered Advisor. My posts are purely for training and educational purposes.
Eat🍜 Sleep😴 TradingView📈 Repeat 🔁
Happy learning with MMT. Cheers!🥂

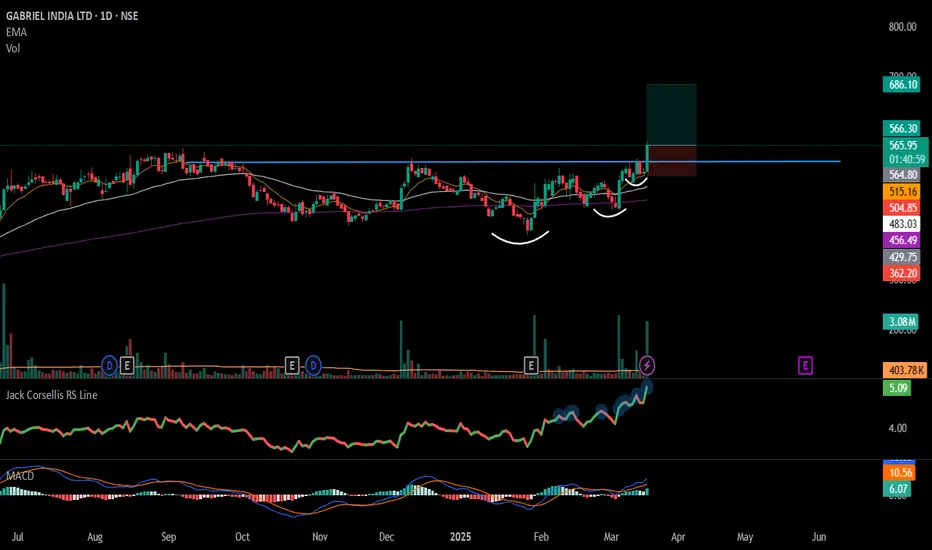
#GABRIEL - VCP Break Out in Daily chart with Volume Spike📊 Script: GABRIEL
Key highlights: 💡⚡
📈 VCP formation in Daily chart.
📈 Price gave a good up move and consolidated.
📈 Volume spike on Breakout
📈 MACD Bounce
📈 RS is making 52WH
📈 One can go for Swing Trade.
BUY ONLY ABOVE 565DCB
⏱️ C.M.P 📑💰- 561
🟢 Target 🎯🏆 – 21%
⚠️ Stoploss ☠️🚫 – 11%
️⚠️ Important: Market conditions are getting better, Position size 25% per Trade. Protect Capital Always
⚠️ Important: Always Exit the trade before any Event.
⚠️ Important: Always maintain your Risk:Reward Ratio as 1:2, with this RR, you only need a 33% win rate to Breakeven.
✅Like and follow to never miss a new idea!✅
Disclaimer: I am not SEBI Registered Advisor. My posts are purely for training and educational purposes.
Eat🍜 Sleep😴 TradingView📈 Repeat 🔁
Happy learning with MMT. Cheers!🥂
This Stock is Bouncing Back from Strong Support, Big Move ahead.Hello everyone , i hope you all will be doing good in your life and your trading as well. Today i have brought an idea on Chennai Petroleum which is Looking fantastic on chart. Let's analyse this and find opportunity for short term to long term.
Looking at the weekly chart of Chennai Petroleum Corp Ltd., the stock has previously made some huge moves — a 277% rally and even a bigger 462% swing . These past moves highlight that the stock has the potential for major price action when the right conditions align. Right now, the stock has found support at an important rising support trendline , which could set the stage for another upward move.
Recently, a bullish engulfing candle with a significant volume spike formed, which is a strong signal for a potential reversal. For those looking to enter, the 570-530 range could be a good spot. The first short-term target is 651 , followed by 750 and a medium-term target of 851 . For those in it for the long haul, the final target could be around 1065 . If the price moves against us, a stop loss at 433 will help manage the risk. Given the stock's history and recent chart formation, we might just see history repeat itself, making this a solid opportunity for both short-term and long-term trades.
Fundamental Ratio:
Market Cap
₹ 8,360 Cr.
Current Price
₹ 561
High / Low
₹ 1,275 / 433
Stock P/E
22.5
Book Value
₹ 518
Dividend Yield
9.80 %
ROCE
35.1 %
ROE
35.9 %
Face Value
₹ 10.0
Industry PE
20.3
Debt
₹ 6,114 Cr.
EPS
₹ 25.0
Promoter holding
67.3 %
Intrinsic Value
₹ 482
Return over 5years
53.6 %
Debt to equity
0.79
Net profit
₹ 372 Cr.
Disclaimer:- This analysis is for educational purposes only. Please trade responsibly and consult a financial advisor before making any decisions.
If you found this analysis helpful, don’t forget to like, follow, and share your thoughts in the comments below! Your support keeps me motivated to share more insights. Let’s grow and learn together—happy trading!

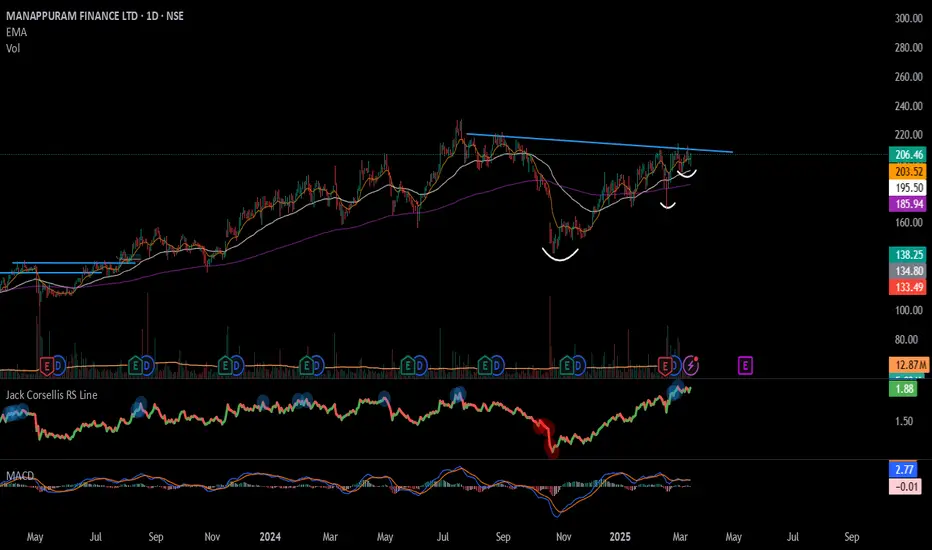
#MANAPPURAM - Potential BO / Keep in Radar/ March25📊 Script: MANAPPURAM
Key highlights: 💡⚡
📈 VCP formation in Daily chart.
📈 Price gave a good up move and went into consolidation.
📈 Wait for Volume spike on Breakout.
📈 Wait for BO with Volume
📈 One can go for Swing Trade.
BUY ONLY ABOVE 215 DCB
⏱️ C.M.P 📑💰- 206
🟢 Target 🎯🏆 – NA%
⚠️ Stoploss ☠️🚫 – NA%
️⚠️ Important: Market conditions are not great, Paper Trade Only. Protect Capital Always
⚠️ Important: Always Exit the trade before any Event.
⚠️ Important: Always maintain your Risk & Reward Ratio.
✅Like and follow to never miss a new idea!✅
Disclaimer: I am not SEBI Registered Advisor. My posts are purely for training and educational purposes.
Eat🍜 Sleep😴 TradingView📈 Repeat 🔁
Happy learning with MMT. Cheers!🥂
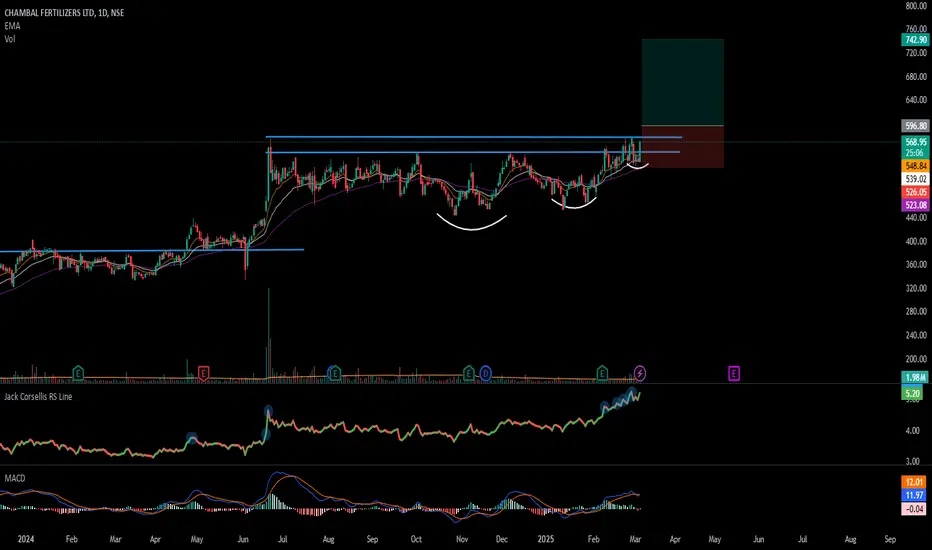
#CHAMBLFERT – VCP Pattern Forming! Keep It on Your Radar! 📊 Script: CHAMBLFERT
Key highlights: 💡⚡
📈 VCP in DTF
📈 Wait BO with Volume in DTF
📈 Wait for consolidation
📈 MACD needs to give a Bounce
📈 Price consolidated for 258 days
📈 One can go for Swing Trade
⚠️ Over All Market condition is bad, Practice paper trading
🟢 If you have any questions regarding the setup, please feel free to leave your inquiries in the comments, and I will respond promptly.
BUY ONLY ABOVE 596 DCB
⏱️ C.M.P 📑💰- 562
🟢 Target 🎯🏆 – 20%
⚠️ Stoploss ☠️🚫 – 10%
⚠️ Important: Always Exit the trade before any Event.
⚠️ Important: Always maintain your Risk & Reward Ratio.
✅#Boost, #Like & #Follow to never miss a new idea! ✅
Disclaimer: I am not SEBI Registered Advisor. My posts are purely for training and educational purposes.
Eat🍜 Sleep😴 TradingView📈 Repeat 🔁 – MMT
Happy learning with MMT. Cheers!🥂
AVANTI FEEDS - VCP Pattern Breakout Watchlist 📈 AVANTI FEEDS - VCP Pattern Breakout Watchlist 🔥
Formation: VCP (Volatility Contraction Pattern)
Today's Action: Forming a Wide Range Candle with rising volume 📊
Key Level: If closes above ₹797, can consider adding a small quantity ✅
Technical Strength: Trading above 50 & 200 DMA 📈
Support Levels: Marked below for reference
Volume: Picking up, indicating accumulation by smart money 💰
💡 Why Add to Watchlist?
✅ Wide Range Candles forming as price moves up with volume 🔥
✅ Sector Showing Strength – Group movements seen in similar stocks 🚀
✅ Accumulation Signs – Strong hands likely entering 📊
⚠️ Market Condition:
The market is weak & unstable 📉, so this is just an alert to keep on your radar. Once the market stabilizes, such setups tend to move well. Don't go all in—watch and buy in small quantities only.
📌 Action Plan:
👉 Keep on Watchlist 👀
👉 Wait for a strong close above ₹797
👉 Gradual accumulation, not aggressive buying
🔎 Do Your Homework in a Bear Market! 🧐
Stocks like this don’t just appear—they are selected based on patterns, volume action, and sector strength 📈
Bear markets separate smart investors from the crowd—use this time to analyze & learn 🧠
Bull markets don’t give time to learn—by then, prices move too fast! 🚀
In a bull market, mistakes are forgiven. In a bear market, even small mistakes can hurt 😓
📢 Final Thought:
📚 Bear markets are for learning.
💎 Bull markets reward those who prepared.
🚀 Stay ahead, do your research, and execute with discipline!
📢 Disclaimer: This is not financial advice. Do your own research before taking any trade. Risk management is key! 🚨

Volume breakout vs Cluster of Volumes concept for your edgeI make educational content videos for swing / positional trading

#CHOLAFIN - VCP / C&H BO in DTF📊 Script: CHOLAFIN
Key highlights: 💡⚡
📈 VCP in DTF
📈 BO with Volume
📈 MACD gave a Bounce
📈 Price consolidated for 85Days
📈 One can go for Swing Trade
⚠️ Over All Market condition is bad, Practice paper trading
🟢 If you have any questions regarding the setup, please feel free to leave your inquiries in the comments, and I will respond promptly.
BUY ONLY ABOVE 1435 DCB
⏱️ C.M.P 📑💰- 1433
🟢 Target 🎯🏆 – 6%
⚠️ Stoploss ☠️🚫 – 2.90%
⚠️ Important: Always Exit the trade before any Event.
⚠️ Important: Always maintain your Risk & Reward Ratio.
✅#Boost, #Like & #Follow to never miss a new idea! ✅
Disclaimer: I am not SEBI Registered Advisor. My posts are purely for training and educational purposes.
Eat🍜 Sleep😴 TradingView📈 Repeat 🔁
Happy learning with MMT. Cheers!🥂

#INDIANHUME - Reversal Pattern (W Bottom Pattern)📊 Script: INDIANHUME
Key highlights: 💡⚡
📈 W Bottom Pattern at Demand Zone
📈 Deman Zone tested
📈 W Bottom Pattern BO in DTF
📈 Volume Spike Seen
📈 MACD can give a Bounce
📈 Price consolidated for 31Days
📈 One can go for Swing Trade
⚠️ Over All Market condition is bad, Practice paper trading
🟢 If you have any questions regarding the setup, please feel free to leave your inquiries in the comments, and I will respond promptly.
BUY ONLY ABOVE NA DCB
⏱️ C.M.P 📑💰- 373
🟢 Target 🎯🏆 – NA%
⚠️ Stoploss ☠️🚫 – Below Swing Low%
⚠️ Important: Always Exit the trade before any Event.
⚠️ Important: Always maintain your Risk & Reward Ratio.
✅#Boost, #Like & #Follow to never miss a new idea! ✅
Disclaimer: I am not SEBI Registered Advisor. My posts are purely for training and educational purposes.
Eat🍜 Sleep😴 TradingView📈 Repeat 🔁
Happy learning with MMT. Cheers!🥂

SBICARD: Monthly Pennant Breakout - How High Can It Fly?NSE:SBICARD
The stock has given a pennant pattern breakout on monthly chart with good volume along with second month on consecutive buying
This month's closing would be interesting to watch as it'd confirm the follow on move
916.95 / 946 / 1149 will act as strong resistance levels especially 1149 which is around it's ATH level a monthly close above it will fuel the further rally.
Since it's ATH in September 2021 stock has been in a downtrend but seems like things are about to change for good
SBI Cards & Payment Services is India's second-largest credit card issuer and a subsidiary of SBI.
Market Position :
SBI Cards is a leader in the credit card industry, holding an 18.5% market share in card-in-force and a 15.7% share in spending. You'll find them actively expanding into Tier-2 and Tier-3 cities to tap into new markets. Plus, partnerships with brands like Apple and Singapore Airlines help them attract premium customers.
Recent Financials (Q3 FY25):
Revenue: ₹4,767 crore (up 1% YoY).
Net Profit: ₹383 crore (down 30% YoY).
Net Interest Income (NII): ₹3,790 crore (down 3.5% YoY).
Asset Quality: Gross NPA at 3.24%, Net NPA at 1.18%.
9-Month Performance (9MFY25):
Revenue: ₹14,300 crore (up ~2% YoY).
Net Profit: ₹1,200 crore (down ~25% YoY).
Where is SBI Cards Headed?
Management is optimistic, projecting annual revenue growth of 10%-15% over the next two years. The plan involves:
Tapping into smaller cities to bring in new customers.
Boosting the digital experience for seamless customer interactions.
Launching exciting co-branded cards aimed at high-value users.
And don't forget, potential RBI rate cuts in FY26 could lower borrowing costs and boost the bottom line.

SYRMA: Potential for 15-20% GrowthThe chart provides delineates critical price thresholds that signify breakout points, along with specific support levels that serve as indicators of where buying interest may manifest.
Additionally, the chart highlights regions likely to act as ceiling points for future price ascensions, allowing for informed decisions on entry and exit strategies.
Disclaimer: The information contained in this technical analysis report is intended solely for informational and educational purposes. It should not be interpreted as financial advice or a recommendation to buy or sell any security. Investors are strongly encouraged to conduct their own research and consult with a qualified financial advisor before making any investment decisions.

MAN INFRA: potential upside move<Man infra has successfully given breakout of two good chart patterns.
<Flag and pole which is clearly visible.
<Triangle pattern which can be seen if we draw a line from top red candle to the <breakout candle respecting all the wicks.
<We are learning this trade respecting the flag pattern.
<The stock has given upside breakout with good volume indicating bulls hold.
<The risk reward ratio for the trade is 1:5.

Prataap Snacks Ltd. BreakoutPrataap Snacks Ltd. Breakout closing above 1171.
CMP 1171. Expected level of 1400.
Momentum is strong, needs volume to support the move. Keep strict SL as per your risk plan.

HEUBACHINDHEUBACHIND is trying to come out of long consolidation zone of almost a quarter with decent volume. Already above R-1 around 555 and trying to go above R-2 around 573. If successfully close above R-2 then there is v high probability that it can do wonder! Keep it in yr watchlist.

PRAJINDPRAJIND has given inverted H&S pattern breakout. It is trading continously higher despite market correction. Market participation is also increased. It is trading nr ATH. Keep it in watchlist.

GARUDAGARUDA showing very good strength 1st time in last 5 sessions since listing. Market participation also increased. 110 is new support area. So as long as its above 110 level, it may continue momentum ride from hereon.

NIACLNIACL giving resistance breakout with increased market participation. I have observed strong momentum in insurance sector. It seems momentum may continue. Keep it on radar

Rudrabhishek Enterp Ltd (REPL) Breakout with Huge Volume⚠️Risky Bet.
1. Early Entry above 264. SL 215. A retest of 240 levels is possible. Any signs of retest and reversal are an entry opportunity. Retest Level. 240
Or
2. Wait for a fresh breakout above 282 for an entry. SL Below the breakout candle.
These are my views and my way of doing things. Please do your due diligence and research. Do not jump into a trade with a huge allocation based on Tips.
Reasons to go Long:
✅Huge Volume 4x volume compared to previous
sessions.
✅Wide Range clean candle
✅Broke out of Darvas Box
✅Trading right below a 3-year-old resistance. Hence
the early entry.
✅Technically Good.
❗️Microcap/Small cap company.
❗️Fundamentally Weak.

Kovai Medical: at Long Consolidation BreakoutKovai Medical: at Long Consolidation Breakout with strong momentum supported with volumes from strong support zone in daily timeframe. CMP 5839.

flag and pole pattern breakoutStyrenix performance ltd has formed and successfully broke the pattern.
The breakout in the pattern can be seen with rising volumes which indicates strong buyers hold.
Along with short and medium term, long term momentum is also strong according to indicators. Positions could be made with minimum expectation of 1:3 R:R.

Lumax Auto Tech - Long Consolidation BreakoutLumax Auto Tech.: at Long Consolidation Breakout. CMP 597. Momentum is strong supported with volumes. Expected levels of 700.
