Force Motors (W): Aggressive Bullish (Earnings based BO attempt)(Timeframe: Weekly | Scale: Logarithmic)
The stock is challenging its "Blue Sky" zone after delivering a blowout earnings performance. While it faced intraday rejection at ₹22,200 (profit booking on news), the massive volume and 252% profit growth suggest that this resistance will likely be taken out soon.
🚀 1. The Fundamental Catalyst (The "Why")
The technical surge is fully supported by the Q3 FY26 numbers released this week:
> Profit Explosion: Net Profit jumped 252% YoY to ₹406 Crore , significantly beating estimates.
> Operational Growth: Revenue grew 12.6% , and the company showed resilience in margins.
> Expansion News: The board approved acquiring Veera Tanneries for ₹175 Cr, which the market views as a strategic move to secure land for future capacity expansion.
📈 2. The Chart Structure (The Box Breakout)
> The Box: The ₹14,980 – ₹22,200 range. This 7-month consolidation allowed the stock valuations to catch up with earnings.
> The Breakout Attempt: The stock spiked to ₹22,200 but failed to close above it.
- Interpretation: The long upper wick on the weekly candle indicates "Supply at ATH." Traders who bought the rumor sold the news. However, the body of the candle remains strong green, meaning the trend is still up.
📊 3. Volume & Indicators
> Volume Ignition: The volume of ~740K is an "Institutional Stamp." This is significantly higher than the average weekly volume, confirming that big funds are entering on the earnings beat.
> RSI: Rising in all timeframes. The Weekly RSI is entering the "Super Bullish" zone (60-80), which supports a trend continuation.
🎯 4. Future Scenarios & Key Levels
The stock is in "Price Discovery" mode, fighting the final resistance.
🐂 Bullish Target (Blue Sky):
- Trigger: A decisive Daily Close above ₹22,200 .
- Target 1: ₹27,380
- Target 2: ₹29,420.
🛡️ Support (The "Must Hold"):
- Immediate Support: ₹19,500 – ₹20,000. The "Psychological Round Number" and recent breakout base.
- Stop Loss: A weekly close below ₹18,152 would invalidate the bullish view and signal a return to the sideways range.
Conclusion
This is a Grade A+ Setup .
> Refinement: The "wick" at 22,200 is temporary supply. The 252% Profit Growth acts as a fundamental floor.
> Strategy: Buy on dip opportunity.
Volumespike

Power Grid (D): Aggressive Bullish (Guidance-Backed Breakout)(Timeframe: Daily | Scale: Linear)
The stock has staged a violent recovery from its long-term support zone of ₹250. This is not just a technical bounce; it is a Fundamental Re-rating driven by the Capex hike and strong Q3 numbers.
🚀 1. The Fundamental Catalyst (The "Why")
The technical breakout is fueled by three major factors:
> Capex Upgrade: The management raised its FY26 capital expenditure guidance to ₹32,000 Crore (up from ₹28,000 Cr). Higher capex implies higher future asset capitalization, which directly boosts regulated returns (RoE).
> Q3 Earnings: The company reported an 8% YoY jump in Net Profit (₹4,185 Cr) and declared a second interim dividend of ₹3.25/share .
> Sector Tailwind: The Power sector is rallying post-Budget expectations, and Power Grid is the primary beneficiary of transmission grid expansion.
📈 2. The Chart Structure (The Double Bottom)
> The Support: The ₹251 – ₹254 level.
- Significance: The stock took support here in Feb-Mar 2025 and again in Jan 2026. This formation creates a classic "Double Bottom" on the weekly/daily charts.
📊 3. Volume & Indicators
> Volume Ignition: The 37 Million volume is an "Institutional Stamp." It confirms that "Smart Money" is entering to ride the upgraded growth guidance.
> RSI: Rising in all timeframes. The Daily RSI is about to break above 60 with such volume indicates the start of a new "Markup Phase."
Conclusion
Look out for the price action in the coming days

Kitex (W): Aggressive Bullish, Political Catalyst + Tech Rev(Timeframe: Weekly | Scale: Logarithmic)
The stock has staged a V-Shape Reversal from a fresh 52-week low, forming a textbook Bullish Hammer on the weekly chart. This technical move is powered by a major political development (joining NDA), which removes significant "Political Risk" from the stock valuation.
🚀 1. The Fundamental Catalyst (The "Why")
The technical bounce is driven by a sentiment shift:
> Political Alignment (NDA Entry): The market expects that joining the ruling alliance will fast-track the company’s massive expansion plans in Telangana and reduce friction in its home state of Kerala.
> Valuation Comfort: At ₹138 (the low), the stock was trading at attractive valuations, prompting value buying in the textile sector which is seeing a revival.
📈 2. The Chart Structure (The Bear Trap)
> The Support: ₹147 the support.
- Refinement: The price momentarily broke this support to hit ₹138.20 (on Jan 21), triggering stop-losses, before skyrocketing back up. This indicates a "Bear Trap" or "Spring" formation, where smart money buys the panic selling.
> The Pattern: The Weekly Hammer has a very long lower shadow, indicating that sellers pushed price down, but buyers overwhelmed them to close the week near the high.
📊 3. Volume & Indicators
> Volume Spike: The 12.43 Million volume is an "Ignition Bar." It is significantly higher than the 10-week average.
> RSI: RSI reversing from the "Oversold" zone (below 30 on daily, rising on weekly) is a classic momentum divergence signal.
🎯 4. Future Scenarios & Key Levels
The stock has cleared the "Panic Bottom."
🐂 Bullish Targets (The Recovery):
- Target 1: ₹200. .
- Target 2: ₹295 - ₹298.
- Blue Sky: If the political tailwinds persist, a breakout above ₹324 (ATH) is possible in the long term.
🛡️ Support (The "Line in the Sand"):
- Immediate Support: ₹147 – ₹150. The previous support level is now reclaimed.
- Stop Loss: A close below ₹135 (below the Hammer's wick) would invalidate the reversal.
Conclusion
This is a High-Conviction Turnaround.
> Refinement: The "Hammer" is valid, but the Fundamental News (NDA) is what makes this a sustainable trend rather than a dead-cat bounce.
> Strategy: The reversal is confirmed. Use dips to accumulate.

Jindal Steel (W): Cautiously Bullish (Breakout Rejection)(Timeframe: Weekly | Scale: Logarithmic)
The stock attempted a major breakout from its 2-year consolidation but faced a classic "Shooting Star" / Rejection at the All-Time High. While the trend is up, the inability to close above ₹1,085 signals that the "Smart Money" is booking profits ahead of the Jan 30 earnings.
🚀 1. The Fundamental Catalyst (The "Why")
The price action is dominated by the upcoming event:
> Q3 Earnings (Jan 30): With results just a week away, investors are risk-averse. The stock needs a "Earnings Beat" to justify a price above ₹1,100.
> Sector Strength: The Nifty Metal Index is strong (up ~7% this month), which is why the stock is hugging the resistance rather than crashing.
📈 2. The Chart Structure (The Trap)
> The Box: ₹750 – ₹1,085 consolidation range. This "Time Correction" has been healthy.
> The Fakeout (This Week):
- The Move: The stock spiked to ₹1,104 (New High) but was hammered down to close below ₹1,085 .
- Interpretation: This leaves a long "Upper Wick" on the weekly candle, indicating that bears are still defending this fortress. A "Look Above and Fail" often leads to a short-term pullback.
📊 3. Volume & Indicators
> Volume: The "Above Average" volume on a rejection candle is a warning. It implies that while buyers tried to push up, sellers unloaded heavy quantities (Churning).
> RSI: Rising but showing a potential Negative Divergence on daily frames if price makes a high but RSI doesn't.
🎯 4. Future Scenarios & Key Levels
The trade is now an "Event Play."
🐂 Bullish Breakout (Post-Earnings):
- Trigger: A decisive Weekly Close above ₹1,105 (clearing the new wick).
- Target 1: ₹1,235.
- Target 2: ₹1,350.
🛡️ Support (The "Buy Zone"):
- Immediate Support: ₹980 – ₹1,000 .
- Strategy: If the stock dips to ₹980 before Jan 30, it is a low-risk entry.
- Stop Loss: A close below ₹950 invalidates the bullish structure.
Conclusion
This is a "Wait for Confirmation" Setup .
> Refinement: Do not buy the "intraday breakout." Wait for a Closing Basis breakout above ₹1,105.
> Action: Keep it on the watchlist. The real move will likely happen after Jan 30 results.

Tata Steel (D): Bullish (Sector-Backed Breakout Attempt)Timeframe: Daily | Scale: Linear
The stock is challenging the upper boundary of its 2-year consolidation phase, trading just below the critical ₹187.85 (ATH) resistance. The move is supported by a "Bullish Island" gap and a strong sector-wide rally.
🚀 1. The Fundamental Catalyst (The "Why")
The surge is driven by sectoral strength and operational updates:
> Sector Rally: The Nifty Metal Index rallied ~2% today, acting as a tailwind for Tata Steel.
> Production Update: The market is reacting positively to the recent Q3 FY26 Production Update (released Jan 7), where the company reported steady volumes despite global headwinds, signaling resilience.
📈 2. The Chart Structure (Island & Resistance)
> The "Island" Gap: Pattern formed since Dec 31.
- The Formation: The stock gapped up from ₹175.80 to ₹180 on Dec 31 and has stayed above this gap. This created a "Bullish Breakaway Gap" , leaving the previous consolidation (₹170-175) isolated as an "island" of trapped sellers.
> The Resistance (The "Lid"): The horizontal resistance is specifically the ₹187 – ₹188 zone (The All-Time High / 52-Week High).
- Current Status: Closing at ₹183.30 , the stock is knocking on the door of this final barrier.
📊 3. Volume & Indicators
> Volume Profile: While today's volume (25.78 M) is good, the Dec 31 Volume (50 M+) was the real "Ignition Day." The drying volume during the consolidation (before Dec 31) followed by these spikes confirms accumulation.
> Momentum:
- RSI: Rising in all timeframes, confirming synchronized momentum.
- EMAs: The Positive Crossover (PCO) aligns with the "Island" gap, confirming the trend is up.
🎯 4. Future Scenarios & Key Levels
The stock is primed for a "Blue Sky" breakout.
🐂 Bullish Target (Blue Sky):
- Trigger: A decisive Daily Close above ₹188 .
- Target 1: ₹212 .
- Target 2: ₹225 . (Psychological level).
🛡️ Support (The Safety Net):
- Immediate Support: ₹177 – ₹180 . The "Gap Zone" from Dec 31. The stock must stay above ₹180 to keep the "Island" valid.
- Stop Loss: A close below ₹175 would "fill the gap" and invalidate the bullish momentum.
Conclusion
This is a High-Quality Setup .
> Refinement: The "Island Gap" at ₹180 is the new floor.
> Strategy: The breakout is imminent. Watch for a high-volume close above ₹188 to confirm the run to ₹212 .

IIFL Capital (W): Aggressive Bullish (Re-rating Breakout)Timeframe: Weekly | Scale: Logarithmic
The stock has confirmed a major breakout from an 8-month consolidation pattern. This move is not just a technical fluctuation; it represents a structural "Re-rating" of the business following its pivot from pure broking to broader capital services.
🚀 1. The Fundamental Catalyst (The "Why")
The surge is driven by a convergence of business transformation and sector strength:
> Strategic Rebranding: The name change to "Capital Services" signals a shift towards high-margin Wealth Management and Distribution. The market is finally pricing in this higher valuation multiple, which explains the sudden volume spike.
> Sector Tailwind: The entire capital market ecosystem (BSE, CDSL, Angel One) has been rallying in Dec 2025/Jan 2026 due to renewed retail participation, providing a "Sectoral Lift" to the stock.
📈 2. The Chart Structure (The Box Breakout)
> The Setup: A Rectangular Pattern (Sideways Trend) that trapped the stock between May 2025 and last week.
> Resistance: The confluence of the Angular Resistance (from the Oct 2024 ATH) and the Horizontal Box Top was a formidable barrier.
> The Breakout: This week’s surge of 16.17% is a decisive "Marubozu-style" candle . It smashed through both resistance layers in a single move, confirming that the correction from Apr 2025 is officially over.
📊 3. Volume & Indicators
> Volume Ignition: The 9.61 Million weekly volume is an "Institutional Stamp." Such high volume after a quiet consolidation indicates that large funds are entering to ride the new leg up.
> Momentum:
- RSI: Rising in Monthly & Weekly timeframes confirms that momentum is synchronized with price.
- EMAs: The Positive Crossover confirms the trend has shifted from "Sideways" to "Markup."
🎯 4. Future Scenarios & Key Levels
The stock is now in a "Markup Phase" heading toward its previous peaks.
> 🐂 Bullish Targets (The Recovery):
- Target 1: 425. This is a major structural hurdle.
- Target 2: 449 (ATH) . Once 425 is cleared, the path to the All-Time High of 448.95 (Oct 2024) is technically open.
> 🛡️ Support (The "Must Hold"):
- Immediate Support: 352 . This is the breakout zone. The "Polarity Principle" dictates that this previous ceiling must now act as a floor.
- Stop Loss: A weekly close below 340 would imply the breakout was a "Bull Trap" and invalidation of the setup.
Conclusion
This is a Grade A Setup .
> Confirmation: The combination of High Volume + Pattern Breakout + Fundamental Rebranding makes this a high-probability trade.
> Strategy: Use dips to the 352-360 zone to enter/add, targeting 425 and eventually the ATH of 449 .

KPI Green (D): Aggressive Bullish, Promoter-Backed MomentumTimeframe: Daily | Scale: Linear
The stock is staging a violent recovery from the bottom of a Symmetrical Triangle. While it has surged +26% in two days, it is currently testing the critical angular resistance . The move is backed by "Insider Buying," which gives it high structural conviction.
🚀 1. The Fundamental Catalyst (The "Why")
The volume explosion is driven by two major factors:
> Promoter Buying: Reports confirm that Quyosh Energia (Promoter Group) purchased shares (approx. 11.2 Lakh shares) via bulk deals. When promoters buy at market prices, it signals they believe the stock is undervalued.
> SJVN Order: The recent execution of the 200MW Solar Project agreement with SJVN (worth ~₹696 Cr) has improved revenue visibility for 2026.
📈 2. The Chart Structure (The Triangle)
> The Setup: The stock has been consolidating in a Symmetrical Triangle since the ATH.
- Support: The bounce from ₹313 (and the recent higher low) was the launchpad.
- Resistance: The stock is now "Kissing" the downward-sloping trendline (around ₹510–₹515 levels).
> Current Status: Despite the +26% move, a daily close above this angular trendline is needed to confirm the end of the correction.
📊 3. Volume & Indicators
> Volume Spike: The volume of 77M+ (combined sessions/exchanges) is an "Institutional Stamp." This is not retail accumulation; this is big money entering.
> RSI: Rising sharply. Note that daily RSI is entering "Overbought" territory (>70) due to the sudden surge. In strong momentum trends (like Power/Energy), RSI can stay overbought for weeks.
🎯 4. Future Scenarios & Key Levels
The stock is at the "Make or Break" point at the trendline.
> 🐂 Bullish Breakout (The Continuation):
- Trigger: A decisive Daily Close above ₹515 .
- Target: ₹581 .
- Blue Sky: If ₹581 clears, the path opens to retest the ATH ( ₹743 adjusted/unadjusted depending on chart).
> 🛡️ Support (The "Pullback"):
- Immediate Support: ₹479 . Since the stock rose +26% in 2 days, a cooling-off pullback to ₹479 is healthy and should be used to add.
- Stop Loss: A close below ₹450 (mid-point of the surge candle) would signal that the momentum was a "flash in the pan."
Conclusion
This is a High-Octane Setup .
> Refinement: The Promoter Buying makes this a "Buy on Dips" candidate rather than a "Sell on Resistance" one.
> Strategy: Watch for the ₹515 breakout. If it clears, the momentum will likely carry it swiftly to ₹580 .

Jindal Stainless (D): Strongly Bullish - Sector-Backed BreakoutTimeframe: Daily | Scale: Linear
The stock has confirmed a major "Blue Sky" breakout, clearing a confluence of resistance levels (Angular + Horizontal) to hit a new All-Time High. This move is powered by a sector-wide rally and strong institutional volume.
🚀 1. The Fundamental Catalyst (The "Why")
The breakout is fueled by a convergence of positive factors:
> Sector Rally: The Nifty Metal index is surging, lifting all ferrous metal stocks. When a stock breaks out with its sector, the probability of success increases significantly.
> Strong Earnings Support: The company’s Q2 FY26 results provided the fundamental floor, and the market is now pricing in future growth from its capacity expansion plans (targeting 4.2 MTPA).
📈 2. The Chart Structure (The "Coil" bursts)
> The Squeeze: The tight sideways trend below the angular resistance. This "Coiling" action (low volatility + drying volume) indicated that sellers were exhausted.
> The Breakout: Today's surge of 5.14% smashed through the ₹825–₹830 supply zone.
- Significance: By closing at a new ATH ( ₹848.05 ), the stock has no overhead supply (resistance) left. It is now in "Price Discovery" mode.
> Volume: The 2.77 Million volume is an "Ignition Bar." It confirms that "Smart Money" has initiated a new markup phase.
📊 3. Technical Indicators
> EMAs: The Positive Crossover (PCO) on Short-term EMAs confirms the immediate trend is vertical.
> RSI: Rising RSI across all timeframes (Monthly/Weekly/Daily) signals synchronized momentum. An RSI above 60 in a breakout is a sign of strength, not an overbought signal.
🎯 4. Future Scenarios & Key Levels
The stock is primed for a "Blue Sky" run.
> 🐂 Bullish Target (Blue Sky):
- Target 1: ₹960 .
- Strategy: Since the stock is at an ATH, use a Trailing Stop Loss (e.g., 20-day EMA) to ride the trend as far as it goes.
> 🛡️ Support (The "Must Hold"):
- Immediate Support: ₹790 – ₹800 . The previous resistance zone should now act as a rock-solid floor (Polarity Principle).
- Stop Loss: A close below ₹776 would act as a structural failure, invalidating the breakout.
Conclusion
This is a Grade A Setup .
> Refinement: The "Low Volume" during the sideways phase followed by "High Volume" on the breakout is the perfect recipe for a sustainable move.
> Action: The breakout is confirmed. The dip to ₹820-830 (if it happens) is a buying opportunity.

RACL Geartech cmp 1169.20 by Daily Chart view since listedRACL Geartech cmp 1169.20 by Daily Chart view since listed
- Support Zone 1050 to 1125 Price Band
- Resistance Zone 1195 to 1245 >>> ATH 1347.80
- Volumes have spiked very heavily over past 2 days
- Strong Bullish Bottom formed around the Support Zone
- Resistance Zone Breakout attempts in the making process
- Falling and Rising Price Channels repeated since day of listing
- Majority of the Technical Indicators showing positive momentum

Karur Vysya Bank (W): Strongly Bullish - Blue Sky BreakoutTimeframe: Weekly | Scale: Logarithmic
The stock has confirmed a "Blue Sky" breakout to a new All-Time High, clearing a multi-week consolidation pattern. This move is backed by massive institutional buying volume on Friday, signaling the start of a new markup phase.
🚀 1. The Fundamental Catalyst (The "Why")
The technical breakout is driven by strong fundamental re-rating:
> Institutional Buying: Friday's massive volume (15M+ shares in one day) suggests a large fund entry. Investors are rewarding the bank for its superior Asset Quality (Net NPA at ~0.19%, one of the lowest in the industry).
> Midcap Bank Rally: Capital is rotating from large private banks into efficiently managed midcap banks like KVB, which are delivering consistent 20%+ earnings growth.
📈 2. The Chart Structure (Flag & Pole)
> The Pole: The sharp rally from ₹200 to ₹258 (Oct–Nov) formed the "Pole."
> The Flag: The consolidation between ₹242 – ₹255 over the last 4 weeks formed the "Flag." This was a healthy pause to digest gains.
> The Breakout: This week, the stock surged 4.13% , decisively closing above the flag resistance.
- Significance: A Flag breakout in an existing uptrend is a high-probability continuation pattern.
📊 3. Volume & Indicators
> Volume Concentration: The volume wasn't just "increasing"—it exploded on the breakout day (Dec 26). This is Demand Dominance .
> RSI: Rising in Monthly/Weekly frames. Currently near 70 , which is not "overbought" in a strong trend but rather indicates a "Super Bullish" zone.
🎯 4. Future Scenarios & Key Levels
> 🐂 Bullish Targets (The Projection):
- Target 1: ₹310 .
- Target 2: ₹328 .
- Blue Sky: Since it is at an ATH, there is no overhead supply (resistance).
> 🛡️ Support (The "Must Hold"):
- Immediate Support: ₹255 – ₹258. The top of the "Flag" pattern. The stock should ideally not close back inside the flag.
- Stop Loss: Level of ₹242 is the perfect structural stop. A break below this invalidates the pattern.
Conclusion
This is a Grade A Setup .
> Refinement: The massive Friday volume confirms the breakout is real. The stock has entered "Price Discovery" mode.
> Strategy: Hold for the target of ₹310 . Any dip to ₹260 is a buying opportunity.

NMDC (D): Bullish, Knocking on the DoorTimeframe: Daily | Scale: Linear
The stock is on the verge of a major structural breakout from a 12-month accumulation zone (post-bonus). The move is backed by "Climax Volume" and a strong sectoral tailwind, signaling that smart money is aggressively entering.
🚀 1. The Fundamental Catalyst (The "Why")
The surge is not random; it is driven by a sector-wide re-rating:
> Sector Rally: The Nifty Metal index and global mining peers are surging, fueled by rising iron ore prices and expectations of demand recovery in China.
> Volume Significance: The 77.6 Million volume is an "Institutional Stamp." It indicates that big players are positioning for a breakout before it happens.
📈 2. The Chart Structure (The "Lid")
> The Box: The stock has been trapped in a wide consolidation since the 2:1 Bonus Issue in late 2024.
> Resistance: ₹82 – ₹83 . This level (the 52-week high) has capped every rally for the past year.
> Current Action: The stock hit an intraday high of ₹82.3 today, testing the ceiling. Closures near the high suggest buyers are eating up all supply.
📊 3. Technical Indicators
> RSI: Rising in all timeframes (Monthly/Weekly/Daily) confirms momentum is synchronized.
> Moving Averages: The stock is trading above all key EMAs, with a Golden Crossover (Short-term EMAs crossing Long-term EMAs) confirming the trend shift.
🎯 4. Future Scenarios & Key Levels
The stock is at the "Make or Break" point.
> 🐂 Bullish Breakout (The Trigger):
- Condition: A decisive Daily Close above ₹83 .
- Target: ₹91 .
> 🛡️ Support (The Safety Net):
- Immediate Support: ₹78 . The previous breakout level.
- Stop Loss: A close below ₹75 would invalidate the bullish view and send the stock back into the "boring" sideways range.
Conclusion
This is a Grade A Setup because of the volume.
> Strategy: The high volume suggests the breakout is likely real. Watch for the ₹83 level to be taken out decisively.

Prime Focus (W): Strongly Bullish - Blue Sky BreakoutTimeframe: Weekly | Scale: Logarithmic
The stock has confirmed a major structural breakout, clearing both a short-term horizontal hurdle and a multi-year channel resistance. This move is supported by the highest weekly volume in months and significant corporate restructuring news.
🚀 1. The Fundamental Catalyst (The "Why")
The massive volume and breakout are driven by strategic clarity:
> Internal Restructuring: The company recently announced the divestment of its subsidiary, Prime Focus Studios , to DNEG S.a.r.l (its material subsidiary). This simplifies the group structure and potentially unlocks value ahead of DNEG's future listing plans.
> New ATH: The stock hitting a new All-Time High (~₹224) attracts momentum traders and algorithms, fueling the volume surge.
📈 2. The Chart Structure (Channel Breakout)
> The Pattern: Ascending Parallel Channel (since Aug 2021).
- The Move: Most stocks trade inside the channel. Breaking the Upper Resistance Line is a sign of extreme bullishness. It indicates that buyers are so aggressive they are willing to pay prices above the standard trend trajectory.
> Horizontal Breakout: The level of ₹203 (Sep 2025 High) was the final "Lid." The stock smashed through this on massive volume, turning it into a concrete floor.
📊 3. Volume & Indicators
> Volume Ignition: The 52.99 Million volume is not just "rising"; it is an Ignition Bar . It confirms that institutions are participating in this leg of the rally.
> RSI Strength: Rising RSI in all timeframes confirms the trend. Note that in a "Blue Sky" breakout, RSI can stay "overbought" (>70) for weeks.
🎯 4. Future Scenarios & Key Levels
The stock is now in "Price Discovery" mode.
> 🐂 Bullish Target (Momentum):
- Target 1: ₹254 .
- Blue Sky: If the "Parabolic" phase holds, the stock could overshoot towards ₹275 .
> 🛡️ Support (The "Must Hold"):
- Immediate Support: ₹203. The horizontal resistance has flipped to support. A pullback to ₹203-205 is a high-probability "buy the dip" zone.
- Trend Support: As long as the stock stays above the Upper Channel Line (now acting as dynamic support around ₹210), the accelerated trend is intact.
Conclusion
This is a High-Octane Setup . You have an "Upper Channel Breakout" + "New ATH" + "Massive Volume."
> Strategy: Ride the momentum. Use a trailing stop (e.g., weekly low) rather than a fixed target, as these breakouts can extend further than expected. Watch ₹203 as your safety net.

Praj Ind (D): Aggressive Bullish Rev, Value Buy at Major SupportTimeframe: Daily | Scale: Linear
After a brutal 11-month downtrend, the stock has staged a violent "V-shaped" recovery from a 4-year historical support zone. This move is backed by the highest volume in months, signaling a potential trend change or a significant relief rally.
🚀 1. The "Why" (Catalyst for the 13%+ Surge)
The massive volume surge is likely driven by Value Buying and Short Covering :
- Historical Support: The stock hit ₹292 , a level not seen since mid-2022. Smart money often accumulates fundamentally sound companies at such multi-year structural supports.
- Oversold Conditions: After falling ~66%, the stock was deeply oversold. The removal of ethanol production caps for the 2025-26 supply year (fundamental tailwind) is finally being priced in.
📈 2. The Technical Structure
> The Floor (292-300): This is the "Line in the Sand." The stock tested this zone on Dec 9 and formed a base.
> The Ignition: The surge since yesterday (Dec 15) acts as an "Ignition Bar."
- Volume: 41.48 Million . This is not retail participation; this is institutional accumulation.
- Momentum: Rising ~14% in a short span confirms that the "bears are trapped."
📊 3. Indicators
- EMAs: The short-term EMAs (like 20-day) are yet to confirm a Positive Crossover because the move is so sharp. However, the price has decisively reclaimed the 20-day EMA , which is the first step.
- RSI: The rising RSI from oversold territory confirms momentum is shifting from bearish to bullish.
🎯 4. Future Scenarios & Key Levels
The primary challenge now is to sustain this vertical move.
> 🐂 Bullish Case (Continuation):
- Immediate Resistance: ₹369 . This is the previous breakdown level.
- Target: ₹427 . If ₹369 is cleared, the stock has an open path to ₹427 (which aligns with the 200-day EMA or major Fibonacci level).
> 🛡️ Support (The "Higher Low"):
- Immediate Support: ₹315 – ₹320 . In a healthy uptrend, the stock should not fall back to ₹292. Any pullback should ideally hold above ₹315 to form a "Higher Low" structure.
Conclusion
This is a classic "Dead Cat Bounce" turning into a Reversal . The volume confirms validity. The trade is now to buy on dips near ₹320 , targeting ₹369 and ₹427 . Avoid chasing the vertical rally; wait for a small cooling off.

#WELINV - VCP BO in DTFScript: WELINV
Key highlights: 💡⚡
📈 VCP BO in DTF
📈 Volume spike seen during Breakout
📈 MACD Bounce
📈 RS Line making 52WH
⚠️ Important: Always Exit the trade before any Event.
⚠️ Important: Always maintain your Risk:Reward Ratio as 1:2, with this RR, you only need a 33% win rate to Breakeven.
✅Boost and follow to never miss a new idea! ✅
Disclaimer: I am not SEBI Registered Advisor. My posts are purely for training and educational purposes.
Eat🍜 Sleep😴 TradingView📈 Repeat 🔁

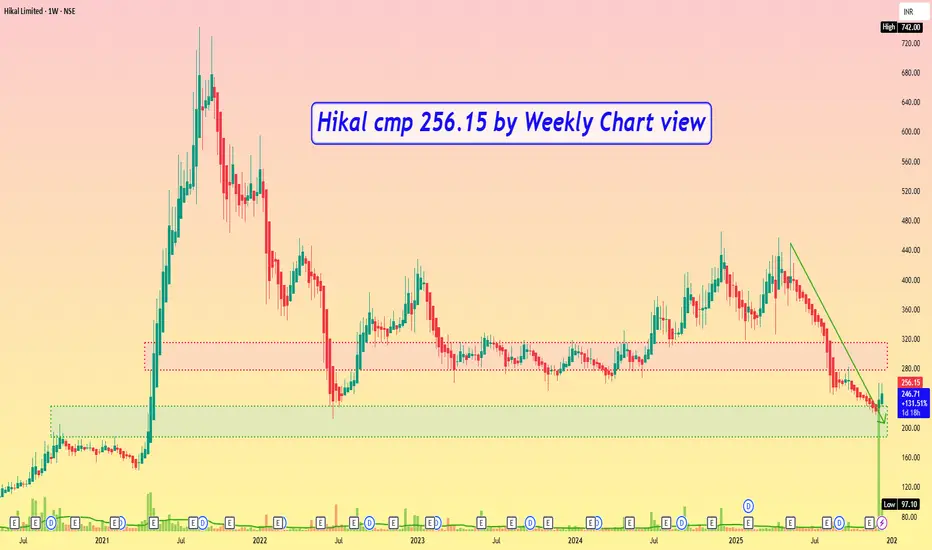
Hikal cmp 256.15 by Weekly Chart viewHikal cmp 256.15 by Weekly Chart view
- Support Zone 188 to 229 Price Band
- Resistance Zone 278 to 315 Price Band
- Support tested retested over past 4 weeks
- Falling Resistance Trendline Breakout done
- Volumes surge by demand based buying in last 2 weeks
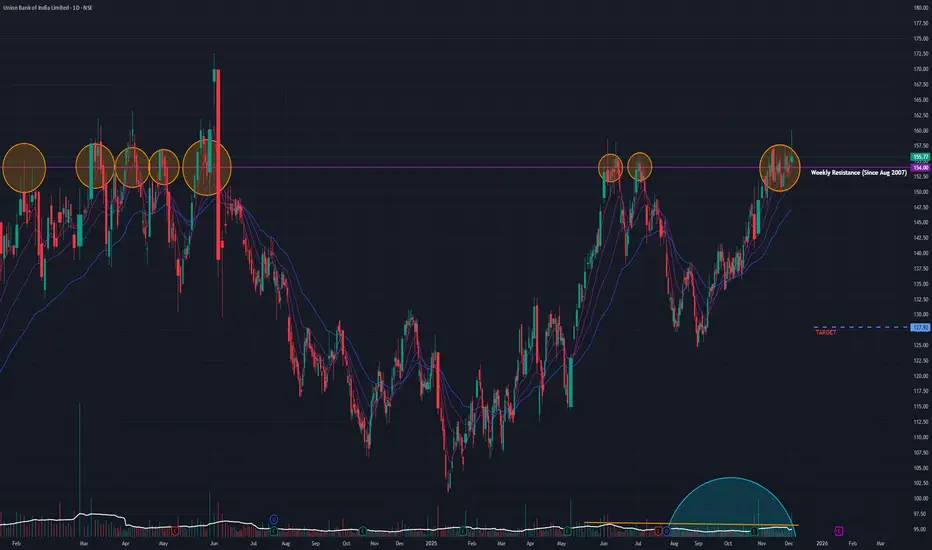
Union Bank (D): Cautiously Bullish - Breakout with RejectionTimeframe: Daily | Scale: Linear
The stock has attempted a breakout from a massive 15-year structural resistance, driven by index inclusion news. However, the daily price action signals strong profit-taking at higher levels, making the breakout fragile.
🚀 1. The Fundamental Catalyst (The "Why")
The massive 41.38 Million volume is a direct reaction to a major announcement:
- Bank Nifty Inclusion: It was announced that Union Bank will be added to the prestigious Nifty Bank Index starting Dec 31, 2025.
- Impact: This news forces passive funds (ETFs) to buy the stock, creating the volume spike. However, the "Shooting Star" suggests that active traders used this liquidity to book profits.
📈 2. The Long-Term Structure (The "Lid")
- The Cycle: .
- Peak: ATH in Oct 2010 .
- Bear Market: A decade-long spiral ending in May 2020 .
- Recovery: Since 2020, the stock has formed a "Higher Lows" structure, steadily attacking the resistance.
- The Resistance: The ₹154 – ₹155 zone is a "historic" resistance. It was a key level in Aug 2007 . Breaking a 15-year-old level is significant, but it requires a strong close to be valid.
🕯️3. The "Shooting Star" Warning (Today's Action)
> The Pattern: Today’s candle is a textbook Shooting Star .
- The Trap: The stock rallied to a high of ~₹160* , luring in breakout buyers.
- The Rejection: It was slammed back down to close near ₹155 , leaving a long upper wick.
> Interpretation: This signals that despite the good news (Index inclusion), massive supply (sellers) is still present above ₹155. The bulls failed to hold the high ground.
📊 4. Indicators
- EMA & RSI: The indicators (EMA PCO, Rising RSI) are bullish across Monthly, Weekly, and Daily timeframes. This supports the broader uptrend, but the daily candle overrides these in the short term.
🎯 5. Future Scenarios & Key Levels
The "Shooting Star" at a 15-year resistance is a classic "Bull Trap" warning.
- 🐂 Bullish Confirmation (The "Safe" Entry):
- Trigger: Ignore the current close. Wait for a Daily Close above the Shooting Star High (₹160) .
- Target: ₹220 . Once ₹160 is cleared, the 15-year supply is absorbed, and the path is open.
- 🐻 Bearish Rejection (The "Fakeout"):
- Trigger: If the stock slips back below ₹154 tomorrow.
- Consequence: This confirms today was a "fakeout." The price will likely drift down to the moving averages.
- Support: ₹125 is the deep support, but the 20-day EMA (~₹145) will likely be the first test.
Conclusion
While the trend is up, do not chase this breakout yet. The Shooting Star suggests the market is using the "Index Inclusion" news to sell. Wait for a close above ₹160 to confirm the bulls have won.
IIFL Finance (W): Strongly Bullish - Turnaround BreakoutTimeframe: Weekly | Scale: Logarithmic
The stock has confirmed a decisive breakout from a multi-year consolidation phase. This move marks the end of the post-embargo correction and is supported by strong fundamental catalysts and technical alignment.
🚀 1. The Fundamental Catalyst (The "Why")
The breakout is driven by a powerful business turnaround:
- Gold Loan Normalization: The biggest overhang on the stock was the RBI embargo on gold loans. With this fully lifted, the business has normalized, as seen in the recent Q2 FY26 Earnings where Net Profit surged 148% (YoY).
- NCD Issuance: The recent board approval to raise ₹2,000 Crore via NCDs signals confidence in growth and liquidity, acting as an immediate trigger for the stock price.
- Fitch Upgrade: Fitch Ratings recently revised the outlook to "Positive," adding institutional confidence.
📈 2. The Long-Term Structure (The "Box" Breakout)
> The Cycle:
- Peak: ATH of ₹683 in Oct 2023.
- Correction: A steep fall to the ₹294–₹304 support zone (March 2024 lows), effectively forming a "double bottom" base.
> The Breakout: The ₹535 – ₹540 zone has acted as a stiff resistance since early 2024.
- The Move: This week, the stock decisively broke and closed above this resistance (closing near ₹578).
- The Re-test: The stock consolidated just below this level before launching higher, which is a sign of strength.
📊 3. Volume & Indicators
- Volume Clarification: Volume has been "decreasing", this is actually a good sign during the consolidation (sideways) phase, as it shows selling pressure was drying up. However, for a valid breakout, we want to see volume expand . Recent daily data shows volume spikes (e.g., 3M+ shares), confirming buyers are returning.
- EMAs: The PCO (Positive Crossover) state across Monthly, Weekly, and Daily timeframes confirms that the trend has synchronized to the upside.
- RSI: Rising across all timeframes, indicating expanding momentum.
🎯 4. Future Scenarios & Key Levels
With the "lid" at ₹540 removed, the stock has room to run toward previous highs.
> 🐂 Bullish Targets:
- Target 1: ₹683 (The ATH). This is the immediate structural target.
- Target 2: ₹950 . If the momentum sustains and the stock enters "blue sky" discovery, Fibonacci extensions project a move toward ₹950 in the long term.
> 🛡️ Support (The "Must Hold"):
- Immediate Support: ₹535 – ₹540. The breakout zone has now flipped to support. Any pullback to this level is a high-probability buying opportunity.
- Stop Loss: A close below ₹465 would invalidate the bullish thesis, as it would mean the stock has fallen back deep into the old range.
Conclusion
This is a Grade A Turnaround Setup . The lifting of regulatory clouds (Gold Loan ban) combined with a technical breakout above ₹540 makes this a high-conviction trade. Watch for stability above ₹535 .

Karnataka Bank (W): Bullish, Vol-Backed Breakout at ResistanceTimeframe: Weekly | Scale: Logarithmic
The stock has confirmed a breakout from a 10-month angular downtrend. This move is backed by the highest weekly volume in years, driven by smart money entry. However, the stock is currently pausing at a critical horizontal supply zone.
🚀 1. The Fundamental Catalyst (The "Why")
The massive 149 Million volume is a direct reaction to a major news event:
- The Catalyst: Reports indicate that high-profile investors have picked up a significant stake (approx. ₹71 Crore worth) in the bank.
- Implication: When "smart money" enters with such heavy volume, it often signals a structural floor is being created. This gives high conviction to the technical breakout.
📈 2. The "Dual" Breakout Structure
- Angular Resistance (CLEARED): The stock has decisively broken and closed above the angular trendline from the Jan 2024 ATH. This signals the end of the lower-highs (downtrend) structure.
- Horizontal Resistance (PENDING): The ₹211 – ₹213 zone is acting as a stiff "Polarity Zone" (Support turned Resistance).
- The Action: The stock pierced this level intraday (High ~₹220) but faced profit-taking to close near ₹212-213 .
- Interpretation: The inability to close decisively above ₹213 suggests some supply remains. The bulls have breached the gate but haven't fully conquered the castle yet.
📊 3. Technical Indicators
- Volume: The 149M volume is a "Game Changer." It confirms that the trendline break is valid. Even if the price dips, this volume suggests dips will be bought.
- EMAs: The PCO state on Weekly/Daily confirms the trend shift.
- RSI: Rising in Monthly & Weekly, indicating sustained momentum.
🎯 4. Future Scenarios & Key Levels
The strategy now hangs on the ₹213 level.
> 🐂 Bullish Case (Confirmation):
- Trigger: A decisive daily close above ₹213 .
- Target 1: ₹250 . Once ₹213 clears, the stock enters a thin resistance zone, making ₹250 achievable quickly.
- Target 2: ₹286 (ATH).
> 🛡️ Support (The Re-test):
- Immediate Support: ₹193 . If the rejection at ₹213 leads to a pullback, the stock must hold ₹193 to keep the bullish structure alive.
- Buy Strategy: Since the trendline is broken, any dip toward ₹200-205 (retesting the broken trendline) is a high-probability entry zone.
Conclusion
This is a Grade A setup due to the sheer volume participation. The trend has shifted. While the close above ₹213 was missed by a whisker, the volume suggests it is only a matter of time. Watch for a close above ₹213 to enter long positions.

Motherson (W): Strongly Bullish, Post-Bonus Breakout(Timeframe: Weekly | Scale: Logarithmic)
The stock has confirmed a major structural breakout, emerging from a 7-month consolidation phase. This move is supported by a "Higher Low" structure, rising volume, and recent analyst optimism.
📈 1. The Structural Context (The Turnaround)
- The Adjustment (Context): It is important to note that the price levels (ATH ~₹144) reflect the 1:2 Bonus Issue that occurred in July 2025. The stock is now recovering from the post-bonus correction.
- The Cycle:
- Peak: ATH of ₹144.66 in Sep 2024.
- Correction: A downtrend lasted until April 2025 , finding a base.
- Reversal: Since April, the stock has shifted character, forming a clear series of Higher Lows , indicating steady accumulation.
💥2. The Breakout (This Week's Action)
- The "Lid" (Resistance Zone): The ₹113 – ₹116 zone has acted as a stiff resistance since Nov 2024. Breaking this level is significant.
- The Surge: This week, the stock decisively broke and closed above this zone with a 5.93% surge .
- Volume Confirmation: The move was backed by massive volume of 151.49 Million . Volume has been "drying up" since the ATH, so this sudden volume expansion is a classic "Ignition" signal.
📊 3. Technical Indicators
Indicator analysis shows a synchronized bullish trend:
- EMAs: Short-term EMAs are in a PCO (Price Crossover) state across Monthly and Weekly timeframes, confirming the trend is up.
- RSI: The Relative Strength Index is rising on both timeframes, showing momentum is building.
🎯 4. Future Scenarios & Key Levels
The breakout opens the door for a rally toward the previous highs.
- 🐂 Bullish Targets:
- Target 1: ₹132 . This is the immediate technical extension.
- Target 2: ₹145+ . If momentum sustains, a retest of the All-Time High is the structural goal. (Note: Some street estimates are as high as ₹162 ).
- 🛡️ Support (The "Must Hold"):
- Re-test Zone: The ₹113 – ₹116 zone has now flipped to support. A pullback to this level would be a healthy entry opportunity.
- Stop Loss: If the breakout fails (fakeout), the stock may slide to the ₹102 support zone.
Conclusion
This is a high-quality setup. The combination of Higher Lows , a Volume Breakout , and the Bonus Adjustment digestion makes this a strong candidate for a move to ₹132 . Watch for a sustained hold above ₹116 .

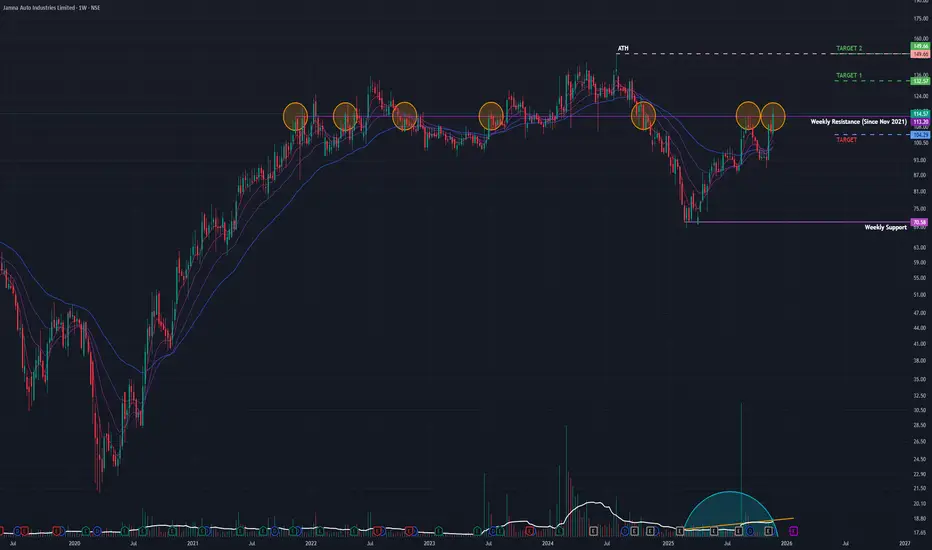
Jamna Auto - Strongly Bullish - Expansion-Driven Breakout(Timeframe: Weekly | Scale: Logarithmic)
The stock has confirmed a decisive breakout from a multi-year resistance zone. This move is supported by a significant capacity expansion announcement, rising volume, and a bullish structural shift.
🚀 1. The Fundamental Catalyst (The "Why")
The breakout is driven by a clear growth narrative that is attracting institutional interest:
- ₹132 Cr Expansion Plan: The company recently announced a major investment to set up new manufacturing facilities. This signals management's confidence in future demand.
- Steady Earnings: Q2 FY26 results showed stable profitability (Net Profit ~₹40 Cr) and declared an interim dividend, providing a fundamental floor to the price.
- Impact: This news has acted as the trigger for the stock to finally clear the 112-114 hurdle.
📈 2. The Long-Term Structure (The Breakout)
- The "Lid" (112-114 Zone): This is the critical polarity zone. It has acted as both support and resistance since Nov 2021 . Breaking a level with 4 years of history is a significant technical event.
- The Breakout: This week’s surge of 8.53% with 17.84 Million in volume is a high-conviction move. The decisive close above ₹114 confirms that the "supply" at this level has finally been absorbed.
- Volume Profile: The "rising volume" in recent weeks confirms that smart money is accumulating shares in anticipation of the expansion benefits.
📊 3. Technical Indicators
Indicator analysis shows a synchronized bullish trend:
- EMAs: Short-term EMAs are in a PCO state across Monthly and Weekly timeframes, confirming that the trend is aligning upwards.
- RSI: The Relative Strength Index is rising without being extremely overbought, leaving room for further upside momentum.
🎯 4. Future Scenarios & Key Levels
With the "lid" removed, the stock is primed for a recovery rally.
- 🐂 Bullish Targets:
- Target 1: ₹132 . This is the first logical resistance.
- Target 2: ₹149 (The ATH). A retest of the all-time high is the ultimate objective of this breakout structure.
- 🛡️ Support (The "Must Hold"):
- Re-test Zone: The ₹112 – ₹114 zone has now flipped to support. A pullback to this level would be a healthy re-test.
- Stop Loss: If the momentum fails, the stock must not close below ₹104 . Losing this level would invalidate the breakout and trap the new buyers.
Conclusion
This is a high-quality setup. The combination of a multi-year resistance breakout and a tangible expansion plan makes this a strong candidate for a move toward ₹132 . Watch for stability above ₹114 .
SMS Pharma (D): Strongly Bullish - News-Driven BreakoutThe stock has confirmed a major structural reversal, breaking out of a 6-month consolidation pattern. This move is powered by a significant regulatory approval (USFDA) and strong earnings, validating the high volume.
🚀 1. The Fundamental Catalyst (The "Why")
The massive surge and volume are not random. They are a direct reaction to two major positive developments:
- USFDA Approval: The company's partner, VKT Pharma, received USFDA approval for reformulated Ranitidine tablets (an antacid). This marks a re-entry into the US market after years, opening a significant revenue stream.
- Strong Earnings: The company recently reported a 79% YoY jump in Net Profit for Q2 FY26.
- Impact: This fundamental "double engine" provides the conviction that the breakout is genuine and not a "trap."
📈 2. The Long-Term Structure (The Reversal)
- The Correction: After the Sep 2024 ATH (~₹398) , the stock corrected ~55% to bottom out in March 2025 .
- The Turnaround: Since March, the stock has shifted structure, forming Higher Lows , indicating that buyers are stepping in aggressively on dips.
- The "Dual" Resistance:
1. Angular Resistance: From the Sep 2024 ATH.
2. Horizontal Resistance: The ₹314–₹317 zone (active since Nov 2024).
💥 3. The Breakout & Re-test (Current Action)
- The Breakout (Yesterday): The stock surged 17.82% with massive volume ( 11.76 Million ), decisively closing above both resistance lines. This high-volume close confirms the "Lid" is off.
- The Re-test (Today): The stock pulled back to the ₹314–₹317 zone today. The volume during this pullback was lower than the breakout volume.
- Bullish Signal: A low-volume pullback to a high-volume breakout level is a textbook "healthy re-test." It suggests profit-taking, not a trend reversal.
📊 4. Technical Indicators
- RSI Cooling: The Daily RSI has fallen with today's re-test. This is actually positive—it prevents the stock from becoming "overheated" too quickly, allowing it to gather strength for the next leg up.
- EMAs: The PCO state across all timeframes confirms that the trend is aligned in favor of the bulls.
🎯 5. Future Scenarios & Key Levels
The "healthy re-test" sets the stage for continuation.
- 🐂 Bullish Target: ₹360 . If the stock holds the re-test level, a move to ₹360 (and potentially the ATH of ₹398) is the path of least resistance.
- 🛡️ Support (The Stop Loss): Support level at ₹290–₹292 is the critical "safety net." If the stock falls back below the breakout zone (₹314), it must hold ₹290 to keep the bullish structure alive.
Conclusion
This is a Grade A setup . Technical breakout, a healthy re-test, and a powerful fundamental catalyst. As long as ₹314 holds as support, the bias is strongly upward.

#SMSPHARMA - VCP BO in DTFScript: SMSPHARMA
Key highlights: 💡⚡
📈 VCP BO in DTF
📈 Volume spike seen during Breakout
📈 MACD CrossOver
📈 RS Line making 52WH
⚠️ Important: Always Exit the trade before any Event.
⚠️ Important: Always maintain your Risk:Reward Ratio as 1:2, with this RR, you only need a 33% win rate to Breakeven.
✅Boost and follow to never miss a new idea! ✅
Disclaimer: I am not SEBI Registered Advisor. My posts are purely for training and educational purposes.
Eat🍜 Sleep😴 TradingView📈 Repeat 🔁

Sequent (D): Strongly Bullish, Fundamentally-Driven BreakoutThe stock has confirmed a major breakout from a 3-year structural turnaround. The move is backed by a massive earnings beat, high-conviction volume, and aligned indicators across all timeframes.
📈 1. The Long-Term Structure (The Turnaround)
- The Crash (2021-2023): After hitting its All-Time High (ATH) in June 2021, the stock entered a brutal correction, falling ~81% to form a base around ₹62 in February 2023.
- The Recovery: Since March 2023, the stock has been in a steady uptrend, forming a classic "rounding bottom" or recovery structure.
- The Hurdle: The recovery faced a stiff horizontal resistance trendline at the ₹239 - ₹241 zone. This level acted as a ceiling in October 2024 (High: ₹240.70) and rejected price action multiple times recently.
🚀 2. The Catalyst & Breakout (Today's Action)
- The Catalyst: The breakout is fueled by Q2 FY26 Earnings , where the company reported a staggering 209.1% YoY jump in Net Profit
- The Breakout: Today (Nov 18, 2025), the stock decisively shattered the ₹240 resistance, surging 7.10% to close near ₹247 .
- Volume Confirmation: The move was backed by massive volume of 9.15 Million shares, a sharp spike compared to the drying volume seen during the recent consolidation. This confirms institutional buying.
📊 3. Technical Indicators
- EMAs: Short-term EMAs are in a PCO (Price Crossover) state across Monthly, Weekly, and Daily timeframes, signaling a synchronized bullish trend.
- RSI: The Relative Strength Index is rising across all three timeframes, confirming that momentum is expanding with price.
🎯 4. Future Scenarios & Targets
The breakout has opened the door to higher levels, with a specific structural target in focus.
- The Gap (The Magnet): An unfilled gap on the daily chart has been identified from the steep 2021 correction. This gap exists between ₹270 and ₹276 (formed in August 2021). Gaps often act as magnets for price.
🐂 Bullish Targets:
1. Target 1 (Gap Support): ₹270 . The stock is likely to run toward the bottom of this unfilled gap.
2. Target 2 (Gap Fill): ₹295 . If momentum sustains and fills the gap, the next extension level is near ₹295.
🛡️ Support (The Entry Zone):
- Re-test Level: The breakout level at ₹239 - ₹240 has now flipped from resistance to support. A pullback to this zone would be a classic "buy-the-dip" opportunity to enter the trend with a favorable risk-reward ratio.
Conclusion
This is a high-quality setup. The combination of a technical breakout , earnings explosion, and gap-fill potential makes this a strong candidate for continuation. Watch for a hold above ₹239 .
