HIKAL LTD - Long-Term Cup & Handle Breakout | Weekly ChartHIKAL LTD - Long-Term Cup & Handle Breakout | Weekly Chart
🕒 Timeframe: 1W | NSE: HIKAL
📅 Date: April 18, 2025
💰 CMP: ₹431.60
📈 Volume: 4.57M
🔍 Chart Highlights
☕ Cup & Handle pattern forming over a multi-year base, suggesting a potential long-term breakout.
📏 Breakout Zone (Resistance):
🟪 ₹440–₹460 (purple zone) – Multiple rejections in the past. Price is now testing this major supply zone.
📉 Downtrend Resistance Line:
Price has broken above the falling trendline, confirming bullish strength.
🟩 Support Levels:
₹400 (recent breakout retest zone)
₹360 (previous structure low)
📈 Resistance Ahead:
₹470 (long wick area)
₹510 (supply zone)
🧠 Technical Indicators
📊 RSI (Relative Strength Index)
RSI at 61.63, approaching the bullish zone
RSI breakout above previous bearish structure
“Bull” and “Bear” labels show previous sentiment shifts
🔔 Conclusion
✅ A classic Cup & Handle breakout on weekly timeframe with strong volume surge
✅ Above key resistance with bullish RSI — suggests potential continuation
⚠️ Watch for sustained close above ₹460 for confirmation
🔍 Chart by: PriceAction_Pulse
📬 For more detailed insights, follow on TradingView
✅ Educational purpose only — DYOR before any investment decision.
Volumespike

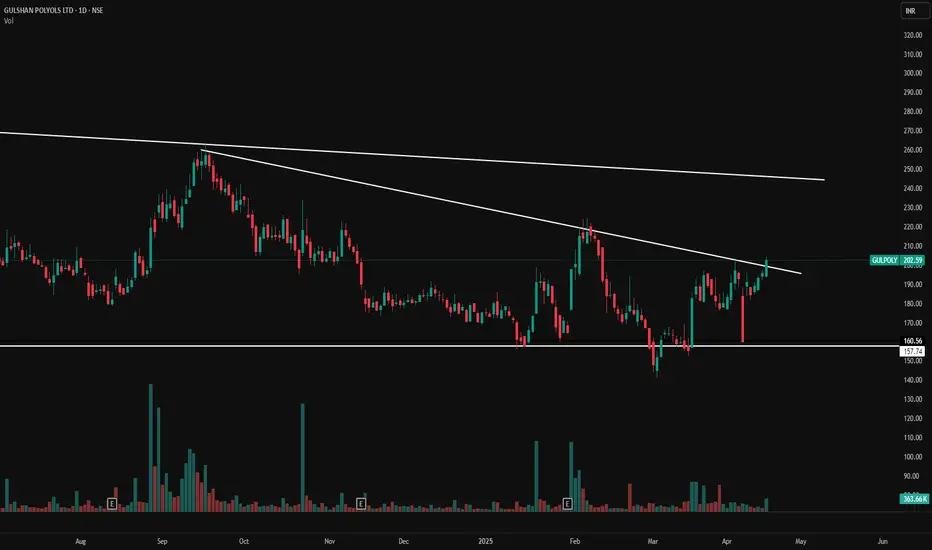
Gulshan Polyols Ltd - Downtrend Breakout Attempt!Want more such charts?
📬 Join our community — message us via profile bio link!
(Gulshan Polyols Ltd)
🗓️ Date: April 18, 2025
🔍 Technical Breakdown:
✅ Breakout in Progress
Stock has been respecting a descending trendline since August 2024.
Price is currently testing the trendline resistance, with today's candle showing a potential breakout.
Closing above this trendline will confirm breakout with short-term bullish bias.
🔄 Support & Resistance Levels
🧱 Support Zone: ₹157.74 – ₹160.56
📉 Resistance Trendline: Around ₹200 – ₹205 zone
📈 Next Resistance: ₹225, followed by ₹250
📊 Volume Analysis
A volume spike of 363.66K supports today’s breakout candle
Indicates strong interest and buying pressure building up near resistance
🧠 Interpretation:
This chart represents a classic trendline breakout structure:
Price forming higher lows
Buyers gradually absorbing selling pressure at resistance
Volume confirming strength
A daily close above ₹205 can be considered as breakout confirmation.
Targets post-breakout could range between ₹225 – ₹250 in coming sessions.
📌 Key Levels to Watch:
Support Zone: ₹157 – ₹160
Breakout Confirmation: Above ₹205
Upside Targets: ₹225 and ₹250
🏢 Company Fundamentals (Snapshot):
Sector: Chemicals & Ethanol
Specialty: Manufacturer of industrial chemicals, ethanol, and food-grade products
Growth Drivers:
Rising demand for ethanol blending in fuel
Diversified product portfolio
Government policy tailwinds on ethanol
⚠️ Disclaimer:
This analysis is for educational and informational purposes only. Please consult your financial advisor before making any trading decisions.
Doji Sandwich + Volume Spike = 10/10 Trades If You Spot It RightHello Traders!
Today, let’s talk about a highly underrated but powerful candlestick pattern — the Doji Sandwich . When this pattern appears with a volume spike , it can give you a high-probability breakout or breakdown setup . If you’ve ever missed strong moves because of late entries, this one’s for you.
Let’s decode how to spot it, trade it, and why it works so well.
What is the Doji Sandwich Pattern?
Structure: The pattern consists of three candles — a strong candle (bullish or bearish), followed by a Doji , and then another strong candle in the same direction as the first.
Indecision Trap: The Doji shows indecision, but the follow-up candle confirms that the previous trend will continue.
Reliability Boost: When supported by a volume spike on the third candle, it becomes a powerful confirmation of trend continuation.
How to Trade the Doji Sandwich Setup
Entry: Enter on the breakout of the third candle (closing above or below the Doji range).
Stop Loss: Place your stop loss just below the Doji (in bullish case) or above it (in bearish case).
Volume Confirmation: Make sure the third candle is accompanied by a visible volume spike — this confirms institutional activity.
Ideal Timeframe: 15min, 1hr, or Daily chart — depending on your trading style (intraday or swing).
When Does It Work Best?
Near support/resistance zones — as a continuation signal.
After a short pullback or consolidation .
In trending markets where volume confirms momentum.
Rahul’s Tip
Always combine price pattern + volume confirmation. A Doji Sandwich alone is good, but with a volume spike — it’s fire🔥. Don’t just watch it — prepare for it.
Conclusion
The Doji Sandwich pattern is one of those rare 10/10 setups when spotted correctly with volume. Simple, clean, and powerful — it can help you catch big moves early. Add it to your watchlist strategy, and you’ll never ignore this combo again!
Have you ever traded this pattern? Share your experience below, and let’s learn from each other!

Massive Breakout in Nifty index : Is the Next Bull Run Starting?Hello everyone i hope you all will be doing good in your life and your trading as well, Today i have brought anlaysis on Nifty 50 because index is currently showing a strong bullish breakout setup after a long period of consolidation. A key channel breakout has occurred, confirmed by a significant volume spike , signaling the return of strong buying interest. This breakout, coupled with a recent surge in FII inflows , which have pumped in 7,470.36 Cr into the Indian market, points towards a shift in market sentiment and signals a potential rally ahead. On top of that, the government's Open Market Operations (OMO) have provided additional liquidity, further boosting market sentiment and helping support the overall bullish outlook.
And the strong support zone is playing its role as a key demand area, with multiple rejections at this level showing strong buying defense. The market is likely to head toward the 25,000+ mark , backed by a positive fundamental and sentiment boost, along with the government's OMO action , which adds a layer of liquidity and confidence. Keep an eye on this breakout, as it could set the stage for a bullish run in the broader market.
Additional Tip to my all followers:
If you're looking to invest for the long term, buying a Nifty ETF is a great option to get diversified exposure to the top 50 companies in India. It’s a cost-effective way to invest in the broad market, and given the positive outlook for the Nifty 50 index, it has the potential to offer solid returns in the long run.
Additionally, investing in your favorite stocks for the long term can complement your portfolio and further boost returns as these stocks grow over time. Combining Nifty ETFs with quality individual stocks provides a diversified approach while also giving you the opportunity to capitalize on the growth of specific companies that you believe in for the future.
Disclaimer:-This analysis is for educational purposes only. Please trade responsibly and consult a financial advisor before making any decisions.
If you found this analysis helpful, don’t forget to like, follow, and share your thoughts in the comments below! Your support keeps me motivated to share more insights. Let’s grow and learn together—happy investing!

GILLETTE INDIA LTD - Short to Long Term Positional Trading setupHello everyone, today i have brough a trading idea on GILLETTE INDIA LTD. And it is showing a promising setup for both short-term and long-term positional traders. The stock has recently broken out from a resistance zone , and the huge volume spike confirms the strength of this move. After breaking the resistance, the stock retested the breakout zone and found support, and is now poised for further upside. The ideal entry point is between 8,400 - 8,200 , as the stock has established a solid base in this area. The first target is 10,163 , followed by the second target at 11,778 . For long-term traders, the final target is 13,685 . A stop loss should be placed just below the breakout zone, around 8,000 , to protect against any adverse moves. This setup offers a great opportunity for traders looking for a strong bullish trend with clear targets. The breakout, coupled with the retest and volume confirmation, gives confidence that the stock could achieve these targets in the coming months.
Disclaimer:- This analysis is for educational purposes only. Please trade responsibly and consult a financial advisor before making any decisions.
If you found this analysis helpful, don’t forget to like, follow, and share your thoughts in the comments below! Your support keeps me motivated to share more insights. Let’s grow and learn together—happy trading!

#REDINGTON - Potential Break Out / Feb'25📊 Script: REDINGTON
Key highlights: 💡⚡
📈 IH&N Formation in Weekly chart.
📈 IH&N Formation in Daily chart also
📈 Went into a Side Ways consolidation for over a Nine months.
📈 Volume spike seen in past
📈 MACD Cross Over.
📈 One can go for Swing Trade.
🟢 If you have any questions regarding the setup, please feel free to leave your inquiries in the comments, and I will respond promptly.
BUY ONLY ABOVE 233 DCB
⏱️ C.M.P 📑💰- 226
🟢 Target 🎯🏆 – NA%
⚠️ Stoploss ☠️🚫 – NA%
⚠️ Important: Always Exit the trade before any Event.
⚠️ Important: Always maintain your Risk & Reward Ratio.
✅#Boost, #Like & #Follow to never miss a new idea! ✅
Disclaimer: I am not SEBI Registered Advisor. My posts are purely for training and educational purposes.
Eat🍜 Sleep😴 TradingView📈 Repeat 🔁
Happy learning with MMT. Cheers!🥂

#SHIVALIK - Potential Break Out / Feb'25📊 Script: SHIVALIK
Key highlights: 💡⚡
📈 IH&N Formation in Weekly chart.
📈 IH&N Formation in Daily chart also
📈 Price gave a good up move.
📈 Went into a Side Ways consolidation for over a Two months.
📈 Volume spike seen in past
📈 MACD Cross Over.
📈 One can go for Swing Trade.
🟢 If you have any questions regarding the setup, please feel free to leave your inquiries in the comments, and I will respond promptly.
BUY ONLY ABOVE 850 DCB
⏱️ C.M.P 📑💰- 783
🟢 Target 🎯🏆 – NA%
⚠️ Stoploss ☠️🚫 – NA%
⚠️ Important: Always Exit the trade before any Event.
⚠️ Important: Always maintain your Risk & Reward Ratio.
✅#Boost, #Like & #Follow to never miss a new idea! ✅
Disclaimer: I am not SEBI Registered Advisor. My posts are purely for training and educational purposes.
Eat🍜 Sleep😴 TradingView📈 Repeat 🔁
Happy learning with MMT. Cheers!🥂

#ZENSARTECH - Add to Watchlist📊 Script: ZENSARTECH
Key highlights: 💡⚡
📈 IHNS Formation in Daily chart.
📈 Price gave a good up move.
📈 Went into a Side Ways consolidation for over a Six months.
📈 Volume spike seen.
📈 MACD Cross Over.
📈 One can go for Swing Trade.
🟢 If you have any questions regarding the setup , please feel free to leave your inquiries in the comments , and I will respond promptly.
BUY ONLY ABOVE 850 DCB
⏱️ C.M.P 📑💰- 823
🟢 Target 🎯🏆 – NA%
⚠️ Stoploss ☠️🚫 – NA%
⚠️ Important: Always Exit the trade before any Event.
⚠️ Important: Always maintain your Risk & Reward Ratio.
✅#Boost, #Like & #Follow to never miss a new idea! ✅
Disclaimer: I am not SEBI Registered Advisor. My posts are purely for training and educational purposes.
Eat🍜 Sleep😴 TradingView📈 Repeat 🔁
Happy learning with MMT. Cheers!🥂


National aluminium multi pattern trade idea National Aluminium trades within a broader rising wedge pattern, marked by the red lines. A counter-trendline (solid white line) also comes into play, indicating a shorter-term resistance zone. The stock recently broke through one of the dotted hidden lines, but it's still facing resistance from the upper hidden trendline, keeping it just below a key breakout point. The formation of higher lows, highlighted by the yellow circles, signifies strength in price action and building momentum.
Today's volume surge, notably higher than average, adds weight to the bullish sentiment. However, a significant breakout could only be confirmed once the price clears the last hidden line of resistance. Watching closely for this potential move

CASTROLIND
most important is
52week and six-year high breakout with volume rise and very important point is stock is retext & give a good support zone which is already broken resistant zone with h volume .
targets are open on chart but .. respect to SL like me of discipline trader.
share Dividend ₹ 4.50 /share
ex-date 21 march
Castrol India at near six-year high on Q4 profit jump
Company has a good return on equity (ROE) track record: 3 Years ROE 45.9%
holdings :-)))
a) Promoters 51%
b)FIIs & DIIs 27 %
c) Public 22%
for MORE check in my TradingView ID
If You LIKE👌👌 MY Idea ......Boost.🔥🔥🔥.. its.
"Disclosure : I am not Sebi-registered." This channel is for only educational purpose. Any profit/loss, I am not responsible.
Before taking any trade on our charts / calls, please consult your financial advisors. Thanks

Continuation Pattern Breakout seen in Crude oil Marketing stockHello everyone, i have brought a stock which has given a neat and clean Ascending triangle pattern Breakout with good volume spike stock name is HPCL, before to jump into stock i want to teach you guy's about this pattern so if you see from next time onwards, you can play this.
Q:- What is Ascending Triangle Pattern?
Ans by Rahul:- It is a bullish continuation pattern that occurs in an uptrend and signals that the price of the stock will continue to trend higher on completion of the pattern. This pattern shows that buyers are getting very aggresive and are likely to take prices higher once the price breaks through the pattern.
Q:- How to Trade this Ascending Triangle Pattern?
Ans by Rahul:- First of all you have to wait with patience to see a perfect breakout on chart with good volume spike. Then you have to take entry once breakout confirmed, and the potential target for the pattern is normally calculated by projecting the height of the Ascending triangle at it's thickest point above the breakout point and stop loss will be placed at the swing low which occurs just before the price breaks the resistance on the upside as shown in HPCL chart above. This will give us favorable risk to reward ratio.
So, I hope you now know about this pattern (Ascending Pattern). If you really learned something, don't forget to like this idea, because it will increase my confidence level to provide you guys with this type of learning content as always.
Let's focus on Company Now:-
Hindustan Petroleum Corporation Ltd is mainly engaged in the business of refining of crude oil and marketing of petroleum products, production of hydrocarbons as well as providing services for management of E&P Blocks.
Market Cap
₹ 84,175 Cr.
Current Price
₹ 396
High / Low
₹ 402 / 159
Stock P/E
8.52
Book Value
₹ 221
Dividend Yield
6.70 %
ROCE
21.3 %
ROE
40.4 %
Face Value
₹ 10.0
Industry PE
11.5
Debt
₹ 66,684 Cr.
EPS
₹ 46.4
Promoter holding
54.9 %
Intrinsic Value
₹ 318
Pledged percentage
0.00 %
EVEBITDA
7.25
Change in Prom Hold
0.00 %
Profit Var 5Yrs
19.1 %
Sales growth 5Years
9.51 %
Return over 5years
17.6 %
Debt to equity
1.42
Net profit
₹ 9,883 Cr.
ROE 5Yr
16.7 %
Profit growth
18.5 %
Earnings yield
9.99 %
Disclaimer:- Please always do your own analysis or consult with your financial advisor before taking any kind of trades.
Dear traders, If you like my work then do not forget to hit like and follow me, and guy's let me know what do you think about this idea in comment box, i would be love to reply all of you guy's.
Thankyou.

KNRCONKNRCON its pattern breakout .
look how to work after breakout then open targets .
for MORE check in my TradingView ID
If You LIKE👌👌 MY Idea ......Boost.🔥🔥🔥.. its.
"Disclosure : I am not Sebi-registered." This channel is for only educational purpose. Any profit/loss, I am not responsible.
Before taking any trade on our charts / calls, please consult your financial advisors. Thanks

MOTHERSONThis a multi bagger stock . Huge potential.
Multi-year breakout try .. with high volume
Large cap company with moderate risk
my study point
company in India
holdings :-)))
a) Promoters :- 65 %
b) mutual fund :- 13%
c) FIls & DIIs :- 12%
d) Public 10%
Motherson Sumi Q3 Results: Revenue Jumps 25%, Ebitda Up 46% To Highest Ever
for MORE check in my TradingView ID
If You LIKE MY Idea ......Boost... its "Disclosure : I am not Sebi-registered." This channel is for only educational purpose. Any profit/loss, I am not responsible.
Before taking any trade on our charts / calls, please consult your financial advisors. Thanks

Skipper forming HHs-HLs, and ready to breakout?-From strong sector
-making Higher Highs - Higher Lows (HHs-HLs)
-VCP (contraction in price)
-Volume Spikes
-Long Base
-Bounced from 21 ema

LICHSGFIN- Breakout of Resistance - Done ✓
- Volume Spike break Resistance - Done ✓
-break Consolidation of cup and handle which good move of that depth.
SL always Paid ...
for MORE check in my TradingView ID
If You LIKE👌👌 MY Idea ......Boost.🔥🔥🔥.. its.
"Disclosure : I am not Sebi-registered." This channel is for only educational purpose. Any profit/loss, I am not responsible.
Before taking any trade on our charts / calls, please consult your financial advisors. Thanks

Breakout in NOCIL1. **Price Movement**:
- The price has been in an uptrend since mid-2020.
- There was a consolidation phase that lasted from mid-2021 to mid-2023, forming a symmetrical triangle or a range-bound pattern.
- Recently, the price has broken out of this consolidation pattern to the upside, which is a bullish signal.
2. **Volume**:
- The volume spikes suggest significant trading activity during certain periods.
- A noticeable increase in volume during the recent breakout, supporting the bullish move.
3. **Trend Lines**:
- Upper and lower trend lines indicate potential resistance and support levels.
- The breakout above the upper trend line is significant, suggesting further potential upside.
4. **Price Target**:
- The price target, marked by a blue box, shows an estimated target around INR 370. This is calculated based on the height of the previous range projected upwards from the breakout point.
5. **RSI Indicator**:
- The RSI is currently around 54.53, indicating a neutral to slightly bullish momentum.
- The divergence in the RSI during the previous highs indicated potential weakness, but the recent breakout suggests renewed strength.
6. **Support and Resistance**:
- Immediate support is around the breakout point near INR 260-270.
- Resistance is expected around the INR 370 target zone.

Hindustan food limited is on breakout with good volume spikeHello everyone, i have brought a stock which has given a breakout of triangle pattern with huge volume spike on weekly chart, there is higher probability that we will see bullish uptrend momentum in this.
Hindustan Foods Limited is an India-based company, which is engaged in contract manufacturing of various FMCG products including food, home care, personal care, beverages etc. They also do manufacturing of leather shoes and accessories.
Technically stock is looking good as it has given breakout of triangle pattern with good volume
Price is above 200-DEMA.
Macd is also giving bullish crossover.
Morgan stanley has taken position on bulk.
Market Cap
₹ 6,397 Cr.
Current Price
₹ 558
High / Low
₹ 630 / 461
Stock P/E
68.8
Book Value
₹ 56.4
Dividend Yield
0.00 %
ROCE
15.4 %
ROE
18.2 %
Face Value
₹ 2.00
Industry PE
40.5
Debt
₹ 730 Cr.
EPS
₹ 8.12
Promoter holding
63.8 %
Intrinsic Value
₹ 256
Pledged percentage
0.00 %
EVEBITDA
30.9
Change in Prom Hold
-1.04 %
Profit Var 5Yrs
50.9 %
Sales growth 5Years
41.1 %
Return over 5years
43.8 %
Debt to equity
1.13
Net profit
₹ 93.0 Cr.
ROE 5Yr
18.2 %
Profit growth
30.8 %
Earnings yield
2.61 %
Disclaimer:- Please always do your own analysis or consult with your financial advisor before taking any kind of trades.
Dear traders, If you like my work then do not forget to hit like and follow me, and guy's let me know what do you think about this idea in comment box, i would be love to reply all of you guy's.
Thankyou.

Reliance (RIIL) giant ready to move?RIIL is in pretty good setup
-recovered fast from 4th june big red candle
-signal candle (yellow arrow) >5%+ move with >1M+ vol, suggesting institutions are buying
-after vol low period in setup, vol kicking in
-tightness

Dodla Dairy forming a long base after great results-Posted great results, PAT 108% up YoY
-In long base
-Tightness near breakout zone
-Volumes kicking in
-Recovered fast from 4th june carnage

DYCL, Cup n Handle Despite volatility because of election results, structure still intact.
-Posted good results too
-green vol > red vol

BHARATRAS(weekly breakout )BHARATRAS
sometime later I am share weekly breakout stock for study purpose .
targets are open with my logics on chart please read my chart . if it's not possible . msg me i explain every thing don't vary.
for MORE check in my TradingView ID
If You LIKE👌👌 MY Idea ......Boost.🔥🔥🔥.. its.
"Disclosure : I am not Sebi-registered." This channel is for only educational purpose. Any profit/loss, I am not responsible.
Before taking any trade on our charts / calls, please consult with your advisor.

ESTER : Breakout Candidate#Ester #breakout #momentumstock #Trendingstock #lowriskhighrewardtrade
ESTER : (1-3 Months)
>> Breakout Candidate
>> Massive Volumes Buildup
>> Trending Stock
>> Momentum Building up
>> Low Risk High Reward Trade
Swing traders can lock profit at 10% and keep trailing
Please give a Boost or comment if u r Liking the analysis & Learning from it. Keep showing ur Love by following
Disclaimer : This is not a Trade Recommendations & Charts/ stocks Mentioned are for Learning/Educational Purpose. Do your Own Analysis before Taking positions.
