Eicher Motors: Hits Swing Highs, Signal More Upside AheadNSE:EICHERMOT Hits Swing Highs: This Technical Setup Could Signal More Upside Ahead
Price Action Analysis:
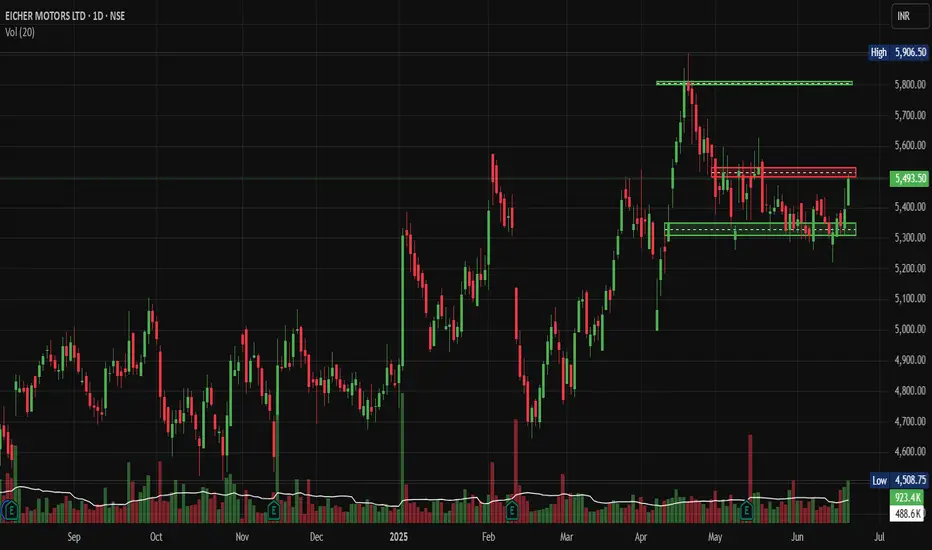
- Current Price: ₹5,493.50 (as of June 19, 2025)
- Day's Range: ₹5,410.00 - ₹5,506.50
- Price movement shows strong bullish momentum with recent breakout above resistance
- The stock has gained approximately 100.50 points (+1.86%) in the session
Volume Spread Analysis:
- Current session volume: 923.4K (89% above average)
- Average volume: 488.6K
- Volume surge during breakout phases confirms institutional buying
- Declining volume during consolidation phases shows controlled profit-taking
- Volume spike of 923.4K against average of 488.6K indicates institutional participation
- Volume has been increasing over the past 3 Days.
Volume Pattern Insights:
- Volume expansion on up moves and contraction on down moves
- Accumulation pattern visible in the base formation phase
- Recent volume spike suggests renewed buying interest
Chart Patterns:
- A clear ascending triangle pattern formed between March and May 2025
- Breakout above the ₹5,800 resistance level in April with strong volume confirmation
- Current consolidation phase between ₹5,300-₹5,500 range
- Higher lows pattern since March 2025 indicates underlying bullish sentiment
Key Technical Levels:
Support Levels:
- Immediate Support: ₹5,300 (previous resistance turned support)
- Secondary Support: ₹5,100 (20-day moving average zone)
- Major Support: ₹4,800 (previous consolidation base)
- Critical Support: ₹4,500 (long-term uptrend line)
Resistance Levels
- Immediate Resistance: ₹5,600 (short-term ceiling)
- Key Resistance: ₹5,800 (previous breakout level)
- Major Resistance: ₹5,900 (all-time high zone)
- Extended Target: ₹6,200 (measured move projection)
Base Formation
- Primary base formed between September 2024 - March 2025
- Consolidation range: ₹4,400 - ₹5,200
- Duration: 6 months (healthy accumulation phase)
- Breakout confirmation in April 2025 with volume expansion
Technical Indicators Assessment:
Momentum Indicators:
- Price trading above key moving averages
- Bullish crossover pattern maintained
- Momentum favours bulls in the short to medium term
Trend Analysis:
- Primary trend: Bullish (uptrend intact since September 2024)
- Secondary trend: Consolidation within an uptrend
- Trend strength: Strong (confirmed by volume analysis)
Trade Setup:
Long Position Strategy:
- Entry Strategy: Buy on dips approach
- Accumulation zone: ₹5,300 - ₹5,400
- Momentum entry: Above ₹5,550 with volume confirmation
- Investment horizon: 3-6 months
Entry Levels:
- Conservative Entry: ₹5,320 (near support)
- Aggressive Entry: ₹5,480 (current levels)
- Breakout Entry: ₹5,560 (above resistance)
Exit Strategy:
- Target 1: ₹5,800 (12% upside from current levels)
- Target 2: ₹6,000 (20% upside potential)
- Target 3: ₹6,200 (extended target for long-term holders)
Stop-Loss Levels:
- Conservative SL: ₹5,200 (below key support)
- Aggressive SL: ₹5,350 (tight stop for short-term trades)
- Investment SL: ₹4,800 (major support violation)
Position Sizing & Risk Management:
Position Sizing Guidelines:
- Conservative approach: 2-3% of portfolio allocation
- Moderate approach: 4-5% of portfolio allocation
- Aggressive approach: 6-8% of portfolio allocation (only for high-risk tolerance)
Risk Management Framework:
- Maximum risk per trade: 2% of total capital
- Risk-reward ratio: Minimum 1:2 preferred
- Portfolio correlation: Consider auto sector exposure
- Stop-loss discipline: Strict adherence to predetermined levels
Capital Allocation Strategy:
- Entry in tranches during the consolidation phase
- Average up strategy on breakout confirmation
- Profit booking at predetermined target levels
- Position sizing adjustment based on volatility
Sectoral Backdrop:
Automobile Sector Overview:
- The two-wheeler segment is showing a strong recovery post-COVID
- Rural demand improvement supporting premium motorcycle sales
- Electric vehicle transition creating new opportunities
- Government infrastructure spending boosts commercial vehicle demand
Industry Trends:
- The premium motorcycle segment is growing faster than the mass market
- Export opportunities expanding in international markets
- Supply chain normalisation is improving production efficiency
- Raw material cost pressures are stabilizing
Fundamental Backdrop:
Company Fundamentals:
- May 2025 sales up 26% YoY with a total of 89,429 units sold
- International sales up 82%, showing strong export growth
- Achieved a significant milestone of selling over 100,000 units in March with 33.7% YoY growth
- Fundamentals look strong and suitable for long-term investment
Market Position:
- Continues to dominate >350cc space with >85% market share
- Increased market share from 32.9% in Q4FY22 to ~36% in Q1FY23 in >125cc segment
- Market cap of ₹1,50,676 crores, appearing financially stable compared to competitors
- Average analyst price target of ₹5,426 from 21 research reports
Financial Health:
- Trailing 12-month revenue of $2.19 billion as of March 2025
- Strong balance sheet with healthy cash flows
- Consistent dividend payment track record
- Efficient capital allocation and ROE metrics
Growth Catalysts:
- New product launches, including Hunter 350, are receiving a positive response
- Market share expansion in the premium segment
- International market penetration opportunities
- Electric vehicle portfolio development
Risk Factors:
Company-Specific Risks:
- Dependence on Royal Enfield brand performance
- Raw material cost inflation impact on margins
- Competition intensification in the premium motorcycle segment
- Regulatory changes in emission norms
Market Risks:
- Economic slowdown affecting discretionary spending
- Interest rate changes may impact vehicle financing
- Commodity price volatility
- Currency fluctuation impact on exports
Technical Risks:
- Breakdown below ₹5,200 could trigger selling pressure
- Volume declining during upward moves would be concerning
- Broader market correction affecting sector sentiment
- Profit booking pressure at higher levels
My Take:
Overall Assessment:
The technical setup for NSE:EICHERMOT appears constructive, with the stock maintaining its uptrend structure. The recent consolidation phase provides an opportunity for fresh accumulation. Strong fundamentals support the technical outlook with robust sales growth and market share expansion.
Investment Recommendation
Buy on dips strategy recommended for medium to long-term investors. The risk-reward profile remains favourable with multiple technical targets achievable. However, strict stop-loss discipline and position sizing are crucial for risk management.
Time Horizon:
- Short-term (1-3 months): Consolidation with upward bias
- Medium-term (3-6 months): Bullish with a target of ₹6,000
- Long-term (6-12 months): Positive outlook with potential for new highs
The combination of strong fundamentals, healthy technical setup, and favourable sector dynamics makes NSE:EICHERMOT an attractive investment proposition for quality-focused portfolios.
Keep in the Watchlist.
NO RECO. For Buy/Sell.
📌Thank you for exploring my idea! I hope you found it valuable.
🙏FOLLOW for more
👍BOOST if you found it useful.
✍️COMMENT below with your views.
Meanwhile, check out my other stock ideas on the right side until this trade is activated. I would love your feedback.
Disclaimer: "I am not a SEBI REGISTERED RESEARCH ANALYST AND INVESTMENT ADVISER."
This analysis is intended solely for informational and educational purposes and should not be interpreted as financial advice. It is advisable to consult a qualified financial advisor or conduct thorough research before making investment decisions.
Volumespreadanalysis
DMART: Technical Breakout Signals Major Rally AheadNSE:DMART Technical Breakout Signals Major Rally Ahead after news of its Entry in Uttar Pradesh as the First Store Opened in Agra.
Price Action:
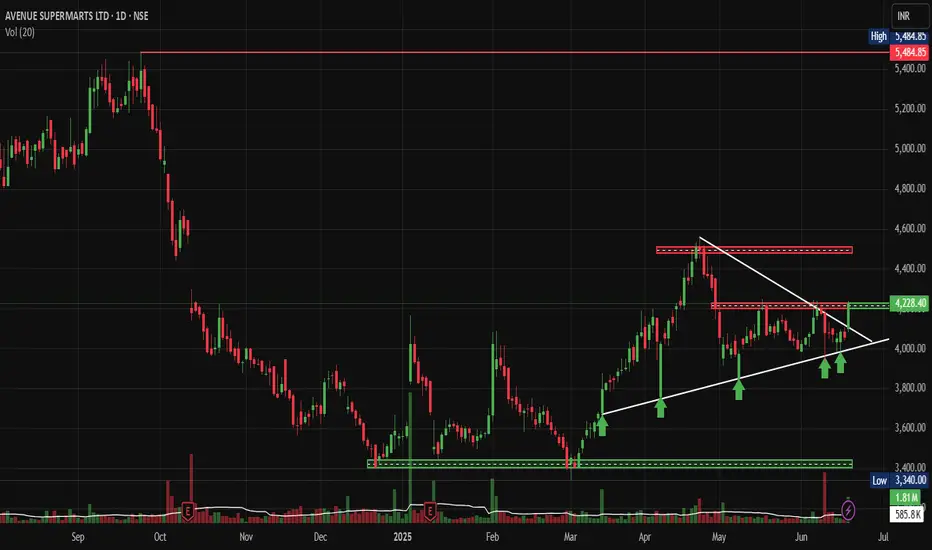
• Current Price: ₹4,228.40 (up 4.17% or ₹169.30)
• 52-Week Range: ₹3,340 (Low) to ₹5,484.85 (High)
• Stock is trading in the upper half of its annual range, showing strong momentum
• Recent price action indicates a successful breakout from the consolidation phase
Volume Spread Analysis:
• Volume spike visible during recent breakout sessions
• Above-average volume of 585.8K shares traded, confirming institutional participation
• Volume pattern supports the bullish price movement
• Higher volume on green candles indicates genuine buying interest
Key Technical Levels:
Support Levels:
• Primary Support: ₹4,100-4,150 (recent breakout level)
• Secondary Support: ₹3,900-3,950 (previous resistance turned support)
• Major Support: ₹3,600-3,700 (demand zone from March-April consolidation)
• Critical Support: ₹3,400-3,450 (psychological level and volume-based support)
Resistance Levels:
• Immediate Resistance: ₹4,400-4,450 (supply zone marked on chart)
• Major Resistance: ₹4,600-4,700 (previous swing high area)
• Target Resistance: ₹5,200-5,300 (approaching 52-week high zone)
• Ultimate Target: ₹5,484 (52-week high)
Base Formation:
• Stock formed a strong accumulation base between December 2024 and April 2025
• Base depth: Approximately 25-30% from peak to trough
• Duration: A 5-month consolidation period indicates institutional accumulation
• Base breakout occurred with strong volume confirmation in May 2025
Technical Patterns:
• Cup and Handle formation visible from October 2024 to May 2025
• Ascending triangle pattern during the consolidation phase
• Higher lows formation indicating strong underlying demand
• Breakout from falling wedge pattern in early May 2025
Trend Analysis:
• Primary Trend: Bullish (upward sloping trendline from December lows)
• Intermediate Trend: Bullish breakout from consolidation
• Short-term Trend: Strong upward momentum with minor pullback potential
Trade Setup:
Bull Case Scenario:
• Entry Strategy: Buy on dips approach recommended
• Momentum continues toward ₹4,600-4,800 levels
• Volume expansion supports further upside
• Sector rotation favouring retail stocks
Entry Levels:
• Aggressive Entry: ₹4,200-4,250 (current market price area)
• Conservative Entry: ₹4,050-4,100 (on pullback to support)
• Ideal Entry: ₹4,000-4,050 (strong support retest)
Exit Levels:
• Partial Profit Booking: ₹4,500-4,600 (book 30-40% position)
• Second Target: ₹4,800-4,900 (book another 30-40%)
• Final Target: ₹5,200-5,300 (ride remaining 20-30% position)
Stop-Loss Strategy:
• Initial Stop-Loss: ₹3,950 (below recent support)
• Trailing Stop-Loss: Trail stops by ₹150-200 as price advances
• Final Stop-Loss: ₹3,800 (if major support breaks)
Risk Management:
Position Sizing:
• Conservative Allocation: 2-3% of total portfolio
• Moderate Allocation: 3-5% of total portfolio
• Aggressive Allocation: 5-7% of total portfolio (only for high-conviction traders)
Risk Factors:
• Market volatility during the quarterly results season
• Retail sector sensitivity to economic cycles
• High valuations may limit upside potential
• Profit booking pressure near previous highs
Risk Mitigation:
• Diversify across multiple retail stocks
• Use a staggered entry approach
• Maintain strict stop-loss discipline
• Monitor sector rotation trends
Sectoral Backdrop:
Retail Sector Overview:
• The Indian retail sector is following the "Everyday Low Cost - Everyday Low Price" strategy
• Strong, organised retail penetration growth expected
• Consumer spending recovery supporting sector growth
• E-commerce competition intensifying, but offline retail remains resilient
Sector Catalysts:
• Festival season approaching (positive for retail)
• Rural consumption recovery expected
• Urban consumption remains steady
• Government policies supporting organised retail
Fundamental Backdrop:
Company Overview:
• Avenue Supermarts follows a competitive procurement, operational efficiency, and cost-effective distribution strategy
• Market Cap: ₹2,75,237 Crores with almost debt-free status
• Leading hypermarket chain with strong brand presence
Financial Performance:
• Q4 FY25: Sales of ₹14,872 crore (16.9% YoY growth)
• Revenue projected to grow 15% to ₹68,000 to ₹70,000 crore
Business Strengths:
• Strong operational efficiency and supply chain management
• Consistent store expansion strategy
• High customer loyalty and repeat business
• Strong cash generation and a debt-free balance sheet
Growth Drivers:
• New store openings in Tier-2 and Tier-3 cities
• Same-store sales growth improvement
• Category expansion and private label growth
• Digital initiatives and omnichannel presence
My Take:
NSE:DMART presents a compelling technical setup with strong fundamental backing. The stock has successfully broken out from a 5-month consolidation base with volume confirmation. Risk-reward ratio favours bulls with proper position sizing and stop-loss management. Traders should consider entering on minor pullbacks, while investors can accumulate on any meaningful corrections toward support levels.
Keep in the Watchlist.
NO RECO. For Buy/Sell.
📌Thank you for exploring my idea! I hope you found it valuable.
🙏FOLLOW for more
👍BOOST if you found it useful.
✍️COMMENT below with your views.
Meanwhile, check out my other stock ideas on the right side until this trade is activated. I would love your feedback.
Disclaimer: "I am not a SEBI REGISTERED RESEARCH ANALYST AND INVESTMENT ADVISER."
This analysis is intended solely for informational and educational purposes and should not be interpreted as financial advice. It is advisable to consult a qualified financial advisor or conduct thorough research before making investment decisions.
MGL: Rising Wedge Breakout Sets Stage for Explosive RallyNSE:MGL : Rising Wedge Breakout Sets Stage for Explosive Rally after management guidance of double-digit volume growth for the next three to four years.
Price Action Analysis:
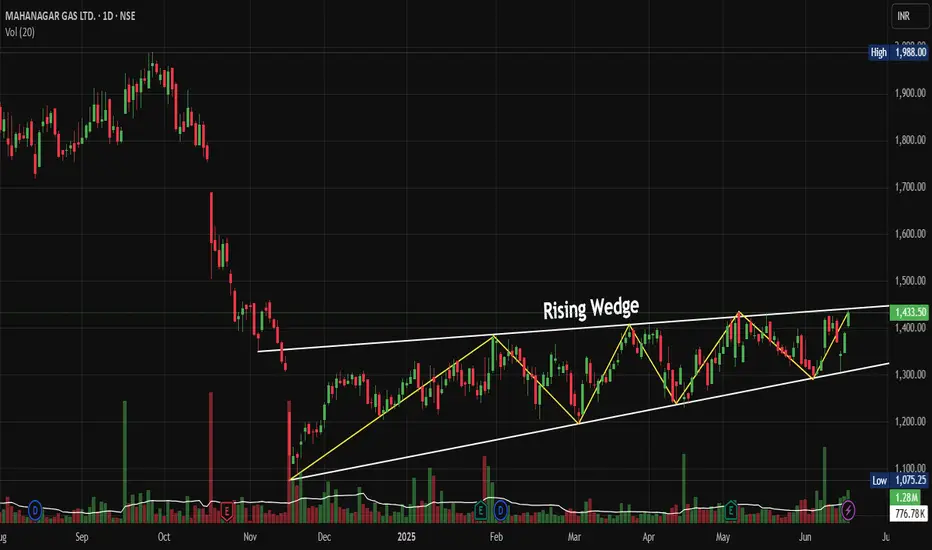
• Stock has formed a classic Rising Wedge pattern from November 2024 lows around 1,075 to current levels near 1,433
• The wedge shows converging trendlines with higher highs and higher lows, typical of consolidation before a breakout
• Recent breakout above the upper trendline around 1,400 levels confirms bullish momentum
• Price has rallied 33% from the wedge base, indicating strong underlying demand
Volume Spread Analysis:
• Volume spikes are visible during key breakout moments, particularly in recent sessions
• Higher volume on up days compared to down days suggests institutional accumulation
• Volume expansion during the wedge breakout confirms genuine buying interest
• Recent green volume bars indicate sustained buying pressure supporting the uptrend
Key Technical Levels:
Support Levels:
• Immediate support at 1,380-1,400 (previous resistance turned support)
• Secondary support at 1,300 (middle of the rising wedge)
• Major support at 1,200-1,250 (lower trendline of the wedge)
• Critical support at 1,075 (November 2024 lows)
Resistance Levels:
• Immediate resistance at 1,450-1,470 (psychological levels)
• Next resistance at 1,500 (round number resistance)
• Extended target at 1,600-1,650 based on wedge height projection
• 52-Week high resistance around 1,988 (historical peak)
Technical Patterns:
• Rising Wedge pattern near to completion with successful breakout
• Multiple higher highs and higher lows confirming uptrend structure
• Potential cup and handle formation on longer timeframes
• Bullish flag consolidation patterns within the broader uptrend
Trade Setup:
Entry Strategy:
• Primary entry on pullback to 1,400-1,420 levels (retest of breakout zone)
• Aggressive entry at the current market price of around 1,433 for momentum players
• Scale-in approach: 50% at 1,420, 25% at 1,380, 25% at 1,350
Exit Levels:
• First target: 1,500 (16% upside from current levels)
• Second target: 1,600 (22% upside potential)
• Extended target: 1,700-1,750 for long-term holders
• Trailing stop-loss strategy recommended above 1,500 levels
Stop-Loss Placement:
• Conservative stop-loss: 1,320 (below wedge support)
• Aggressive stop-loss: 1,380 (below immediate support)
• Risk-reward ratio of 1:2 to 1:3 depending on entry and exit points
Position Sizing and Risk Management:
• Allocate a maximum of 2-3% of the portfolio to a single position
• Use a 1% risk per trade rule based on stop-loss distance
• Consider partial profit booking at 1,500 levels
• Maintain position size discipline to avoid overexposure
Sectoral and Fundamental Backdrop:
Sector Analysis:
• City Gas Distribution (CGD) sector showing resilience amid energy transition
• The government push for clean fuel adoption, supporting the natural gas demand
• Infrastructure expansion in tier-2 and tier-3 cities benefiting CGD companies
• Regulatory environment remains supportive with steady tariff mechanisms
Fundamental Strengths:
• NSE:MGL operates in prime Mumbai and adjoining areas with stable demand
• Strong cash flows from residential and industrial customer base
• Consistent dividend-paying track record with healthy payout ratios
• Robust balance sheet with minimal debt and strong return on equity
• Expanding PNG and CNG network, providing growth visibility
Key Catalysts:
• Increasing vehicle conversion to CNG, supporting volume growth
• Industrial demand recovery post-pandemic is driving commercial sales
• Government policies favouring cleaner fuel alternatives
• Potential for geographical expansion into new license areas
Risk Factors:
• Crude oil price volatility is affecting input costs
• Competition from electric vehicles in the transportation segment
• Regulatory changes in gas pricing mechanisms
• Economic slowdown impacting industrial demand
My Take:
The technical setup suggests NSE:MGL is well-positioned for continued upward momentum following the rising wedge breakout. The combination of strong fundamentals, supportive sector dynamics, and bullish technical patterns creates an attractive risk-reward proposition for both swing and positional traders. However, traders should remain disciplined with position sizing and risk management given the stock's premium valuation at current levels.
Keep in the Watchlist.
NO RECO. For Buy/Sell.
📌Thank you for exploring my idea! I hope you found it valuable.
🙏FOLLOW for more
👍BOOST if you found it useful.
✍️COMMENT below with your views.
Meanwhile, check out my other stock ideas on the right side until this trade is activated. I would love your feedback.
Disclaimer: "I am not a SEBI REGISTERED RESEARCH ANALYST AND INVESTMENT ADVISER."
This analysis is intended solely for informational and educational purposes and should not be interpreted as financial advice. It is advisable to consult a qualified financial advisor or conduct thorough research before making investment decisions.
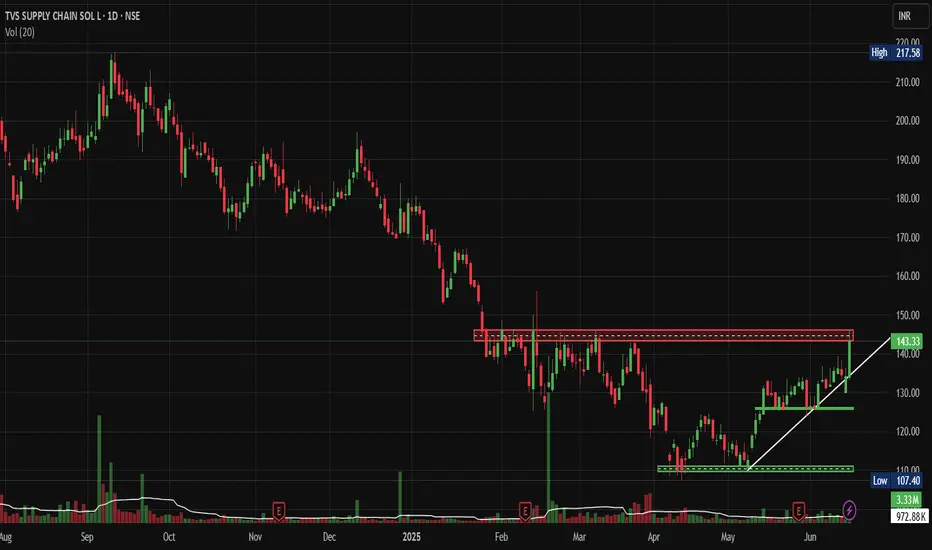
TVS Supply Chain: BO attempt after 6 Month Consolidation.This Supply Chain Giant is attempting to break out. After 6 Months of Consolidation - Is it Time to Load Up? Let's analyse today's Idea.
Price Action Analysis:
Current Market Structure:
• Stock is currently trading at ₹143.33, showing a strong +6.83% gain
• Price has broken above a key resistance zone around the ₹140 level
• Clear uptrend formation with a higher highs and higher lows pattern emerging
• Recent breakout attempt from a prolonged consolidation phase
Historical Price Movement:
• Stock witnessed a sharp decline from highs of ₹217+ in late 2024 to lows around ₹107
• Extended consolidation phase from February to May 2025 between ₹110-145 levels
• Current breakout attempt suggests potential trend reversal from bearish to bullish
Volume Spread Analysis:
Volume Characteristics:
• Significant volume spike visible during the recent breakout session
• Volume of 3.33M is substantially higher than the 20-day average of 972.88K
• Volume confirmation supporting the price breakout attempt above resistance
• Previous volume spikes coincided with major price movements
Volume Price Relationship:
• Healthy volume-price relationship during the current upward move
• Relatively lower volumes accompanied earlier decline phases
• Current breakout attempt volume suggests institutional participation
Key Technical Levels:
Support Levels:
• Primary Support: ₹130-132 (previous resistance turned support)
• Secondary Support: ₹120-125 (consolidation zone low)
• Major Support: ₹110-115 (multi-month consolidation bottom)
Resistance Levels:
• Immediate Resistance: ₹150-155 (psychological level)
• Medium-term Resistance: ₹165-170 (previous swing high)
• Major Resistance: ₹185-190 (Fibonacci retracement level)
Base Formation:
• Rectangle consolidation pattern formed between ₹110-145 levels
• Base duration: Approximately 4-5 months (February to May 2025)
• Breakout from this base suggests potential for sustained upward movement
Technical Patterns:
Primary Patterns:
• Rectangle/Box pattern completion with upward breakout attempt
• Potential inverse head and shoulders pattern on a longer timeframe
• Ascending triangle formation in recent weeks before the breakout
Trend Analysis:
• Short-term trend: Bullish (breakout confirmed)
• Medium-term trend: Transitioning from bearish to bullish
• Long-term trend: Still in recovery phase from major decline
Trade Setup and Strategy:
Entry Strategy:
• Aggressive Entry: ₹143-145 (current levels on any minor pullback)
• Conservative Entry: ₹135-138 (on retest of breakout level)
• Volume confirmation is required for any entry
Position Sizing:
• Risk 1-2% of portfolio capital on this trade
• Position size calculation: Portfolio Value × Risk % ÷ Stop Loss Distance
• Example: For ₹1,00,000 portfolio with 2% risk = ₹2,000 risk capital
Risk-Reward Calculation:
• Risk-Reward Ratio: Minimum 1:2 preferred
• Expected risk per share: ₹15-20 based on stop loss placement
• Potential reward: ₹30-40 per share to the first target
Exit Strategy:
Profit Targets:
• Target 1: ₹165-170 (15-20% upside) - Book 40% position
• Target 2: ₹185-190 (30-35% upside) - Book 40% position
• Target 3: ₹200+ (40 %+ upside) - Trail remaining 20% position
Stop Loss Levels:
• Initial Stop Loss: ₹125-128 (below consolidation support)
• Trailing Stop: Move to breakeven once Target 1 is achieved
• Final Trail: Use 10-day EMA or ₹10-15 trailing stop
Risk Management Framework:
Risk Control Measures:
• Maximum loss per trade: 2% of total capital
• Position sizing based on stop loss distance
• No averaging down if the trade goes against the initial thesis
• Exit if the technical structure breaks down
Portfolio Allocation:
• Maximum exposure to single stock: 5-8% of portfolio
• Sector allocation limit: 15-20% to logistics/supply chain
• Maintain diversification across market caps and sectors
Sectoral Analysis:
Logistics and Supply Chain Sector:
• The sector has shown resilience post-pandemic disruptions
• Growing e-commerce and digitalization are driving demand
• Government infrastructure push benefiting logistics companies
• Increasing focus on supply chain optimization across industries
Sector Positioning:
• NSE:TVSSCS is positioned in the growing third-party logistics market
• Beneficiary of Make in India and manufacturing growth
• Automotive sector recovery supporting the company's core business
Fundamental Backdrop:
Business Overview:
• Leading third-party logistics and supply chain solutions provider
• Strong presence in automotive, consumer goods, and industrial sectors
• Integrated service offerings including warehousing, transportation, and value-added services
Growth Drivers:
• Expansion in new geographies and service offerings
• Technology-driven efficiency improvements
• Growing outsourcing trend in supply chain management
• Recovery in the automotive sector supporting traditional business
Market Outlook and Catalysts:
Positive Catalysts:
• New client acquisitions and contract wins
• Capacity expansion announcements
• Favourable government policies for the logistics sector
Risk Factors:
• Economic slowdown affecting industrial demand
• Fuel price volatility is impacting transportation costs
• Competitive pricing pressure in the logistics industry
• Global supply chain disruptions
My Take:
TVS Supply Chain Solutions presents a compelling technical setup with the recent breakout attempt from a multi-month consolidation. The combination of strong volume confirmation, supportive sectoral trends, and improving fundamental backdrop makes this an attractive opportunity for Short to medium-term investors. However, proper risk management and position sizing remain crucial for the successful execution of this trade setup.
Keep in the Watchlist.
NO RECO. For Buy/Sell.
📌Thank you for exploring my idea! I hope you found it valuable.
🙏FOLLOW for more
👍BOOST if you found it useful.
✍️COMMENT below with your views.
Meanwhile, check out my other stock ideas on the right side until this trade is activated. I would love your feedback.
Disclaimer: "I am not a SEBI REGISTERED RESEARCH ANALYST AND INVESTMENT ADVISER."
This analysis is intended solely for informational and educational purposes and should not be interpreted as financial advice. It is advisable to consult a qualified financial advisor or conduct thorough research before making investment decisions.
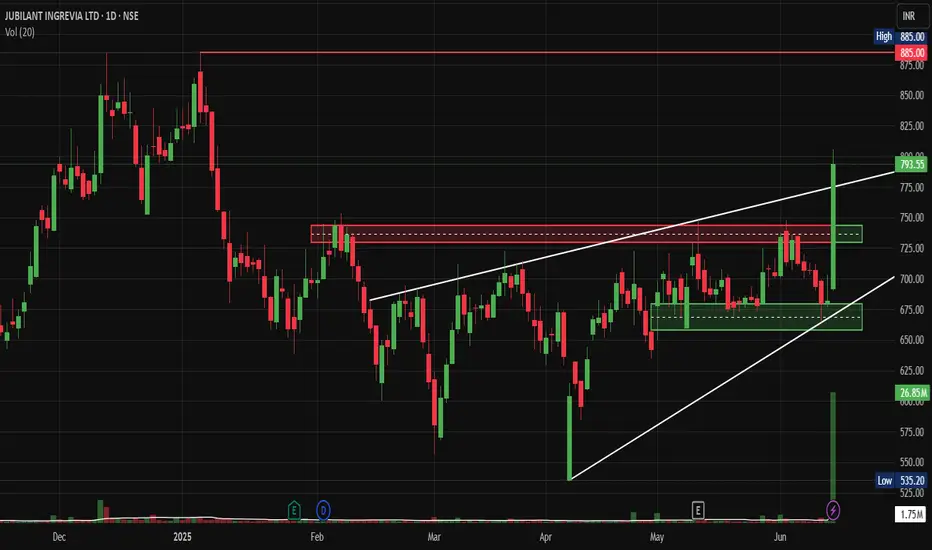
Jubilant Ingrevia: Broke Out after Stake Sell from PromotersNSE:JUBLINGREA Just Broke Out Big after Prabhudas Lilladher gave Hold Rating with a target of Rs 713 and Stake Sell from Promoters
Technical Chart Pattern:
• The stock displays a classic ascending triangle pattern formation spanning from February to June 2025
• Multiple higher lows connected by an ascending trend line (white diagonal support)
• Horizontal resistance zone around ₹735-740 levels acting as the upper boundary
• Recent breakout above the triangle pattern with strong volume confirmation
Key Support and Resistance Levels:
• Primary Support: ₹675-685 (previous resistance turned support)
• Secondary Support: ₹650-660 (trend line support)
• Major Support: ₹535-550 (swing low from March)
• Immediate Resistance: ₹800-810 (psychological level)
• Major Resistance: ₹885 (all-time high marked on chart)
Base Formation Analysis:
• Well-defined base formation between ₹650-740 levels over 4 months
• The consolidation phase showed declining volatility, indicating accumulation
• Multiple tests of resistance at ₹735-740 showing supply absorption
• Base depth of approximately 15-20% from the highs, indicating healthy correction.
Volume Spread Analysis:
Volume Characteristics:
• Significant volume spike during the recent breakout (26.85M vs average 1.75M)
• Volume expansion during upward moves and contraction during pullbacks
• Strong institutional participation is evident from the volume profile
• Volume-price correlation remains positive, supporting the uptrend
Volume Indicators:
• Above-average volume during breakout confirms genuine demand
• Recent sessions show sustained higher volumes, indicating continued interest
• No distribution patterns are visible in volume analysis
Trade Setup:
Entry Strategy:
• Primary Entry: ₹790-800 on any pullback to the breakout zone
• Aggressive Entry: Current market price around ₹799 with tight stops
• Conservative Entry: Wait for retest of ₹740-750 resistance-turned-support
• Scale-in approach recommended given the momentum
Exit Levels:
• Target 1: ₹850 (measuring the triangle height projection)
• Target 2: ₹885 (previous all-time high)
• Target 3: ₹920-950 (extended projection based on base depth)
• Trail stops above ₹850 for position management
Stop Loss Placement:
• Initial Stop Loss: ₹735 (below breakout level)
• Revised Stop Loss: ₹750 (after first target achievement)
• Final Stop Loss: ₹780 (trailing stop for remaining position)
Risk Management Framework:
Position Sizing Guidelines:
• Risk 1-2% of portfolio capital per trade
• Position size calculation: (Account Size × Risk %) ÷ (Entry Price - Stop Loss)
• Maximum position should not exceed 3-5% of the total portfolio
• Consider reducing the size given recent volatility expansion
Risk Control Measures:
• Maintain risk-reward ratio of a minimum of 1:2
• Use partial profit booking at predetermined levels
• Avoid averaging down below stop loss levels
• Monitor sector rotation and market sentiment
Fundamental and Sectoral Backdrop:
Company Overview:
• Jubilant Ingrevia operates in Speciality Chemicals, Nutrition and Health Solutions, and Chemical Intermediates segments
• Global provider serving pharmaceutical, nutrition, agrochemical, and consumer industries with a focus on quality and customization
• Serves 15 of the top 20 Global Pharma & 7 of the top 10 Global Agrochemical companies as a leading low-cost provider
Recent Financial Performance:
• Net profit jumped 153.16% year-over-year to ₹74.05 Cr in Q4 2024-2025
• Q4 2025 revenue of 1,051 cr. down from INR1,074 cr. in Q4 FY24 with EBITDA of INR148 crores showing 42% year-on-year rise
• Market capitalization of 12,664 Cr. with trailing twelve-month revenue of 4,178 Cr.
Sectoral Dynamics:
• The speciality chemicals sector is benefiting from the China+1 strategy
• Increasing demand for pharmaceutical intermediates post-COVID
• The government push for self-reliance in chemical manufacturing
• Export opportunities in agrochemical intermediates are expanding globally
Key Fundamentals:
• The company shows a low return on equity of 9.24% over the last 3 years
• Analyst average share price target of ₹735
• Strong client base with global pharmaceutical and agrochemical giants
• Diversified product portfolio, reducing concentration risk
Market Outlook and Catalysts:
Positive Catalysts:
• Expansion in speciality chemicals capacity
• New product launches in the nutrition segment
• Increasing penetration in international markets
• Potential margin expansion through product mix improvement
Risk Factors:
• Raw material price volatility
• Regulatory changes in target markets
• Currency fluctuation impact on exports
• Competition from Chinese manufacturers
My Take:
This technical setup presents a compelling opportunity with the stock breaking out of a well-defined pattern, supported by strong fundamentals and favourable sector dynamics. The risk-reward profile appears attractive for traders and investors willing to manage position size appropriately.
Keep in the Watchlist.
NO RECO. For Buy/Sell.
📌Thank you for exploring my idea! I hope you found it valuable.
🙏FOLLOW for more
👍BOOST if you found it useful.
✍️COMMENT below with your views.
Meanwhile, check out my other stock ideas on the right side until this trade is activated. I would love your feedback.
Disclaimer: "I am not a SEBI REGISTERED RESEARCH ANALYST AND INVESTMENT ADVISER."
This analysis is intended solely for informational and educational purposes and should not be interpreted as financial advice. It is advisable to consult a qualified financial advisor or conduct thorough research before making investment decisions.
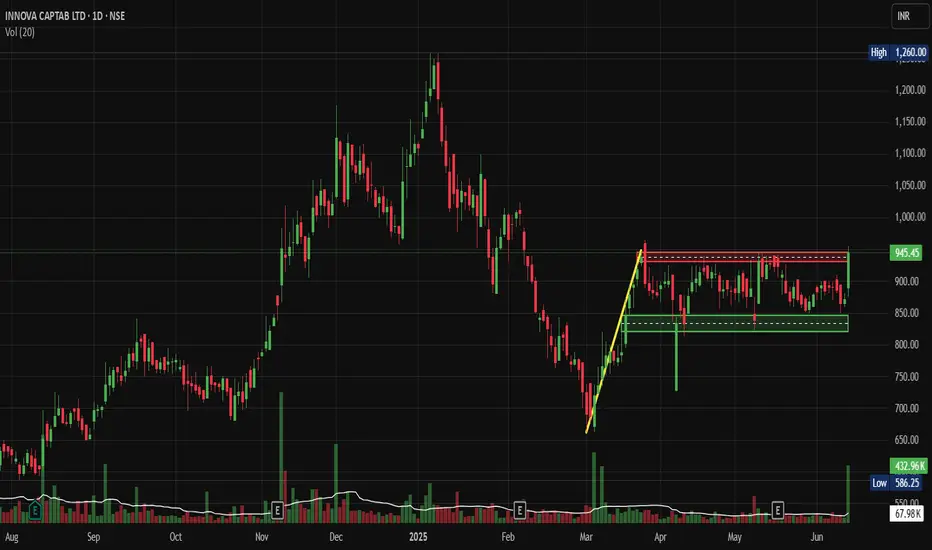
Innova Captab: Flag & Pole BO Pattern Could Signal Major Moves.NSE:INNOVACAP : This Pharma Stock's Flag & Pole Breakout Pattern Could Signal Major Moves Ahead
Price Action Analysis:
- Current Price: 945.45 INR (up 8.44% from previous close)
- 52-week Range: 586.25 (Low) to 1,260.00 (High)
- Stock has been consolidating in a rectangular pattern between 800-950 levels since March 2025
- Recent breakout above 945 resistance suggests renewed bullish momentum
- Price action shows a higher low formation, indicating underlying strength
Volume Analysis:
- Volume spikes coincide with price breakouts, confirming genuine moves
- Recent sessions show above-average volume supporting the current breakout
- Volume pattern suggests institutional participation during key price levels
- Low volume during consolidation phases indicates healthy profit-taking
Technical Patterns and Levels:
Base Formation:
- Primary base established around 800-850 levels from March to May 2025
- Secondary base forming at 650-700 levels (February 2025 low)
- Base shows characteristics of accumulation with controlled selling pressure
Key Support Levels:
- Immediate Support: 900-920 range
- Strong Support: 850-870 zone (previous resistance turned support)
- Major Support: 800 psychological level
- Critical Support: 750 (major trend line support)
Key Resistance Levels:
- Immediate Resistance: 970-980 zone
- Key Resistance: 1,050-1,100 (previous distribution area)
- Major Resistance: 1,200-1,260 (all-time high zone)
Technical Patterns:
- Rectangular consolidation pattern (March-May 2025)
- Flag & Pole Pattern (March Low's Then Consolidation)
- RSI showing positive divergence during recent consolidation
Trade Setup:
Long Position Setup:
- Entry Strategy: Breakout above 950 with volume confirmation
- Momentum Entry: 955-960 on sustained breakout
- Retracement Entry: 920-930 on any pullback to support
Entry Levels:
- Aggressive Entry: 950-955 (immediate breakout)
- Conservative Entry: 920-925 (pullback to support)
- Swing Entry: 900-910 (deeper retracement)
Exit Levels:
- Target 1: 1,020-1,050 (11-15% upside)
- Target 2: 1,150-1,200 (25-30% upside)
- Target 3: 1,350-1,400 (45-50% extension target)
Stop-Loss Strategy:
- For breakout trades: 920 (tight stop)
- For swing positions: 880 (wider stop)
- Trail stops above each support level as price advances
Position Sizing:
- Conservative approach: 2-3% of portfolio
- Moderate risk: 4-5% of portfolio
- Aggressive traders: 6-8% maximum allocation
Risk Management:
- Risk-reward ratio: Minimum 1:2 preferred
- Maximum loss per trade: 3-4% from entry
- Scale out profits at resistance levels
- Use trailing stops to protect gains
- Monitor sector rotation and market sentiment
Sectoral and Fundamental Backdrop:
Pharmaceutical Sector Overview:
- Indian pharma sector peers include Sun Pharmaceutical, Divis Laboratories, Cipla, Torrent Pharmaceuticals, and Mankind Pharma
- CDMO (Contract Development and Manufacturing Organization) segment showing strong growth
- Regulatory environment favourable for quality manufacturers
- Export opportunities in generic formulations are expanding
Company Fundamentals:
- Market Cap: 5,450 Crore (up 92.2% in 1 year)
- Revenue: 1,244 Cr with Profit: 128 Cr
- Founded in 2006, focused on CDMO services for pharmaceutical formulations
- Annual revenue growth of 17% with a healthy pre-tax margin of 13.74%
- ROE of 14.3% and reasonable debt-to-equity of 35%
Business Segments:
- Provides CDMO services to Indian pharmaceutical companies
- Operates domestic branded generic business and international branded generics
- Integrated presence across the pharmaceutical value chain, including R&D, manufacturing, distribution, and exports
Key Strengths:
- Stable promoter holding at 50.9%
- 19.8% YoY increase in Sales in Q4FY25
- Strong manufacturing capabilities in Baddi, Himachal Pradesh
- Diversified revenue streams across domestic and international markets
Risk Factors:
- The company is not paying dividends despite repeated profits
- Regulatory risks in the pharmaceutical sector
- Competition from larger pharma companies
- Currency fluctuation impact on export revenues
- Dependence on raw material imports
My Take:
This technical setup of Flag & Pole suggests a potential medium-term opportunity with proper risk management, though investors should monitor both technical levels and fundamental developments closely.
Keep in the Watchlist.
NO RECO. For Buy/Sell.
📌Thank you for exploring my idea! I hope you found it valuable.
🙏FOLLOW for more
👍BOOST if you found it useful.
✍️COMMENT below with your views.
Meanwhile, check out my other stock ideas on the right side until this trade is activated. I would love your feedback.
Disclaimer: "I am not a SEBI REGISTERED RESEARCH ANALYST AND INVESTMENT ADVISER."
This analysis is intended solely for informational and educational purposes and should not be interpreted as financial advice. It is advisable to consult a qualified financial advisor or conduct thorough research before making investment decisions.
Dhani BO: Ready for Its Next Rally After 80% Correction?NSE:DHANI Breakout: Is This Med/Fin Tech Stock Ready for Its Next Rally After 80% Correction?
Price Action Overview:
- Stock has undergone a significant correction from highs of ₹109.88 to lows of ₹47.05, representing nearly a 57% decline
- Currently trading at ₹71.09 with recent bullish momentum showing +14.42% gains
- Price action suggests a potential bottoming process after prolonged consolidation
Volume Spread Analysis:
- Significant volume spikes observed during major price movements
- Recent breakout accompanied by above-average volume (4.22M vs average 30.03M)
- Volume concentration during earnings announcements (marked 'E' on the chart) indicates institutional participation
- Higher volume during recent uptick suggests renewed interest
Key Technical Levels:
Support Levels:
- Primary Support: ₹50-52 zone (previous consolidation area)
- Secondary Support: ₹47.05 (absolute low)
- Immediate Support: ₹62-65 (recent breakout zone)
Resistance Levels:
- Immediate Resistance: ₹82.71 (marked horizontal level)
- Major Resistance: ₹96.79-₹109.88 (previous highs zone)
- Intermediate Resistance: ₹75-78 (previous resistance turned support)
Base Formation:
- Extended consolidation base formed between ₹50-₹68 over 4-5 months
- Classic rectangle/range-bound pattern with multiple tests of support and resistance
- Recent breakout from the upper boundary of this base suggests the completion of the accumulation phase.
Technical Patterns:
- Descending triangle pattern from February to April 2025
- Internal Flag & Pole Breakout
- Recent breakout from the consolidation rectangle
- Potential inverse head and shoulders formation on smaller timeframes
- Rising volume during breakout confirms pattern validity
Trade Setup:
Entry Strategy:
- Primary Entry: ₹68-₹70 (on pullback to breakout level)
- Aggressive Entry: Current levels ₹71-₹72 (momentum play)
- Conservative Entry: ₹65-₹67 (retest of breakout zone)
Exit Levels:
- Target 1: ₹82-₹85 (immediate resistance zone) - Risk: Reward 1:2
- Target 2: ₹95-₹98 (major resistance area) - Risk: Reward 1:3.5
- Target 3: ₹110-₹115 (previous highs extension) - Risk: Reward 1:4.5
Stop Loss:
- Conservative Stop: ₹62 (below recent consolidation)
- Aggressive Stop: ₹58 (below key support cluster)
- Trailing Stop: Implement an 8-10% trailing stop after the first target achievement
Position Sizing:
- Risk per trade: Maximum 2% of portfolio
- Position size calculation: Portfolio value × 2% ÷ (Entry price - Stop loss)
- For ₹1,00,000 portfolio with ₹70 entry and ₹62 stop: Position size = ₹2,000 ÷ ₹8 = 250 shares
Risk Management:
- Maximum exposure to single stock: 5% of total portfolio
- Sector exposure limit: 15% to financial services
- Use of stop-loss orders mandatory
- Position review after every 10% move in either direction
- Risk-reward ratio minimum 1:2 for all trades
Sectoral Backdrop:
Fintech Sector Overview:
- Digital lending sector experiencing regulatory scrutiny, but long-term growth prospects intact
- Increasing digital adoption post-pandemic, supporting fintech growth
- RBI guidelines on digital lending create compliance costs but also barriers to entry
- Consolidation is expected in the sector, favouring established players
Industry Trends:
- Growing smartphone penetration is driving digital financial services adoption
- The government push for financial inclusion through digital means
- Rising interest rates are impacting borrowing costs but improving net interest margins
- Increasing focus on data analytics and AI-driven lending decisions
Fundamental Backdrop:
Company Overview:
- Dhani Services operates in the digital financial services space
- Diversified business model including lending, insurance, and investment services
- Strong technology platform enabling scalable operations
- Focus on serving underbanked population segments
Recent Developments:
- Quarterly earnings showing revenue growth trajectory
- Management focuses on improving asset quality and reducing NPAs
- Strategic partnerships for expanding product offerings
- Regulatory compliance improvements undertaken
Financial Health Indicators:
- Need to monitor debt-to-equity ratios given the lending business nature
- Asset quality metrics are crucial for long-term sustainability
- Revenue diversification, reducing dependence on single income streams
- Technology investments supporting operational efficiency
Catalyst Factors:
- Potential regulatory clarity on digital lending norms
- Expansion of credit underwriting capabilities
- Strategic alliances or acquisition opportunities
- Improved economic conditions support loan demand
Risk Factors:
- Regulatory changes in the fintech space
- Competition from established banks entering the digital space
- Credit risk in unsecured lending segments
- Technology and cybersecurity risks
- Dependence on external funding for growth capital
My Take:
This technical setup suggests a potential medium-term opportunity with proper risk management, though investors should monitor both technical levels and fundamental developments closely.
Keep in the Watchlist.
NO RECO. For Buy/Sell.
📌Thank you for exploring my idea! I hope you found it valuable.
🙏FOLLOW for more
👍BOOST if you found it useful.
✍️COMMENT below with your views.
Meanwhile, check out my other stock ideas on the right side until this trade is activated. I would love your feedback.
Disclaimer: "I am not a SEBI REGISTERED RESEARCH ANALYST AND INVESTMENT ADVISER."
This analysis is intended solely for informational and educational purposes and should not be interpreted as financial advice. It is advisable to consult a qualified financial advisor or conduct thorough research before making investment decisions.
DLong

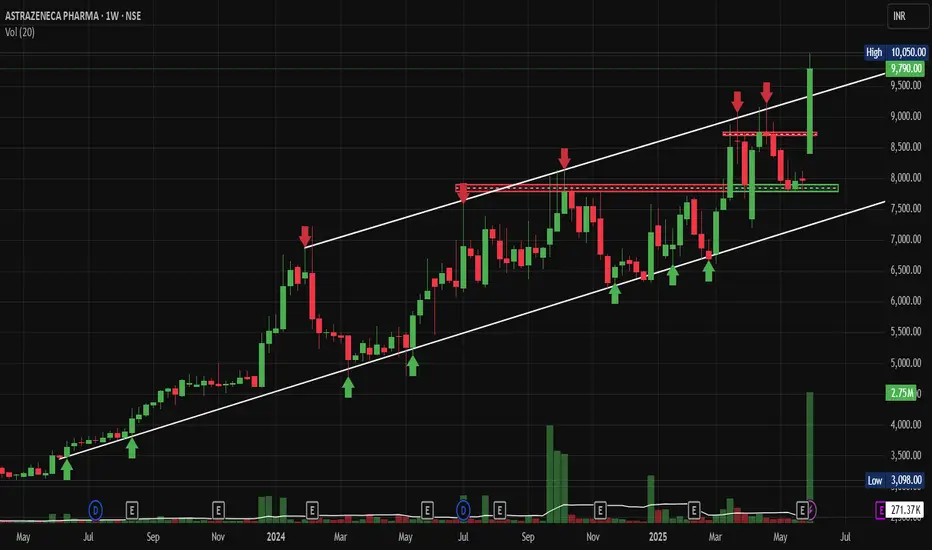
AstraZeneca Breakout Above 10000 Could Signal Next Leg, Post Q4NSE:ASTRAZEN Breakout Above 10000 Could Signal Next Leg, Post Spectacular Q4 and FY25 Numbers. Breaking out of Rising Channel, hence selected for this Week's "Chart of the WEEK"
Price Action Analysis:
• Stock has been in a strong uptrend since May 2024, rising from around 3000 levels to current levels near 9800
• Recent price action shows consolidation between the 7500-8500 levels with multiple tests of resistance
• Current price at 9409 represents a +22.80% gain, showing strong momentum
• Volume spike visible in recent sessions at 2.75M shares vs average, indicating institutional interest
• Price structure shows a higher highs and higher lows pattern intact.
Key Support and Resistance Levels:
• Primary Support: 8000-8200 zone (previous resistance turned support)
• Secondary Support: 7500-7600 (multiple bounce zone)
• Key Resistance: 8500-8600 (red horizontal line showing multiple rejections)
• Breakout Resistance: 9000 psychological level
• Current High: 10,950 acting as immediate resistance
Base Formation and Patterns:
• Rectangle consolidation pattern formed between 7500-8500 from September 2024 to March 2025
• Bullish flag pattern visible after the breakout above 8500
• Ascending triangle formation with higher lows and flat resistance around 8500
• Volume expansion during breakout confirms pattern validity
Technical Indicators:
• Strong upward-trending channel maintained since mid-2024
• Price trading above all major moving averages
• Momentum appears to be building after the recent consolidation phase
• Volume profile shows accumulation during base formation
Trade Setup:
Entry Strategy:
• Primary Entry: On pullback to 8800-9000 support zone
• Aggressive Entry: Current market price around 9400 for momentum play
• Conservative Entry: Wait for retest of 8500 breakout level
Exit Levels:
• Target 1: 10,500 (psychological resistance)
• Target 2: 11,200 (measured move from rectangle pattern)
• Target 3: 12,000 (extension target based on trend channel)
Risk Management:
• Stop Loss: 8200 for entries around 9000 (tight stop)
• Stop Loss: 7800 for swing positions (wider stop)
• Position Size: Risk 1-2% of portfolio per trade
• Risk-Reward Ratio: Minimum 1:2 for all entries
Position Sizing Guidelines:
• For 1% risk: Calculate position size based on distance to stop loss
• Maximum exposure: 3-5% of portfolio in a single stock
• Scale in approach: 50% on initial entry, 30% on pullback, 20% on confirmation
Sectoral and Fundamental Backdrop:
Pharmaceutical Sector Overview:
• Indian pharma sector benefiting from global generic drug demand
• Regulatory approvals and US FDA compliance driving growth
• Export-oriented companies are seeing currency tailwinds
• Increased healthcare spending post-pandemic, supporting sector growth
AstraZeneca Pharma Fundamentals:
• Strong presence in oncology and respiratory segments
• Robust pipeline of innovative drugs and biosimilars
• Strategic partnerships with global pharmaceutical companies
• Consistent revenue growth and expanding market share in India
• Strong balance sheet with healthy cash flows
Market Dynamics:
• Institutional buying is visible through increased volumes
• FII interest in pharmaceutical stocks remains positive
• Sector rotation favouring defensive healthcare plays
• Government initiatives supporting pharmaceutical manufacturing
Risk Factors:
Technical Risks:
• High volatility near resistance levels
• Potential for false breakouts given extended rally
• Volume confirmation required for sustained moves
• Overbought conditions in the short term
Fundamental Risks:
• Regulatory changes in pharmaceutical pricing
• Currency fluctuation impact on export revenues
• Competition from generic drug manufacturers
• Global economic slowdown affecting healthcare spending
Market Risks:
• Overall market correction could impact individual stocks
• Sector rotation away from pharmaceuticals
• Profit booking by institutional investors
• Global pharmaceutical industry headwinds
My Take:
NSE:ASTRAZEN presents a compelling technical setup with a clear breakout above long-term resistance. The stock's strong fundamentals post Q4 and FY25, combined with favourable sector dynamics, make it an attractive investment opportunity. However, risk management remains crucial given the extended nature of the current rally. Traders should consider scaling into positions on pullbacks while maintaining strict stop-loss discipline.
Keep in the Watchlist.
NO RECO. For Buy/Sell.
📌Thank you for exploring my idea! I hope you found it valuable.
🙏FOLLOW for more
👍BOOST if you found it useful.
✍️COMMENT below with your views.
Meanwhile, check out my other stock ideas on the right side until this trade is activated. I would love your feedback.
Disclaimer: "I am not a SEBI REGISTERED RESEARCH ANALYST AND INVESTMENT ADVISER."
This analysis is intended solely for informational and educational purposes and should not be interpreted as financial advice. It is advisable to consult a qualified financial advisor or conduct thorough research before making investment decisions.
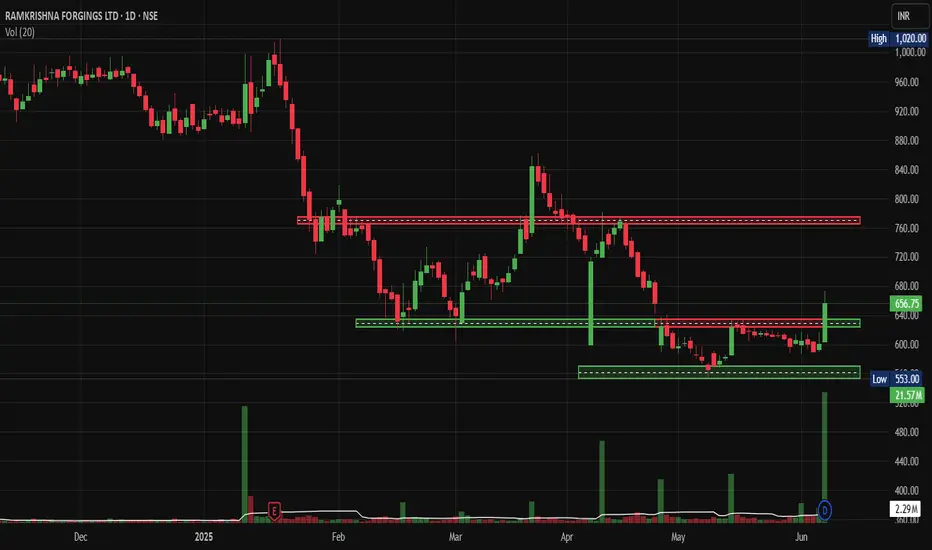
RKF Massive Breakout After 6-Month Consolidation.NSE:RKFORGE Hidden Auto Component Gem Ready for Massive Breakout After 6-Month Consolidation, after Breaking out Today With King Candle and Volumes.
Price Action:
- Current Price: ₹656.75 (+9.37% gain)
- Trading Range: ₹553.00 - ₹1,020.00
- Market Cap Category: Mid-cap stock with decent liquidity
- Chart Pattern: Extended consolidation phase with recent breakout attempt
Support and Resistance Levels
- Primary Resistance: ₹760-780 zone (red horizontal line)
- Secondary Resistance: ₹1,020 (previous high)
- Immediate Support: ₹620-640 zone
- Major Support: ₹553-580 zone (green horizontal rectangle)
- Critical Support: ₹553 (52-week low)
Base Formation:
- Base Type: Rectangle/Sideways consolidation base
- Duration: Approximately 6 months (January 2025 to June 2025)
- Base Depth: ~45% correction from highs
- Base Quality: Tight consolidation with reduced volatility
- Breakout Characteristics: Recent volume spike suggests potential base completion
Technical Patterns:
- Rectangle Pattern: Clear horizontal support and resistance boundaries
- Volume Accumulation: Declining volume during consolidation, spike on recent move
- Flag Formation: Potential bull flag pattern forming at current levels
- Double Bottom: Possible formation around ₹553-580 support zone
Volume Spread Analysis
- Volume Characteristics: 21.57M shares traded (above average)
- Volume Pattern: Higher volume on up days, lower on down days
- *Accumulation Signs: Volume spike coinciding with price breakout attempt
- Volume Confirmation: Recent breakout supported by increased participation
Trade Setup:
Entry Strategy:
- Primary Entry: ₹650-665 (current levels on pullback)
- Aggressive Entry: ₹680-690 (on breakout above resistance)
- Conservative Entry: ₹620-630 (on retest of support)
Exit Levels:
- Target 1: ₹750-760 (15% upside)
- Target 2: ₹850-880 (30% upside)
- Target 3: ₹980-1,000 (50% upside)
Stop Loss Levels:
- Tight Stop: ₹620 (5% risk)
- Swing Stop: ₹580 (12% risk)
- Position Stop: ₹550 (16% risk)
Position Sizing:
- Conservative Allocation: 2-3% of portfolio
- Moderate Allocation: 4-5% of portfolio
- Aggressive Allocation: 6-8% of portfolio (for risk-tolerant investors)
Risk Management:
- Risk-Reward Ratio: Minimum 1:2 for all entries
- Portfolio Risk: Maximum 2% portfolio risk per position
- Position Monitoring: Weekly review of technical levels
- Profit Booking: 25% at Target 1, 50% at Target 2, remainder at Target 3
Sectoral Backdrop:
Auto Components Sector Overview
- Sector Performance: Recovery phase post-COVID disruptions
- Growth Drivers: EV transition, export opportunities, aftermarket demand
- Challenges: Raw material inflation, supply chain disruptions
- Government Support: PLI schemes, Make in India initiatives
Forging Industry Dynamics
- Market Position: Specialised manufacturing with high entry barriers
- Demand Drivers: Commercial vehicle recovery, export growth
- Competitive Advantage: Technical expertise, established client relationships
- Cyclical Nature: Linked to auto industry cycles and capex spending
Fundamental Backdrop
Company Overview
- Business Model: Automotive forging components manufacturer
- Key Clients: Major OEMs in domestic and international markets
- Product Portfolio: Crankshafts, connecting rods, front axle beams
- Manufacturing Facilities: Multiple locations with modern equipment
Financial Health Indicators
- Revenue Growth: Recovery trajectory expected post-consolidation
- Margin Profile: Improving operational efficiency
- Debt Levels: Manageable debt-to-equity ratios
- Cash Flow: Positive operating cash flow generation
Growth Catalysts
- Export Expansion: Increasing share in global supply chains
- Product Diversification: Entry into new automotive segments
- Technology Upgrades: Investment in advanced manufacturing
- Market Recovery: Commercial vehicle segment revival
Risk Factors
- Cyclical Demand: Vulnerability to auto industry downturns
- Raw Material Costs: Steel price volatility impact
- Competition: Pressure from low-cost manufacturers
- Regulatory Changes: Environmental and safety compliance costs
My Take:
NSE:RKFORGE presents a compelling technical setup after a prolonged consolidation phase. The stock appears to be breaking out from a well-defined base with strong volume support. The risk-reward profile is attractive for medium-term investors, with clear support and resistance levels providing good trade management opportunities. However, investors should remain mindful of the cyclical nature of the auto components sector and size positions accordingly.
Keep in the Watchlist.
NO RECO. For Buy/Sell.
📌Thank you for exploring my idea! I hope you found it valuable.
🙏FOLLOW for more
👍BOOST if you found it useful.
✍️COMMENT below with your views.
Meanwhile, check out my other stock ideas on the right side until this trade is activated. I would love your feedback.
Disclaimer: "I am not a SEBI REGISTERED RESEARCH ANALYST AND INVESTMENT ADVISER."
This analysis is intended solely for informational and educational purposes and should not be interpreted as financial advice. It is advisable to consult a qualified financial advisor or conduct thorough research before making investment decisions.
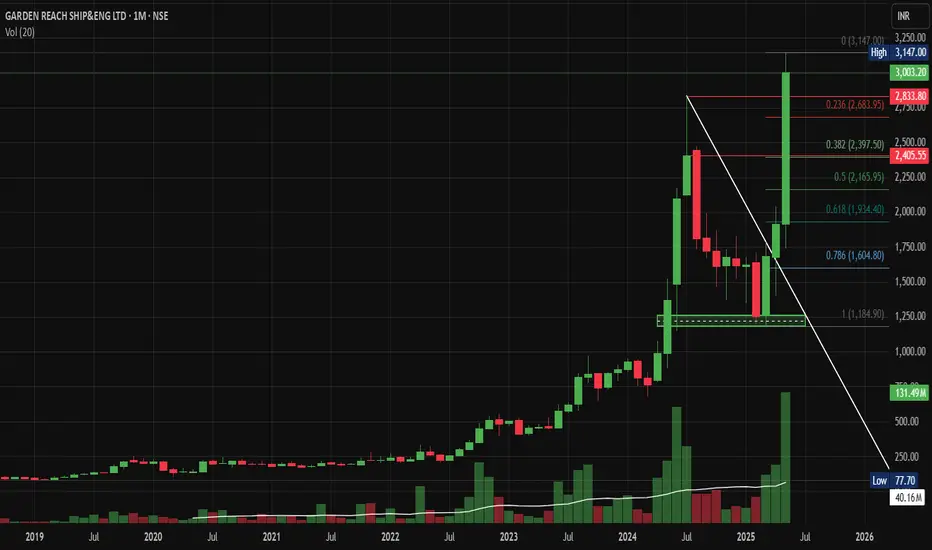
GRSE: Can this Defence Stock Double Your Money in 2025?NSE:GRSE : Can this Defence Stock Double Your Money in 2025? Let's analyse this weekend's My Chart of the Month
NSE:GRSE presents one of the most compelling technical setups in the defence sector, with the stock currently trading at ₹3,003 after a massive rally from its 2019 lows around ₹77. The chart reveals a textbook case of a multi-year accumulation followed by explosive breakout dynamics.
Price Action Analysis :
The stock underwent a dramatic transformation from a prolonged consolidation phase between 2019 and 2022, during which it traded in a narrow range of ₹150-300. The real fireworks began in late 2022, when GRSE broke out of its multi-year base with exceptional volume, signalling institutional accumulation.
The most striking feature is the parabolic move from ₹1,000 levels in early 2024 to the current high of ₹3,250. This represents over 200% gains in just over a year, accompanied by consistently high volumes averaging 40-130 million shares, indicating strong institutional participation.
Volume Analysis:
Volume patterns have been particularly bullish, with spikes coinciding with price advances. The recent correction has seen relatively lower volumes, suggesting profit-booking rather than institutional selling. The volume-weighted average price (VWAP) continues to trend upward, indicating underlying strength.
Key Technical Levels:
Support Zone: The stock has established strong support around ₹2,400-2,500 levels, coinciding with the 0.5 Fibonacci retracement from the recent rally.
Immediate Support: ₹2,683 (recent swing low)
Critical Support: ₹2,165 (0.618 Fibonacci level)
Resistance Levels: The stock recently touched ₹3,250 and is currently consolidating. The next major resistance lies at ₹3,500-3,600 based on measured move projections.
Trade Setup:
Entry Strategy:
- Primary Entry: ₹2,650-2,750 (current levels to slight dip)
- Aggressive Entry: ₹2,900-3,000 on any pullback
- Conservative Entry: ₹2,400-2,500 (major support retest)
Target Levels:
- Target 1: ₹3,400 (15% upside)
- Target 2: ₹3,800 (35% upside)
- Target 3: ₹4,200 (50% upside based on measured moves)
Stop Loss: ₹2,300 (below critical Fibonacci support)
Risk-Reward: Favourable 1:2 to 1:3 ratio across all entry points
Sectoral & Fundamental Backdrop:
The defence sector is experiencing a renaissance driven by the government's push for Atmanirbhar Bharat and increased defence spending. GRSE, being a premier shipbuilding company under the Ministry of Defence, is directly benefiting from:
1. Increased naval modernization programs
2. Export opportunities under government initiatives
3. Project 75(I) submarine program participation
4. Anti-submarine warfare corvette projects
The company's order book has been consistently growing, with recent announcements of significant contracts providing revenue visibility for the next 3-4 years. The shift towards indigenous defence production gives GRSE a strategic advantage in the naval segment.
Risk Factors:
Primary risks include overall market correction affecting high-beta defence stocks, profit-booking by retail investors after substantial gains, and any delays in government defence projects. The stock's high valuation multiple also makes it susceptible to sector rotation.
My Take:
GRSE represents a compelling blend of strong fundamentals backed by government policy support and technically sound chart patterns. The risk-adjusted returns appear favourable for medium-term investors, with the stock likely to test new highs once the Pullback is done. However, position sizing should account for the inherent volatility in defence stocks and the broader market environment. Therefore, BUY ON DIPS
The combination of sectoral tailwinds, robust order book, and technical breakout makes GRSE a candidate for continued outperformance, though investors should remain mindful of profit-booking opportunities at resistance zones.
Keep in the Watchlist.
NO RECO. For Buy/Sell.
📌Thank you for exploring my idea! I hope you found it valuable.
🙏FOLLOW for more
👍BOOST if you found it useful.
✍️COMMENT below with your views.
Meanwhile, check out my other stock ideas on the right side until this trade is activated. I would love your feedback.
Disclaimer: "I am not a SEBI REGISTERED RESEARCH ANALYST AND INVESTMENT ADVISER."
This analysis is intended solely for informational and educational purposes and should not be interpreted as financial advice. It is advisable to consult a qualified financial advisor or conduct thorough research before making investment decisions.
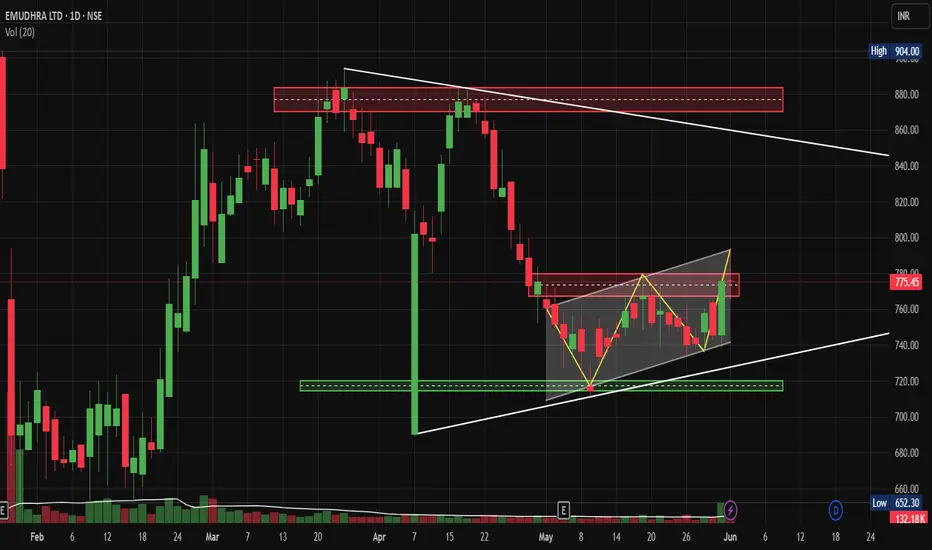
Emudhra Watchlist StockEmudhra's Triangle Breakout Drama: Why This Digital Security Stock Could Rally 15% from Current Levels
Price Action:
Looking at Emudhra's daily chart, we're witnessing a textbook technical setup that could offer substantial rewards for patient traders. The stock has been consolidating in a well-defined triangle pattern since late April, with price action compressed between converging trend lines around 720-780 levels.
The current price action shows Emudhra testing the upper boundary of this Wedge formation at approximately 775-780 resistance zone. What's particularly interesting is how the stock has maintained its position above the key psychological level of 750, suggesting underlying strength despite the recent market volatility.
Volume Action:
From a volume perspective, we've seen relatively subdued activity during this consolidation phase, which is typical behaviour within triangle patterns. However, any breakout above 780 with accompanying volume surge would validate the bullish continuation thesis.
The base formation here spans roughly 6-8 weeks, providing sufficient time for weak hands to exit and strong accumulation to occur. Support levels are clearly defined at 720 (triangle lower boundary) and 700 (psychological support), while immediate resistance sits at 780, followed by the major level at 880.
The triangle pattern, combined with the stock's position above key moving averages, suggests a potential measured move target of around 850-870 levels, representing approximately 10-15% upside from current levels.
Trade Setup:
Entry: 782-785 on breakout with volume confirmation
Target 1: 820 (initial resistance)
Target 2: 850-870 (measured move target)
Stop Loss: 750 (below triangle support)
Risk-Reward Ratio: Approximately 1:2.5
Risk management is crucial here - the stop loss at 750 provides a reasonable buffer while maintaining favourable risk-reward dynamics. Traders should wait for a decisive breakout above 780 with at least 50% higher than average volume to confirm the pattern completion.
Sectoral Backdrop:
The digital security and cybersecurity sector has been gaining traction globally, with increasing digitization post-pandemic driving demand for authentication and security solutions. Emudhra operates in the digital trust space, providing digital signature solutions and PKI services, which positions it well for the ongoing digital transformation wave.
Fundamental Backdrop:
While technical analysis drives this setup, Emudhra's business fundamentals appear supportive, with the company's focus on digital identity solutions aligning with government initiatives like Digital India. The increasing adoption of digital signatures across various sectors provides a favourable operating environment for sustained growth.
Risk Factors:
Technical Risks:
- False breakout possibility if volume doesn't support the move
- A broader market correction could invalidate the pattern
- Failure to hold 750 support would signal a pattern failure
Fundamental Risks:
- Intense competition in the digital security space
- Regulatory changes affecting the business model
- Economic slowdown impacting enterprise spending
- Technology disruption in authentication methods
My Take:
The key catalyst to watch would be any major contract announcements or regulatory developments that could trigger the breakout. Given the tight consolidation and technical setup, this stock deserves a spot on active traders' watchlists for the coming weeks.
Keep in the Watchlist.
NO RECO. For Buy/Sell.
📌Thank you for exploring my idea! I hope you found it valuable.
🙏FOLLOW for more
👍BOOST if you found it useful.
✍️COMMENT below with your views.
Meanwhile, check out my other stock ideas on the right side until this trade is activated. I would love your feedback.
Disclaimer: "I am not a SEBI REGISTERED RESEARCH ANALYST AND INVESTMENT ADVISER."
This analysis is intended solely for informational and educational purposes and should not be interpreted as financial advice. It is advisable to consult a qualified financial advisor or conduct thorough research before making investment decisions.
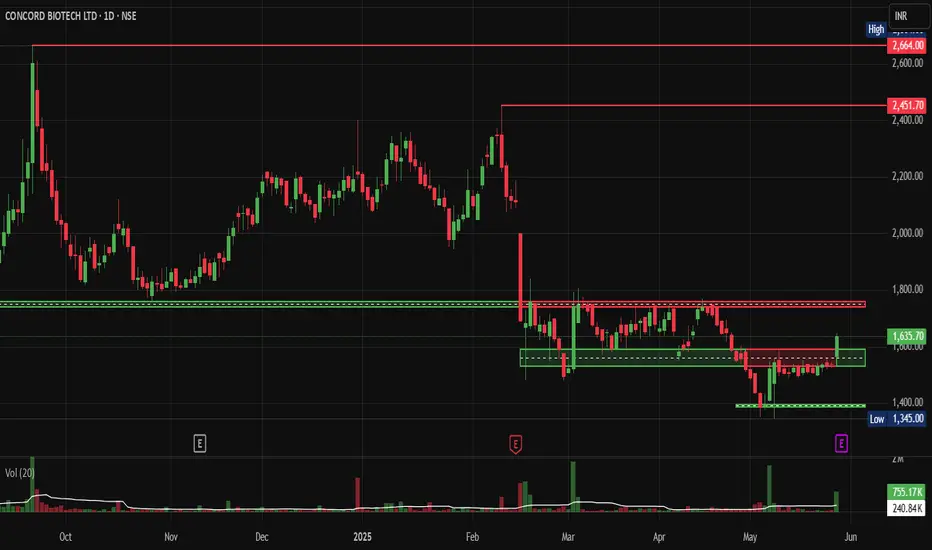
Concordbio: Flag Bo and VCP Setup after 6.5% Surge today.NSE:CONCORDBIO Hidden Pharma Gem Shows Classic VCP Setup After 6.5% Surge - Is Another Breakout Brewing? Well, the Structure looks beautiful, and the Results are tomorrow.
Technical Overview:
NSE:CONCORDBIO presents a compelling technical setup following a dramatic transformation from a prolonged consolidation phase to explosive momentum. The stock has exhibited textbook volatility contraction pattern (VCP) characteristics, culminating in what appears to be a flag breakout formation.
Price Action Analysis:
The stock experienced a significant markup phase from August to October 2024, surging from around ₹1,750 to peak levels near ₹2,664, representing approximately 52% gains. This initial thrust established new 52-week highs and demonstrated strong institutional accumulation based on the volume surge during the breakout phase.
Following this parabolic move, the stock entered a healthy consolidation phase from November 2024 through May 2025, forming a classic flag pattern. During this 6-month consolidation, the stock contracted its volatility significantly, with price action tightening between ₹2,400 resistance and ₹1,900 support levels.
Volume Analysis:
The volume pattern supports the technical setup:
- High volume during initial breakout phase (August-September 2024)
- Declining volume during consolidation (healthy distribution)
- Recent volume pickup suggests smart money accumulation
- Volume at support levels shows buying interest
Volatility Contraction Pattern (VCP) Confirmation
The chart clearly displays VCP characteristics:
- Initial strong uptrend with high volume (August-October 2024)
- Subsequent consolidation with contracting volatility and declining volume
- Multiple pullbacks of decreasing magnitude (typical VCP trait)
- Volume drying up during the consolidation phase, indicating a lack of selling pressure
- Recent volume expansion suggests renewed institutional interest
Key Technical Levels:
Support Levels:
- Primary Support: ₹1,531 (recent swing low)
- Secondary Support: ₹1,450-1,500 (psychological level and previous resistance turned support)
- Critical Support: ₹1,345 (absolute low, breach would invalidate bullish structure)
Resistance Levels:
- Immediate Resistance: ₹1,750-1,800 (flag upper boundary)
- Major Resistance: ₹2,400-2,451 (previous consolidation highs)
- Ultimate Target: ₹2,664 (52-week high)
Base Formation Analysis:
The stock has constructed a robust 6-month flag base following the initial breakout. This base formation shows:
- Tight price action with lower volatility
- Volume contraction during consolidation (healthy sign)
- Multiple retests of support levels without breakdown
- Ascending lows pattern within the flag structure
Trade Setup and Entry Strategy:
Pattern: Flag breakout from VCP base
Entry Zone: ₹1,650-1,680 (on breakout above flag resistance with volume)
Confirmation: Daily close above ₹1,700 with 2x average volume
Stop Loss: ₹1,500 (below key support and flag low)
Risk-Reward Ratio: Approximately 1:2.5
Target Levels:
- Target 1: ₹1,900 (measured move from flag pole)
- Target 2: ₹2,100 (intermediate resistance)
- Target 3: ₹2,400-2,450 (major resistance zone)
Position Sizing: Risk 1-2% of portfolio capital given the stop loss distance
Sectoral and Fundamental Backdrop:
NSE:CONCORDBIO operates in the pharmaceutical fermentation and biotechnology space, specialising in complex fermentation-based APIs and biosimilars. The sector has been experiencing renewed interest due to:
- India's growing prominence in global pharmaceutical supply chains
- Increasing focus on biosimilars and complex generics
- Government initiatives supporting domestic pharmaceutical manufacturing
- Rising healthcare expenditure and demand for specialised medicines
The company's fundamentals appear supportive of the technical breakout, with the fermentation and biotech segments showing strong growth potential in the post-pandemic environment.
Risk Factors:
- Broader market volatility could impact individual stock performance
- Pharmaceutical sector faces regulatory risks and pricing pressures
- Global economic uncertainties affecting export-dependent companies
- Technical failure below ₹1,500 would invalidate the bullish thesis
My Take:
NSE:CONCORDBIO presents a high-probability technical setup combining VCP pattern characteristics with flag breakout potential. The 6-month consolidation has allowed the stock to digest previous gains while building energy for the next leg higher. Current price action near key support levels offers an attractive risk-reward opportunity for momentum traders and swing investors.
The combination of strong sectoral tailwinds, solid base formation, and classic technical patterns makes this an interesting candidate for breakout traders willing to accept moderate risk for potentially substantial rewards.
Keep in the Watchlist.
NO RECO. For Buy/Sell.
📌Thank you for exploring my idea! I hope you found it valuable.
🙏FOLLOW for more
👍BOOST if you found it useful.
✍️COMMENT below with your views.
Meanwhile, check out my other stock ideas on the right side until this trade is activated. I would love your feedback.
Disclaimer: "I am not a SEBI REGISTERED RESEARCH ANALYST AND INVESTMENT ADVISER."
This analysis is intended solely for informational and educational purposes and should not be interpreted as financial advice. It is advisable to consult a qualified financial advisor or conduct thorough research before making investment decisions.
Venus Pipes Explodes 12% Breaking Out of 6-Month BaseNSE:VENUSPIPES Explodes 12%: Breaking Out of 6-Month Base Could Target ₹1,600 as it made a Beautiful Chart Structure Just Before Q4 FY25 Results.
Price Action Analysis
NSE:VENUSPIPES is experiencing a significant breakout moment, currently trading at ₹1,452.00 with an impressive 12.37% gain (₹159.80). The stock has decisively broken above a critical resistance zone around ₹1,400-1,420 after consolidating in a well-defined base for nearly six months. This breakout comes with strong momentum and represents a potential shift from accumulation to the markup phase.
Volume Analysis:
Volume is exceptionally strong at 626.33K shares compared to the average of 85.02K - nearly 7.5x times normal volume. This massive surge in participation validates the breakout and suggests institutional buying interest. The volume spike coinciding with the price breakout is a textbook confirmation signal that significantly increases the probability of continuation.
Key Support & Resistance Levels:
- Newly Broken Resistance: ₹1,400-1,420 zone (now potential support)
- Next Major Resistance: ₹1,500-1,520 (psychological level and previous resistance)
- Ultimate Target Resistance: ₹1,900-1,950 (red horizontal line - major resistance from earlier highs)
- Strong Base Support: ₹1,100-1,150 zone (multiple green arrows showing successful tests)
- Immediate Support: ₹1,380-1,400 (previous resistance becomes support)
Technical Patterns:
1. Rectangle Breakout: Clean break above the 6-month consolidation range (₹1,100-1,420)
2. Multiple Bottom Formation: Several tests of the ₹1,100-1,150 support zone (marked with green arrows)
3. Ascending Triangle: Recent price action shows higher lows approaching the ₹1,420 resistance
4. Volume Breakout Pattern: Classic high-volume breakout from a prolonged base
Trade Setup - Breakout Continuation
Primary Entry Strategy:
- Entry Point: ₹1,440-1,460 (current levels or minor pullback)
- Aggressive Entry: ₹1,420-1,430 (on any retest of breakout level)
Target Levels:
- First Target: ₹1,520-1,540 (psychological resistance and measured move)
- Second Target: ₹1,650-1,680 (extension target based on base width)
- Ultimate Target: ₹1,800-1,850 (major resistance zone approach)
Risk Management:
- Stop Loss: ₹1,350 (below the breakout zone and recent support)
- Tight Stop: ₹1,390 for short-term traders
- Position Size: Maximum 2-3% of portfolio at risk
Alternative Setup - Conservative Approach
For risk-averse traders:
- Entry: ₹1,480-1,500 (after clearing first resistance convincingly)
- Stop Loss: ₹1,420 (below confirmed breakout level)
- Targets: ₹1,600, ₹1,750
Pattern Analysis:
The stock has formed a solid 6-month base between ₹1,100-1,420, allowing for significant accumulation. The multiple tests of support around ₹1,100-1,150 (green arrows) demonstrate strong buying interest at lower levels. The recent ascending triangle formation within the larger rectangle pattern suggests building momentum that has now been released.
Risk-Reward Assessment:
- Primary Setup R:R: 1:2.8 (Entry ₹1,450, Stop ₹1,350, Target ₹1,730)
- Breakout Target: Rectangle pattern suggests potential for 25-30% move
- Failure Risk: Breakdown below ₹1,380 would invalidate the bullish setup
Key Technical Factors:
The convergence of multiple bullish signals - rectangle breakout, volume confirmation, successful base building, and momentum surge - creates a high-probability setup. The stock has spent considerable time building this base, and the breakout with such strong volume suggests genuine institutional participation rather than retail speculation.
Trading Strategy:
Traders should look for any minor pullbacks to the ₹1,420-1,440 zone as ideal entry opportunities. The key is to ensure the breakout level holds as support. A sustained move above ₹1,500 would confirm the pattern and likely attract momentum buying, potentially accelerating the move toward the ₹1,650-1,700 zone.
Monitor for any evening star or shooting star patterns at resistance levels, which could signal temporary exhaustion and provide profit-taking opportunities.
Keep in the Watchlist.
NO RECO. For Buy/Sell.
📌Thank you for exploring my idea! I hope you found it valuable.
🙏FOLLOW for more
👍BOOST if you found it useful.
✍️COMMENT below with your views.
Meanwhile, check out my other stock ideas on the right side until this trade is activated. I would love your feedback.
Disclaimer: "I am not SEBI REGISTERED RESEARCH ANALYST AND INVESTMENT ADVISER."
This analysis is intended solely for informational and educational purposes and should not be interpreted as financial advice. It is advisable to consult a qualified financial advisor or conduct thorough research before making investment decisions.

Anant Raj: Triple Bottom Reversal Pattern, Trendline BO.NSE:ANANTRAJ Made a Beautiful Chart Structure of a Triple Bottom reversal pattern, Sort of Inverse H&S confirmation and Trendline BO. Post Excellent Q4 Results, with Good Price and Volume action.
Price Action:
- It experienced a sharp decline in January 2025, falling from ₹950 to the ₹550 level.
- Further correction took it to lows near ₹420 in March-May 2025
- Currently showing signs of recovery at ₹514.10, up ₹40.50 (+8.55%) in today's session.
- Breaking above the descending trendline (white diagonal).
- Multiple tests of the ₹420-430 support zone created a solid base
Volume Analysis:
- Today's volume at 7.79M shares vs. average of 2.93M (over 2.5x normal volume)
- Previous support bounces (green arrows) also saw increased volume
- Strong volume accompanying the breakout indicates conviction behind the move
- Volume expansion during upward movements signals the accumulation phase
Key Support and Resistance:
- Strong support established at ₹420-430 zone (green horizontal line)
- Intermediate resistance at ₹550 level (lower red horizontal line)
- Major resistance at ₹630-640 zone (upper red horizontal line)
- Multiple rejection points at these resistance levels (red arrows)
- Historical resistance at ₹935-950 from December-January (top red line)
Technical Patterns:
1. Triple Bottom- Formed at ₹420-430 level (March, April, May - green arrows)
2. Descending Trendline Breakout- Price breaking above the multi-month downtrend line
3. Somewhat Inverse Head & Shoulders- Potentially forming with:
- Left shoulder (February-March)
- Head (April)
- Right shoulder (May)
- Neckline around ₹520-530
4. Sort of Range Breakout- Escaping from the ₹420-500 trading range
Trade Setup:
- Pattern: Trendline breakout + potential inverse H&S completion
- Confirmation: Strong price action above ₹500 with volume expansion
- Context: Reversal setup after extended downtrend and base formation
Entry Points:
1. Aggressive Entry: Current price (₹514.10) with partial position
2. Pullback Entry: On retest of breakout level ₹490-500
3. Confirmation Entry: On close above ₹550 (previous resistance level)
Exit Strategy
- Target 1: ₹550 (immediate resistance)
- Target 2: ₹630-640 (major resistance zone)
- Target 3: ₹750 (intermediate target based on pattern projection)
- Ultimate Target: ₹935-950 (previous ATH high)
- Trailing Stop: Implement a 5% trailing stop after Target 1 is achieved
Stop Loss Placement:
- Aggressive Stop: ₹480 (below recent swing low)
- Conservative Stop: ₹450 (midpoint of recent range)
- Pattern-Based Stop: ₹420 (below the triple bottom support)
Risk Management:
- Position sizing: Limit risk to 1-2% of trading capital
- Risk-reward ratio: Minimum 1:1.5 (with aggressive stop)
- Consider the pyramiding approach: add to the position as each resistance level is cleared
- Scale out: 30% at Target 1, 30% at Target 2, hold remainder with trailing stop
The stock shows a compelling technical setup with its triple bottom pattern, trendline breakout, and high-volume surge. The inverse head and shoulders pattern, if completed with a move above ₹550, would further confirm the reversal thesis. Multiple tests of support with increasing volume on the recovery suggest institutional interest is building in the stock.
Keep in the Watchlist.
NO RECO. For Buy/Sell.
📌Thank you for exploring my idea! I hope you found it valuable.
🙏FOLLOW for more
👍BOOST if you found it useful.
✍️COMMENT below with your views.
Meanwhile, check out my other stock ideas on the right side until this trade is activated. I would love your feedback.
Disclaimer: "I am not SEBI REGISTERED RESEARCH ANALYST AND INVESTMENT ADVISER."
This analysis is intended solely for informational and educational purposes and should not be interpreted as financial advice. It is advisable to consult a qualified financial advisor or conduct thorough research before making investment decisions.

USHA MARTIN BREAKS OUT! 7.5% SURGE SIGNALS MASSIVE RALLY AHEADNSE:USHAMART Made Beautiful Chart Structure of Kinda Triple Bottom Reversal Pattern today after Q4 Results with Good Price and Volume action and Breaking the Trendline.
Price Action:
- The stock has been in a downtrend since November 2024, forming a clear descending resistance line (white diagonal Trendline)
- Currently showing strong breakout momentum at ₹334.85, up ₹23.75 (+7.46%) in today's session
- Successfully broken above both the downtrend line and horizontal resistance at ₹320-325
- Multiple tests of support at the ₹290 level have created a solid base for the current rally
- Higher lows forming since March indicate increasing buying pressure
Volume Analysis:
- Today's volume at 4.98M shares vs. average of 688.65K (over 7x normal volume)
- Previous support bounces (green arrows) also occurred with increased volume
- Extremely high volume on today's breakout confirms strong institutional interest
- Volume profile shows healthy accumulation during support tests
Key Support and Resistance Levels:
- Strong support established at ₹290 level (green horizontal line)
- Intermediate resistance/support at ₹320-325 (lower red horizontal line)
- Major resistance at ₹350 level (upper red horizontal line)
- The previous rejection point at ₹350 (red arrow) now becomes the next target
- Long-term resistance from October to December 2024 around ₹420
Technical Patterns:
1. Downtrend Line Breakout*- Price has decisively broken above the multi-month downtrend line
2. Kinda Triple Bottom- Formed at ₹290 level (February-May), creating a solid foundation
3. Ascending Triangle- Recent price action shows higher lows against horizontal resistance
4. Volume Confirmation- Massive volume spike validates the technical breakout
5. Bullish Engulfing Candle- Today's price action engulfs previous bearish candles
Trade Setup:
- Pattern: Downtrend line breakout + horizontal resistance break
- Confirmation: Strong price action with 7x normal volume
- Context: Potential trend reversal after extended downtrend and base formation
Entry Points:
1. Aggressive Entry: Current price (₹334.85) with partial position
2. Pullback Entry: On retest of breakout level ₹320-325
3. Confirmation Entry: Add positions on close above ₹350 (previous resistance)
Exit Strategy:
- Target 1: ₹350 (immediate resistance)
- Target 2: ₹380 (intermediate resistance based on prior support level)
- Target 3: ₹420 (major resistance from December 2024)
- Trailing Stop: Implement a 5% trailing stop after Target 1 is achieved
Stop Loss Placement:
- Aggressive Stop: ₹315 (below breakout level)
- Conservative Stop: ₹305 (midpoint between support and breakout)
- Pattern-Based Stop: ₹290 (below the triple bottom support)
Risk Management:
- Position sizing: Limit risk to 1-2% of trading capital
- Risk-reward ratio: Maintain at least 1:1.5 (with aggressive stop)
- Consider scaling in: 50% at current level, 25% on pullback, 25% on further confirmation
- Scale out: 30% at Target 1, 40% at Target 2, hold remainder with trailing stop
Today's powerful breakout on record volume after forming a kinda triple bottom pattern suggests a potential trend reversal. The breakout above both the descending trendline and horizontal resistance provides a compelling technical case for upside continuation. If the stock can maintain momentum above the ₹325 level, it could target the next resistance at ₹350 quickly, with potential for a move toward ₹380-420 in the coming weeks.
Keep in the Watchlist.
NO RECO. For Buy/Sell.
📌Thank you for exploring my idea! I hope you found it valuable.
🙏FLLOW for more
👍BOOST if useful
✍️COMMENT below with your views.
Meanwhile, check out my other stock ideas on the right side until this trade is activated. I would love your feedback.
Disclaimer: "I am not a SEBI REGISTERED RESEARCH ANALYST AND INVESTMENT ADVISER."
This analysis is intended solely for informational and educational purposes and should not be interpreted as financial advice. It is advisable to consult a qualified financial advisor or conduct thorough research before making investment decisions.

Advanced Enzymes: Fresh Breakout Above Key ResistanceNSE:ADVENZYMES Made a Beautiful Chart Structure, Gave Fresh Breakout Above Key Resistance, Could Now Trigger 20% Rally - Time to Buy the Dip?
Pattern Recognition and Base Formation:
NSE:ADVENZYMES has been consolidating in a well-defined rectangular trading range for the past 3-4 months, oscillating between ₹260-305 levels. This sideways consolidation represents a healthy digestion phase after the stock's earlier decline from highs around ₹350.
The most recent price action shows a decisive breakout above the ₹305 resistance level on strong volume expansion, suggesting institutional participation and potential trend reversal. The stock appears to be forming a classic "rectangle breakout" pattern, which typically signals continuation of the prevailing trend or reversal from consolidation.
Key Technical Levels Analysis:
Key Support Levels:
- Immediate Support: ₹285-290 (recent breakout zone, now expected to act as support)
- Major Support: ₹270-275 (mid-range consolidation area with multiple touches)
- Critical Support: ₹260-265 (lower boundary of the rectangle pattern)
- Ultimate Floor: ₹257.90 (52-week low and absolute support)
Key Resistance Levels:
- Immediate Resistance: ₹315-320 (psychological round number resistance)
- Next Target: ₹330-335 (halfway to previous highs)
- Major Target: ₹350 (previous high retest)
- Extension Target: ₹365-370 (measured move from rectangle pattern)
Volume Spread Analysis:
Today's volume surge to 776.33K shares represents nearly 5x the average daily volume of 162.61K, indicating significant institutional interest. This volume expansion accompanying the breakout is a critical confirmation signal that validates the technical setup.
The volume pattern during the consolidation phase showed typical accumulation characteristics - higher volume during declines and moderate volume during bounces, until today's breakout, which shows strong participation.
Technical Pattern Assessment:
Primary Pattern: Rectangle/Trading Range Breakout
- Formation Period: February 2025 - May 2025
- Range: ₹260-305 (approximately ₹45 range)
- Breakout Level: ₹305 (achieved with volume confirmation)
- Measured Target: ₹350+ (adding range height to breakout point)
The pattern shows multiple tests of both support and resistance levels, indicating a mature base formation with strong hands accumulating positions during weakness.
Trade Setup:
Setup Classification: Breakout Play with Volume Confirmation
Entry Strategies:
- Aggressive Entry: ₹300-305 (current levels on any minor pullback)
- Conservative Entry: ₹285-290 (on retest of breakout level for better risk-reward)
- Value Entry: ₹275-280 (if deeper pullback occurs, though less likely given volume surge)
Position Sizing:
- Initial Allocation: 1-2% of portfolio (given setup quality and volume confirmation)
- Scaling Strategy: Add on pullbacks to support levels
Profit Taking Approach:
- Target 1: ₹325-330 (6-8% upside) - Book 30% of position
- Target 2: ₹345-350 (12-15% upside) - Book 40% of position
- Target 3: ₹365-370 (18-20% upside) - Hold remaining 30% for potential extension
Risk Management Framework:
- Tight Stop: ₹295 (3-4% downside for short-term traders)
- Swing Stop: ₹285 (7-8% downside for position traders)
- Pattern Stop: ₹275 (10% downside - invalidates bullish setup if breached)
Sectoral and Fundamental Backdrop:
NSE:ADVENZYMES operates in the speciality chemicals and biotechnology space, focusing on enzyme manufacturing for various industrial applications. The sector dynamics are currently favourable due to:
Industry Tailwinds:
- Growing demand for sustainable and eco-friendly industrial processes
- Increasing adoption of enzyme-based solutions in food processing, textiles, and pharmaceuticals
- Government push for bio-based manufacturing and green chemistry initiatives
- Rising exports of speciality chemicals from India
Company Specific Factors:
- Strong research and development capabilities in enzyme technology
- Diversified application portfolio reducing single-sector dependency
- Established client relationships in domestic and international markets
- Beneficiary of the "Make in India" initiative in speciality chemicals
Fundamental Support:
- Consistent revenue growth trajectory in recent quarters
- Improving operating margins due to product mix optimization
- Strong balance sheet with manageable debt levels
- Increasing focus on value-added enzyme products
Risk Assessment:
Bullish Catalysts:
- Volume-confirmed breakout from 3-month consolidation
- Strong sectoral tailwinds supporting long-term growth
- Technical pattern completion with clear target levels
- Established support base providing downside protection
Risk Factors:
- Broader market volatility could impact momentum stocks
- The speciality chemicals sector's sensitivity to raw material costs
- Global economic slowdown affecting industrial demand
- Competition from larger multinational enzyme manufacturers
My Take and Recommendation:
NSE:ADVENZYMES presents a compelling technical setup with the stock breaking out of a well-established 3-month trading range on exceptional volume. The combination of strong technical patterns, sectoral tailwinds, and reasonable fundamental backdrop creates an attractive risk-adjusted opportunity.
The immediate focus should be on the stock's ability to sustain above the ₹305 breakout level and build momentum toward the ₹325-330 resistance zone. Any pullback to the ₹285-290 area would offer an excellent secondary entry point with improved risk-reward parameters.
Given the volume confirmation and sector dynamics, the stock appears positioned for a potential move toward its previous highs around ₹350, representing approximately 15% upside from current levels. However, traders should maintain disciplined risk management and respect the established support levels to protect capital in case of adverse market conditions.
The next few trading sessions will be crucial to determine whether this breakout has the sustainability to trigger the next leg of the rally or if it represents a false breakout requiring reassessment of the bullish thesis.
Keep in the Watchlist.
NO RECO. For Buy/Sell.
📌Thank you for exploring my idea! I hope you found it valuable.
🙏FOLLOW for more
👍BOOST if you found it useful.
✍️COMMENT below with your views.
Meanwhile, check out my other stock ideas on the right side until this trade is activated. I would love your feedback.
Disclaimer: "I am not a SEBI REGISTERED RESEARCH ANALYST AND INVESTMENT ADVISER."
This analysis is intended solely for informational and educational purposes and should not be interpreted as financial advice. It is advisable to consult a qualified financial advisor or conduct thorough research before making investment decisions.
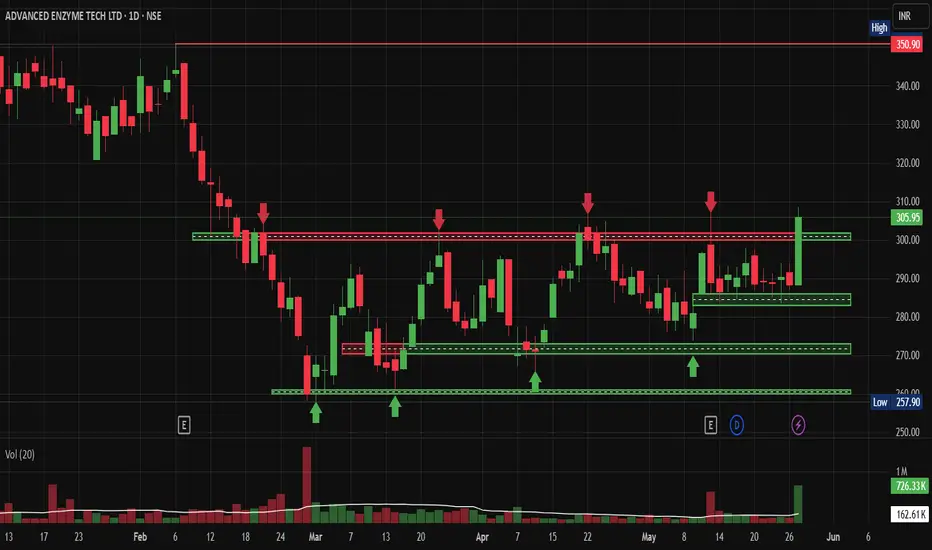
Shaily Eng Plastics Makes a Power MoveNSE:SHAILY Makes a Power Move on Hourly Charts after Q4 Results.
Price Action Analysis:
The stock is currently trading at ₹1,811.20. After consolidating near the ₹1,650-1,680 support zone for several days, SHAILY has broken out strongly to the upside, reclaiming previous highs near ₹1,820. The price action shows a series of higher lows since the early May bottom, indicating increasing bullish momentum.
Volume Analysis:
Volume has been healthy at 46.63K shares, significantly above the 30.96K average volume. This confirms genuine buying interest supporting the recent breakout. The volume spikes align with key price movements, particularly during the recent bullish moves, which validates the strength of the current uptrend.
Support & Resistance Levels:
- Key Resistance: ₹1,835-1,850 zone (previous high)
- Immediate Breakout Level: ₹1,820 (now acting as support)
- Major Support: ₹1,650-1,680 zone (multiple tests with green arrows)
- Base Formation: A solid base was formed between ₹1,650-1,680 after the pullback from April highs
Technical Patterns:
1. Rectangle Pattern: The stock formed a rectangular consolidation pattern between mid-April and mid-May (₹1,650-1,680 range)
2. Triple Bottom: Three distinct touches at the ₹1,650-1,680 support zone (marked with green arrows)
3. Bull Flag: The recent consolidation after the strong upward move from early May represents a bull flag pattern that has now resolved to the upside
Trade Setup:
- Entry Point: ₹1,815-1,820 on a pullback to the breakout level
- Stop Loss: ₹1,765 (below the recent swing low)
- First Target: ₹1,850 (previous resistance)
- Second Target: ₹1,920 (measured move from the rectangle pattern)
- Final Target: ₹2,000 (psychological level and potential measured move target)
Risk Management:
- Position sizing: Limit exposure to 2-3% of trading capital
- Risk-Reward Ratio: Approximately 1:1.5 based on the stop loss and the second target
- Trailing stop: Move stop loss to breakeven after the price reaches the first target
NSE:SHAILY showed exceptional technical strength with the recent breakout above resistance after forming a solid base. The increased volume confirms buyer interest, and the prior triple bottom pattern adds confidence to the bullish outlook. Traders should watch for the continuation of the breakout with the mentioned targets, while protecting capital with the defined stop loss.
Keep in the Watchlist.
NO RECO. For Buy/Sell.
📌Thank you for exploring my idea! I hope you found it valuable.
🙏FOLLOW for more
👍BOOST if you found it useful.
✍️COMMENT below with your views.
Meanwhile, check out my other stock ideas on the right side until this trade is activated. I would love your feedback.
Disclaimer: "I am not a SEBI REGISTERED RESEARCH ANALYST AND INVESTMENT ADVISER."
This analysis is intended solely for informational and educational purposes and should not be interpreted as financial advice. It is advisable to consult a qualified financial advisor or conduct thorough research before making investment decisions.
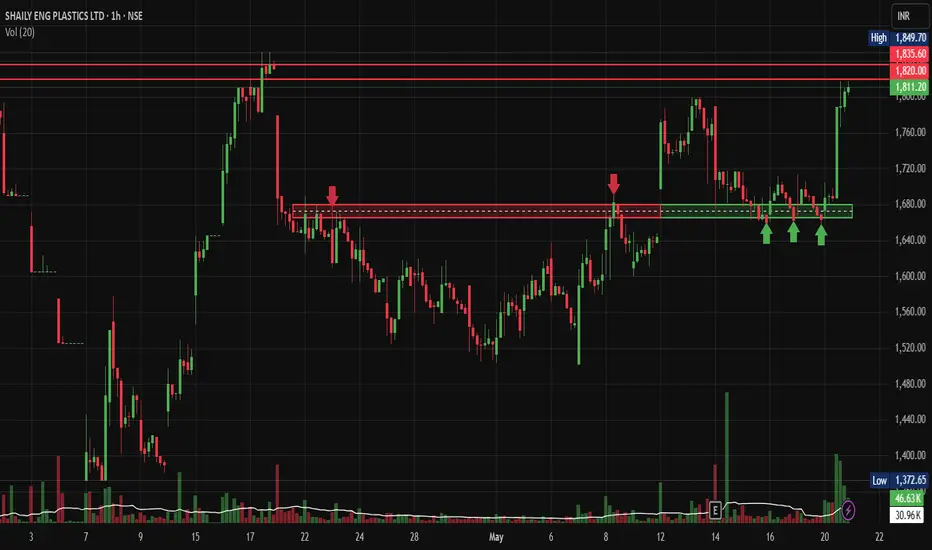
Aptus Rising Channel Pattern with Prior Triple Bottom PatternNSE:APTUS : Rising Channel Pattern with Prior Triple Bottom Pattern Signals Major Reversal - Could This Be the Next Multi-Bagger?
Pattern Recognition & Base Formation:
NSE:APTUS presents a compelling technical setup with a Triple Bottom reversal pattern formed at the ₹267-275 support zone. This pattern, completed over several months from late 2024 to early 2025, represents one of the most reliable bullish reversal formations in technical analysis.
The stock has also carved out a distinct ascending triangle pattern with the upper trendline acting as dynamic resistance around ₹340-350 levels. The recent breakout above this consolidation zone, accompanied by increased volume participation, signals a potential trend change from the prolonged correction phase.
Key Technical Levels Analysis:
Critical Support Levels:
- Immediate Support: ₹330-335 (recent breakout consolidation)
- Major Support: ₹290-295 (triple bottom neckline and 50% retracement)
- Ultimate Support: ₹267-275 (triple bottom base - absolute floor)
Resistance Levels:
- Immediate Resistance: ₹359 (marked horizontal resistance zone)
- Next Target: ₹380-385 (psychological resistance before ATH)
- Ultimate Target: ₹401.65 (all-time high retest)
- Extension Target: ₹420-430 (measured move from triple bottom pattern)
Volume Profile Assessment:
The volume pattern shows significant improvement during the recent bounce from the triple bottom lows. Today's volume at 900.31K represents a 44% increase from the 20-day average, indicating institutional interest returning to the stock.
The volume during the formation of the triple bottom showed classic accumulation characteristics - high volume on declines (smart money buying) and lower volume on any bounces, until the recent breakout attempt.
Technical Pattern Breakdown:
Primary Pattern: Triple Bottom Reversal
- Formation Period: December 2024 - February 2025
- Support Base: ₹267-275
- Neckline: ₹290-295
- Measured Target: ₹350+ (already achieved), next target ₹420-430
Secondary Pattern: Ascending Triangle
- Formation Period: February 2025 - Present
- Base: Rising support from ₹275 to ₹330
- Apex: ₹340-350 resistance zone
- Breakout Status: In progress with volume confirmation pending
Trade Setup Strategy:
Setup Classification: Reversal Play with Pattern Confirmation
Entry Approaches:
- Aggressive Entry: ₹340-345 (current levels on any minor dip)
- Conservative Entry: ₹330-335 (on pullback to breakout support)
- Value Entry: ₹290-295 (if neckline retest occurs - lower probability)
Position Management:
- Initial Position: 1-1.5% portfolio allocation
- Add-on Levels: ₹330-335 (if pullback materialises)
Profit Booking Strategy:
- Target 1: ₹365-370 (6-8% upside) - Book 25% position
- Target 2: ₹385-390 (12-15% upside) - Book 40% position
- Target 3: ₹410-420 (20-25% upside) - Book remaining 35%
Risk Management:
- Tight Stop: ₹325 (5-6% downside for aggressive traders)
- Swing Stop: ₹310 (10% downside for position traders)
- Pattern Stop: ₹285 (below neckline - invalidates bullish thesis)
Sector & Fundamental Backdrop:
Housing finance companies are experiencing renewed interest due to:
- Improving real estate cycle momentum
- Regulatory clarity on lending norms
- Credit growth revival in retail segments
- Government policy support for affordable housing
Risk-Reward Assessment:
Bullish Catalysts:
- Triple bottom completion - highly reliable reversal signal
- Volume expansion during the recent bounce
- Sector tailwinds supporting fundamentals
- Technical breakout from months of consolidation
- Strong support base established at ₹270 levels
Risk Factors:
- Overall market volatility could impact momentum
- NBFC sector sensitivity to interest rate changes
- Need to sustain above ₹340 to confirm breakout
- High beta nature amplifies market moves
Bottom Line:
NSE:APTUS offers an attractive risk-adjusted opportunity with the completion of a triple bottom reversal pattern. The stock appears to be in the early stages of a potential trend reversal after months of base building.
The most prudent approach would be to initiate positions around current levels (₹340-345) with a tight stop below ₹325, targeting the ₹365-370 zone initially. Any pullback to the ₹330-335 support area would present an even better entry opportunity.
The key technical milestone will be a decisive break and hold above ₹350, which would likely trigger the next leg of the move toward the ₹380-400 zone. Until then, trade with defined risk parameters and respect the established support levels.
Keep in the Watchlist.
NO RECO. For Buy/Sell.
📌Thank you for exploring my idea! I hope you found it valuable.
🙏FOLLOW for more
👍BOOST if you found it useful.
✍️COMMENT below with your views.
Meanwhile, check out my other stock ideas on the right side until this trade is activated. I would love your feedback.
Disclaimer: "I am not SEBI REGISTERED RESEARCH ANALYST AND INVESTMENT ADVISER."
This analysis is intended solely for informational and educational purposes and should not be interpreted as financial advice. It is advisable to consult a qualified financial advisor or conduct thorough research before making investment decisions.
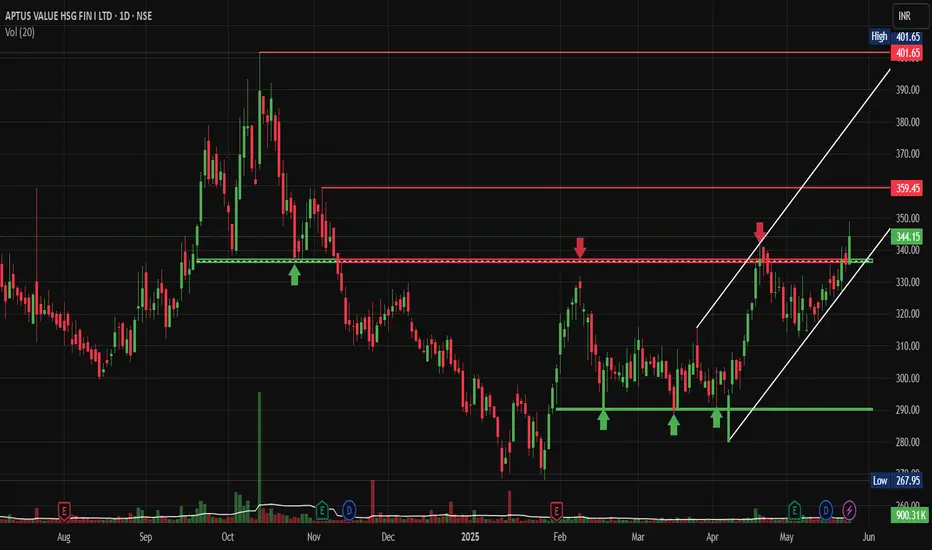
Honasa Consumer - Breakout Brewing After 6-Month Base Formation NSE:HONASA : Breakout Brewing After 6-Month Base Formation - Is This the Perfect Entry Point?
After Q4 FY25 Results, Jefferies Adjusts Price Target to ₹400 From ₹320, Keeps at Buy. They target double-digit revenue growth on retail push, also eyeing Mamaearth revival, thus qualify for my Chart of the Week idea.
Base Formation & Pattern Recognition:
NSE:HONASA has carved out a compelling 6-month consolidation base between November 2024 and May 2025, with the stock oscillating between ₹197-280 range. This extended sideways movement represents a classic accumulation phase, where smart money has likely been building positions while retail investors remained on the sidelines.
The most recent price action shows a powerful breakout above the ₹280 resistance level, accompanied by explosive volume expansion - a textbook technical setup that often precedes sustained upward moves.
Key Technical Levels:
Key Support Levels:
- Primary Support: ₹280 (former resistance, now support)
- Secondary Support: ₹240-250 (mid-range consolidation zone)
- Major Support: ₹197 (base low and critical floor)
Key Resistance Levels:
- Immediate Resistance: ₹350-360 (psychological round number)
- Next Target: ₹400 (measured move from base breakout)
- Long-term Target: ₹472 (0.786 Fibonacci extension visible on chart)
Volume Analysis:
The standout feature is the dramatic volume surge accompanying today's breakout - nearly 5x the average weekly volume at 26.41M shares. This volume expansion validates the breakout and suggests institutional participation rather than retail-driven momentum.
The volume pattern during the 6-month base shows periodic spikes at key support levels, indicating accumulation by informed participants during weakness.
Technical Pattern:
The chart displays a Rectangle/Trading Range pattern that has resolved to the upside. The measured move target from this pattern projects to approximately ₹400, representing the height of the rectangle (₹280-₹197 = ₹83) added to the breakout point.
Trade Setup:
Setup Type: Breakout Play with Volume Confirmation
Entry Strategy:
- Aggressive Entry: ₹325-330 (current levels on any minor pullback)
- Conservative Entry: ₹285-290 (on retest of breakout level)
Position Sizing: Use 1-2% portfolio risk given the setup quality
Exit Strategy:
- Target 1: ₹360 (9-10% upside) - Book 30% position
- Target 2: ₹400 (20% + upside) - Book another 40% position
- Target 3: ₹450-470 (35-40% upside) - Ride remaining position
Stop Loss:
- Tight Stop: ₹310 (6% downside protection)
- Wider Stop: ₹275 (below breakout level for swing traders)
Risk Assessment:
Bullish Factors:
- Clean 6-month base formation
- Volume-confirmed breakout
- Multiple support levels established
- Strong sector tailwinds in the consumer space
Risk Factors:
- Broader market volatility could impact momentum
- Profit-booking likely near psychological levels
- Need to hold above ₹280 to maintain bullish structure
Bottom Line:
Honasa Consumer presents a high-probability technical setup with the stock breaking out of a well-defined 6-month accumulation base on strong volume. The risk-reward profile favours the bulls, with clearly defined support levels for stop placement and multiple upside targets for profit-taking.
The key now is whether the stock can sustain above the ₹280 breakout level and continue its march toward the ₹350-400 zone. Any pullback to the ₹285-290 area would offer an attractive secondary entry point for those who missed the initial breakout.
Keep in the Watchlist.
NO RECO. For Buy/Sell.
📌Thank you for exploring my idea! I hope you found it valuable.
🙏FOLLOW for more
👍BOOST if you found it useful.
✍️COMMENT below with your views.
Meanwhile, check out my other stock ideas on the right side until this trade is activated. I would love your feedback.
Disclaimer: "I am not SEBI REGISTERED RESEARCH ANALYST AND INVESTMENT ADVISER."
This analysis is intended solely for informational and educational purposes and should not be interpreted as financial advice. It is advisable to consult a qualified financial advisor or conduct thorough research before making investment decisions.
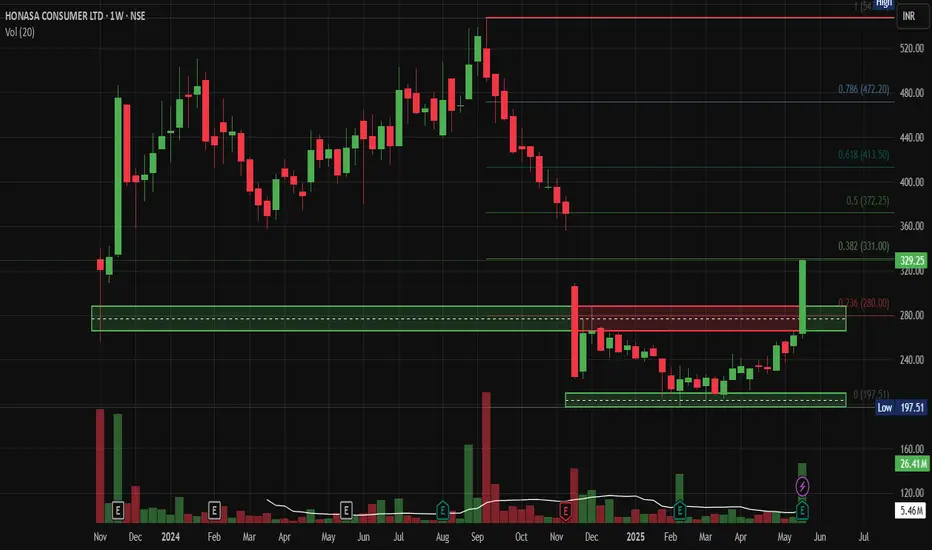
EPL - Breakout Post Good Q4NSE:EPL Made Beautiful Chart Structure today after posting good Q4 Results with Good Price and Volume action.
Price Action Analysis:
Resistance Breakout:
1. Primary Resistance Break: The stock has successfully broken above the well-defined resistance zone at ₹203-205 (lower red rectangle), which had contained price movements since mid-April.
2. Approaching Major Resistance: With today's 4.57% gain, EPL is now testing a critical longer-term resistance level at ₹210-213 (upper red rectangle), which has capped prices since late February after a sharp decline from the ₹250+ level.
3. Base Formation: After hitting lows around ₹183 in early April, the stock has formed a constructive base pattern with higher lows, suggesting accumulation and buying support at progressively higher levels.
Volume Analysis:
Today's volume characteristics strongly support the bullish case:
- Volume of 3.34M shares is significantly above the 20-day average of 895.96K (nearly 4x normal volume)
- The volume spike coincides perfectly with the upside breakout
- Prior consolidation showed decreasing volume, typically a precursor to a volume-supported breakout
- The recent accumulation phase (late April to early May) displayed positive volume patterns
Key Support and Resistance Levels:
Key Resistance Levels:
1. Immediate Resistance: ₹210-213 (upper red rectangle - critical level being tested now)
2. Intermediate Resistance: ₹225 (reaction high from mid-February)
3. Major Resistance: ₹250-255 (February high)
Key Support Levels:
1. New Support: ₹203-205 (previous resistance now converted to support)
2. Secondary Support: ₹195-198 (consolidation range from late April)
3. Strong Support: ₹183-185 (April lows and beginning of current base)
Technical Patterns:
1. Double Bottom: The March and April lows near ₹183-190 formed a double bottom pattern, typically a reversal signal.
2. Range Breakout: Today's move represents a clear breakout from the April-May trading range.
Volume Confirmation:
The volume trend provides strong confirmation:
- Clear volume divergence during the April bottom (decreasing volume on downmoves)
- Increasing volume during recovery phases
- Today's substantial volume spike on breakout (3.34M shares)
- Volume well above average throughout May, suggesting institutional participation
My Outlook:
The combination of a multi-week base breakout with exceptionally strong volume support signals a potentially significant shift in momentum. The key technical question now is whether EPL can overcome the major resistance at ₹210-213.
If the stock can close convincingly above ₹213 in the coming sessions, it would complete a substantial bottoming pattern with potential upside targets at ₹225 initially and ₹240-250 longer-term. Conversely, failure at this resistance could lead to a retest of the breakout level at ₹203-205, which should now provide support.
Keep in the Watchlist and on your Radar.
NO RECO. For Buy/Sell.
📌Thank you for exploring my idea! I hope you found it valuable.
🙏FLLOW for more
👍BOOST if useful
✍️COMMENT below with your views.
Meanwhile, check out my other stock ideas on the right side until this trade is activated. I would love your feedback.
Disclaimer: "I am not SEBI REGISTERED RESEARCH ANALYST AND INVESTMENT ADVISER."
This analysis is intended solely for informational and educational purposes and should not be interpreted as financial advice. It is advisable to consult a qualified financial advisor or conduct thorough research before making investment decisions.

Multi-Month Triangle Breakout Can Signal Move to ₹750+NSE:TIPSMUSIC Made a Beautiful Chart Structure Today and Breaks Free of Multi-Month Triangle Breakout and Could Signal Explosive Move to ₹750+
Price Action Analysis:
NSE:TIPSMUSIC is currently trading at ₹676.80, up 3.68% (₹24.00) today. The stock has been consolidating in a narrowing range since January 2025, forming a classic symmetrical triangle pattern. After testing the lower support multiple times around ₹580-600, the stock is now approaching the apex of the triangle and showing signs of a potential upside breakout. The recent price action shows higher lows being formed, indicating growing buying interest at lower levels.
Volume Analysis:
Volume is healthy at 319.61K shares, significantly above the average of 192.25 K. The increased participation suggests growing interest as the stock approaches a crucial decision point. Volume patterns show consistent buying support during dips to the triangle's lower boundary, while recent sessions have seen upticks in volume accompanying the move higher.
Key Support & Resistance Levels:
- Immediate Resistance: ₹720-730 zone (upper triangle boundary and previous resistance)
- Major Resistance: ₹750-760 (prior swing high from December)
- Triangle Support: ₹580-600 zone (marked with green arrows - multiple successful tests)
- Key Support: ₹560-570 (breakdown level that would invalidate the pattern)
- Dynamic Resistance: Descending trendline from November highs
Technical Patterns:
1. Symmetrical Triangle: Well-defined triangle formation since January, with converging trendlines
2. Triple Bottom: Multiple successful tests of the ₹580-600 support zone (green arrows)
3. Ascending Triangle Element: The recent higher lows suggest buyers are becoming more aggressive
4. Compression Pattern: Decreasing volatility as price approaches the triangle apex, typically before significant moves
Trade Setup - Breakout Play:
Entry Strategy:
- Primary Entry: ₹695-700 on confirmed breakout above triangle resistance with volume
- Secondary Entry: ₹680-685 on any pullback to current levels (anticipatory entry)
Targets:
- First Target: ₹730-735 (immediate resistance)
- Second Target: ₹760-770 (measured move from triangle base)
- Final Target: ₹800-820 (extension target based on triangle height)
Risk Management:
- Stop Loss: ₹640 (below recent swing low and triangle support)
- Tight Stop: ₹660 for aggressive traders
- Position Size: Maximum 2% of portfolio at risk
Alternative Setup - Continuation Play
For conservative traders waiting for confirmation:
- Entry: ₹735-740 (after clearing first resistance zone)
- Stop Loss: ₹695 (below breakout level)
- Targets: ₹780, ₹820, ₹860
Risk-Reward Analysis:
- Primary Setup R:R = 1:2.5 (Entry ₹690, Stop ₹640, Target ₹770)
- The triangle pattern suggests a potential 15-20% move upon breakout
- A failed breakout risk exists if volume doesn't confirm the move
Key Catalysts to Watch:
The stock appears to be in the final stages of its triangle consolidation. A breakout above ₹720 with strong volume (above 400K shares) would confirm the pattern and likely trigger momentum buying. Conversely, a breakdown below ₹640 would invalidate the bullish setup and could lead to a test of ₹560-570 levels.
The decreasing volatility and tightening price range suggest a significant move is imminent. Given the multiple successful tests of support and the overall market context, the probability favours an upside resolution, making this an attractive risk-reward setup for both swing and position traders.
Traders should monitor volume closely on any breakout attempt, as genuine breakouts from triangle patterns typically require volume confirmation to sustain the move.
Keep in the Watchlist.
NO RECO. For Buy/Sell.
📌Thank you for exploring my idea! I hope you found it valuable.
🙏FOLLOW for more
👍BOOST if you found it useful.
✍️COMMENT below with your views.
Meanwhile, check out my other stock ideas on the right side until this trade is activated. I would love your feedback.
Disclaimer: "I am not a SEBI REGISTERED RESEARCH ANALYST AND INVESTMENT ADVISER."
This analysis is intended solely for informational and educational purposes and should not be interpreted as financial advice. It is advisable to consult a qualified financial advisor or conduct thorough research before making investment decisions.

TTML Smashes Resistance After 3-Month Base MASSIVE 18% SURGE MASSIVE 18% SURGE in NSE:TTML Smashes Resistance After 3-Month Base - The Perfect Breakout Trade Blueprint! Also made a Beautiful Chart Structure of Kinda Triple Bottom Reversal Pattern today after Good Price and Volume action.
Price Action Analysis:
NSE:TTML is currently experiencing a significant bullish move, trading at ₹69.09 with an impressive 18.65% gain (₹10.86). The stock has made a decisive breakout from a well-defined range that had contained prices since March 2025. Today's powerful green candle has cleanly broken above the resistance zone at ₹62-64, showing strong momentum and conviction from buyers.
Volume Analysis:
The volume is exceptionally strong at 105.91M shares versus the average of 7.99M—over 13 times normal volume. This massive spike in participation confirms the legitimacy of the breakout and suggests institutional buying. High volume on breakouts is a classic confirmation signal that increases the probability of continued upward movement.
Support & Resistance Levels:
- Major Resistance (Now Broken): ₹62-64 zone (horizontal red box)
- Next Major Resistance: ₹74-76 area (upper horizontal red line)
- New Support: ₹62-64 (previous resistance now becomes support)
- Strong Base Support: ₹54-56 (multiple green arrows showing successful tests)
Technical Patterns:
1. Triple Bottom: Multiple tests of the ₹54-56 support zone (marked with green arrows) showing strong accumulation
2. Range Breakout: Clear break above the 3-month consolidation range between ₹54 and ₹64
Trade Setup:
- Entry Point: ₹68-70 on any minor pullback today or tomorrow
- Stop Loss: ₹61.50 (just below the broken resistance zone)
- First Target: ₹74-76 (previous resistance level)
- Second Target: ₹84-86 (previous swing high from December)
- Final Target: ₹95 (measured move projection from the range breakout)
Risk Management:
- Position sizing: Maximum 2% of trading capital at risk
- Risk-Reward Ratio: Approximately 1:1.5 based on the entry and the second target.
- Trailing stop: Once price moves above ₹76, move stop loss to breakeven, then trail below each higher low
Additional Insights:
The stock has formed a solid base over three months with multiple tests of support around ₹54-56, allowing for accumulation before this explosive move. The prior downtrend appears to have been arrested, with higher lows forming since March. The breakout comes with exceptional volume confirmation, suggesting this isn't a false move but potentially the beginning of a new uptrend.
The prior resistance at ₹74-76 (horizontal red line at the top) will be critical; clearing this level would confirm a complete trend reversal and potentially lead to a test of the December 2024 highs near ₹84-86.
Traders should be vigilant about potential pullbacks to the breakout zone (₹62-64), which would provide ideal secondary entry opportunities with tighter stop losses. The exceptional volume and percentage gain indicate strong momentum that could carry prices significantly higher in the coming weeks.
Keep in the Watchlist.
NO RECO. For Buy/Sell.
📌Thank you for exploring my idea! I hope you found it valuable.
🙏FOLLOW for more
👍BOOST if you found it useful.
✍️COMMENT below with your views.
Meanwhile, check out my other stock ideas on the right side until this trade is activated. I would love your feedback.
Disclaimer: "I am not a SEBI REGISTERED RESEARCH ANALYST AND INVESTMENT ADVISER."
This analysis is intended solely for informational and educational purposes and should not be interpreted as financial advice. It is advisable to consult a qualified financial advisor or conduct thorough research before making investment decisions.

EDELWEISS - Setting up for a good up move?One more interesting chart for study. This stock was pushed down from the top by almost 50%. As you can see, as the stock was dropping, the buy waves were getting stronger and stronger and they started dominating. As you can see, now it seems to be on the recovery path. It has gone above the supply line and moved past the short-term moving averages and also the 200 DMA. We can see marked increase in the buying pressure. Also, there is a very good volume support coming here. The Relative Strength and Money Flow are positive. Now we can see that there is a break of structure in both daily and weekly as well. The stock seems to be getting ready for a good up move and could see 140 levels as a minimum. But at this juncture, we could see a retest of the 200 DMA levels before moving up further.