SKYGOLD Triangle BreakoutSky Gold & Diamonds is attempting to breakout after forming a triangle pattern on 1D timeframe with high volumes.
Volume

NDLVENTURE | Long-term Investment IdeaStock Name: NDLVENTURE
📊 Breakout Context: Weekly trendline breakout confirmed with strong volume today, adding conviction.
TRADE PLAN
💰 Buy near CMP: 100
🎯 Target: 180 (+80.0%)
🛑 Stop Loss: 84 (-16.0%)
⚖️ Risk/Reward Ratio: ~1 : 5.0
🔑 Key Notes
📌 Strong volume breakout suggests genuine momentum; monitor for retests.
📍 Healthy retest zone: 95–100 (as long as price holds above stop loss).
🔒 Trail stop loss upward as price advances to secure gains.

TRACXN | Channel & Trendline Broken Today with Huge VolumeStock Name: TRACXN
📊 Breakout Context: Channel and trendline breakout confirmed with strong volume today, adding conviction.
TRADE PLAN
💰 Buy near CMP: 38
🎯 Target: 73 (+92.1%)
🛑 Stop Loss: 31 (-18.4%)
⚖️ Risk/Reward Ratio: ~1 : 5.0
🔑 Key Notes
📌 Strong volume breakout suggests genuine momentum; monitor for retests.
📍 Healthy retest zone: 36–38 (as long as price holds above stop loss).
🔒 Trail stop loss upward as price advances to secure gains.

SILVER RANGE CONSOLIDATION Silver Strong weekly resistance 90-96$
Above 84$
Let’s test 90$ and pullback for next leg up.
Entries valid after 90$ test and pullback.
Till then look for weekly close above 90$_96$

Concord Biotech Cmp 1327 Bullish Engulfing Candle @ supportConcord Biotech Cmp 1327
Weekly chart (Positional)
Debt Free Company
1. Bullish Engulfing Candle @ support
2. Double Bottom
3. Price Rise with Volumes
Buy above 1350 SL 1100 target 1400-1450-1500
1550-1600-1650-1700-1750-1800
It is just a view, please trade at your own risk.

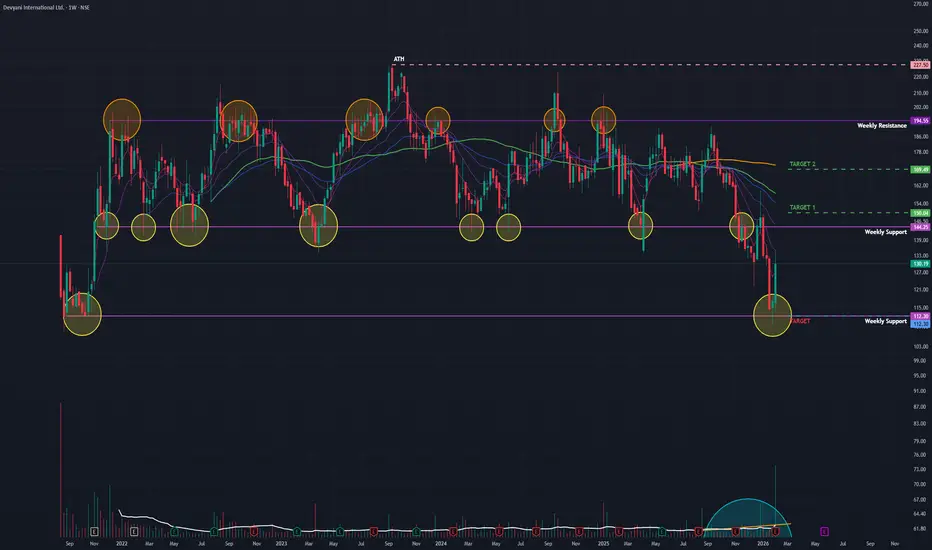
Devyani Int (W): Aggressive Bullish, Turnaround at Major Support(Timeframe: Weekly | Scale: Logarithmic)
The stock has confirmed a major "V-Shape Reversal" from its long-term support zone of ₹110. The surge is backed by "Climax Volume" and a positive reception to its Q3 operational updates, signaling that the 2-year correction might be over.
🚀 1. The Fundamental Catalyst (The "Why")
The technical reversal is driven by a shift in sentiment:
> Q3 FY26 Earnings: The market focused on the positives— Revenue up 11% YoY and operational efficiency improvements—ignoring the bottom-line loss.
> Management Change: The announcement of a new CEO (effective April 1) has been viewed as a positive step for future strategy.
> Valuation Comfort: After falling ~30% in the last year, the stock had priced in most negatives at ₹110.
📈 2. The Chart Structure (The Base)
> The Support (The Floor): At ₹112 level. This zone has been a demand magnet since 2022.
- Confirmation: The Weekly Hammer followed by a massive Green Candle (Marubozu-like) confirms a "Morning Star" type reversal.
> The Volume: The 116 Million volume is an "Institutional Stamp." Retail traders typically cannot generate this volume; it indicates that big funds are "bottom fishing."
📊 3. Technical Indicators
> RSI: Rising from the Oversold zone. This "V-turn" in RSI usually precedes a sharp recovery rally.
> Price Action: The stock has closed above its short-term moving averages (20-Day EMA), signaling a trend shift.
🎯 4. Future Scenarios & Key Levels
The stock is now in "Recovery Mode."
🐂 Bullish Targets (The Pullback Rally):
- Target 1: ₹150.
- Target 2: ₹170.
🛡️ Support (The "Must Hold"):
- Immediate Support: ₹120 – ₹123.
- Stop Loss: A weekly close below ₹110 would invalidate the entire reversal structure.
Conclusion
This is a Grade A Reversal Setup.
> Refinement: The "Hammer" was the signal; the "Earnings Volume" was the confirmation.
> Strategy: The reversal is valid. Use any dip to enter/add.
Gold starting Wave B pullbackAs from the chart we can see Gold is starting its Wave B Daily pullback. Internally we currently at this time of writing finished a Wave 2 meaning we should shortly see a bigger impulsive trend of Wave 3 to the upside.
The marked Zone on the Chart is the first target zone where Wave 3 probably ends. After that Wave 4 pullback and the final Wave 5 push should end the Daily B Wave, continuing to Wave C Daily pullback.

Berger Paints (W): Neutral-Bullish, Support Defense Pre-Earnings(Timeframe: Weekly | Scale: Logarithmic)
The stock is defending a 3-year critical support zone (₹440–₹450) just days before its Q3 results. While the technical reversal signal (Hammer) is present, the immediate direction will be dictated by the earnings reaction on Feb 5.
🚀 1. The Fundamental Catalyst (The "Why")
The technical bounce is tentative due to the upcoming event:
> Q3 FY26 Earnings (Feb 5): The market is cautious. If Berger manages to show volume growth (which has been a struggle for peers like Asian Paints), this support will act as a "Springboard."
> Valuation vs. Growth: The stock has corrected significantly from its ATH, compressing its P/E multiple. The market is looking for signs that the "Paint Wars" (competition from Grasim/Birla Opus) impact is priced in.
📈 2. The Chart Structure (Descending Triangle)
> The Floor (Support): ₹440 – ₹450 , this zone has bounced the stock in May 2022, Feb 2023, Jun 2024, Dec 2024 and now Jan 2026.
- Significance: A break below this would open a trapdoor to ₹380. The fact that it held last week is a positive sign for bulls.
> The Ceiling (Resistance): The angular trendline connecting the Lower Highs is currently coming down near ₹560 – ₹580.
📊 3. Volume & Indicators
> Volume: Volume is low. This "drying up" near the apex of a triangle is normal. It indicates that sellers are exhausted, but buyers are hesitant until the news (Earnings) is out.
> RSI: Rising from oversold zone in all timeframes.
🎯 4. Future Scenarios & Key Levels
The trade hinges on the Feb 5 Earnings reaction.
🐂 Bullish Reversal (The Bounce):
- Trigger: A weekly close above ₹480 (Post-Earnings).
- Target 1: ₹530.
- Target 2: ₹580.
🛡️ Support (The "Line in the Sand"):
- Immediate Support: ₹450.
- Stop Loss: A weekly close below ₹440 would invalidate the 3-year support and trigger a capitulation fall.
Conclusion
This is a "High Stakes" Setup .
> Refinement: The "Hammer" is a buy signal, but the Earnings Event (Feb 5) adds binary risk.
> Strategy:
- Safe Play: Wait for the earnings reaction.

TATASTEEL C&H WEEKLY BREAKOUTTatasteel breaking c&h pattern weekly basis
trading at ATH,metal sector doing well
good volume last few weeks
RSI above 60,macd crossover seen
immediate target 206,after breaking 206 can lead toward 227
NO BUY/SELL RECOMENDATION

BEL: A TEXTBOOK SYMMETRIC TRIANGLE BREAK OUT• BEL is on uptrend and forming higher high pattern in weekly basis.
• It made a strong parallel channel break out on 2024-May to 2024-Jun.
• Stock was consolidating from 2024-Jul.
• It forms a symmetric triangle and consolidated for last 7 month (211 days!)
• Today (28-01-2026) it gives a strong break out.
• Significate volume surge could be observed.
• An entry could be made near 440-450 zone with a SL below the trendline near 419.
• Consolidation range is 436-360=75 points. Hence Target 1 = 450+75=525 and Target 2 =450+75*2=600.
• Watch out psychological resistance at 500!! Trail and enjoy the bull ride.
• Educational purpose only. Happy learning.

Hindcopper 27 Jan | bullish | 52 wk, high, breakout#hindcopper
It can, give a 52wk high, breakout from here.
Can go towards 650-680.
Trade with a stop loss.
On going copper demand and bullish signs are here which can, lead a fresh 52wk, high.

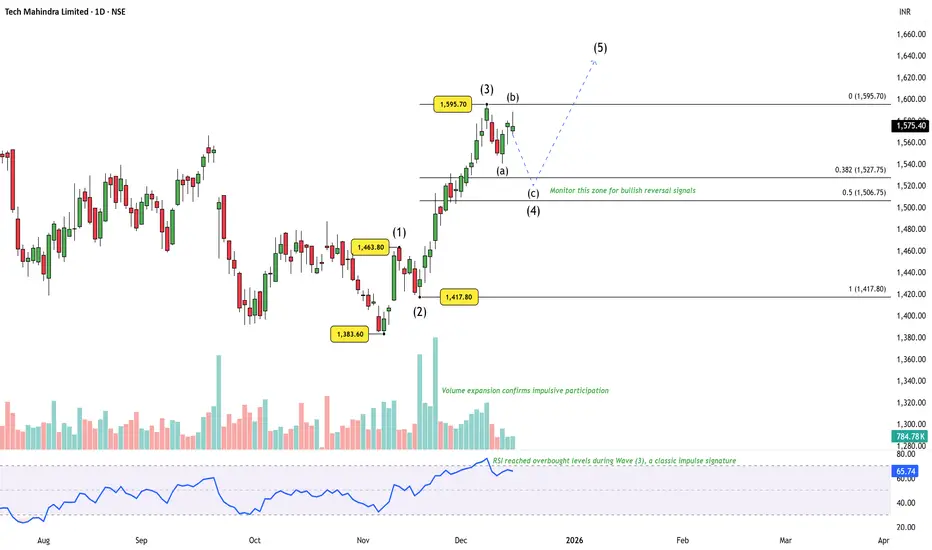
Tech Mahindra: Structure Still Favors One More Upside LegPrice action from the ₹1383.60 low has unfolded as a clean impulsive sequence, with Waves (1), (2), and a strong Wave (3) already in place. The advance was supported by clear volume expansion , validating the impulsive nature of the move. Momentum also peaked during Wave (3) , with RSI reaching overbought levels — a classic third-wave signature .
Following the Wave (3) high near ₹1595.70 , price has transitioned into a corrective phase. The decline is best interpreted as Wave (4) in progress , with only the (a),(b) legs formed so far. The structure continues to respect the typical Fibonacci retracement zone , keeping the broader bullish setup intact. A final (c) leg is still expected before Wave (4) can be considered complete.
Importantly, the higher-degree context does not materially alter the forward expectation . Whether the move from ₹1383.60 marks the start of a fresh impulsive advance , or represents the internal Wave C of a larger corrective pattern unfolding as a five-wave structure, the current setup continues to favor one more upside leg — Wave (5) .
That said, patience remains key . Focus remains on identifying a proper Wave (4) termination before anticipating continuation higher.
Disclaimer: This analysis is for educational purposes only and does not constitute investment advice. Please do your own research (DYOR) before making any trading decisions.
Kitex (W): Aggressive Bullish, Political Catalyst + Tech Rev(Timeframe: Weekly | Scale: Logarithmic)
The stock has staged a V-Shape Reversal from a fresh 52-week low, forming a textbook Bullish Hammer on the weekly chart. This technical move is powered by a major political development (joining NDA), which removes significant "Political Risk" from the stock valuation.
🚀 1. The Fundamental Catalyst (The "Why")
The technical bounce is driven by a sentiment shift:
> Political Alignment (NDA Entry): The market expects that joining the ruling alliance will fast-track the company’s massive expansion plans in Telangana and reduce friction in its home state of Kerala.
> Valuation Comfort: At ₹138 (the low), the stock was trading at attractive valuations, prompting value buying in the textile sector which is seeing a revival.
📈 2. The Chart Structure (The Bear Trap)
> The Support: ₹147 the support.
- Refinement: The price momentarily broke this support to hit ₹138.20 (on Jan 21), triggering stop-losses, before skyrocketing back up. This indicates a "Bear Trap" or "Spring" formation, where smart money buys the panic selling.
> The Pattern: The Weekly Hammer has a very long lower shadow, indicating that sellers pushed price down, but buyers overwhelmed them to close the week near the high.
📊 3. Volume & Indicators
> Volume Spike: The 12.43 Million volume is an "Ignition Bar." It is significantly higher than the 10-week average.
> RSI: RSI reversing from the "Oversold" zone (below 30 on daily, rising on weekly) is a classic momentum divergence signal.
🎯 4. Future Scenarios & Key Levels
The stock has cleared the "Panic Bottom."
🐂 Bullish Targets (The Recovery):
- Target 1: ₹200. .
- Target 2: ₹295 - ₹298.
- Blue Sky: If the political tailwinds persist, a breakout above ₹324 (ATH) is possible in the long term.
🛡️ Support (The "Line in the Sand"):
- Immediate Support: ₹147 – ₹150. The previous support level is now reclaimed.
- Stop Loss: A close below ₹135 (below the Hammer's wick) would invalidate the reversal.
Conclusion
This is a High-Conviction Turnaround.
> Refinement: The "Hammer" is valid, but the Fundamental News (NDA) is what makes this a sustainable trend rather than a dead-cat bounce.
> Strategy: The reversal is confirmed. Use dips to accumulate.

Jindal Steel (W): Cautiously Bullish (Breakout Rejection)(Timeframe: Weekly | Scale: Logarithmic)
The stock attempted a major breakout from its 2-year consolidation but faced a classic "Shooting Star" / Rejection at the All-Time High. While the trend is up, the inability to close above ₹1,085 signals that the "Smart Money" is booking profits ahead of the Jan 30 earnings.
🚀 1. The Fundamental Catalyst (The "Why")
The price action is dominated by the upcoming event:
> Q3 Earnings (Jan 30): With results just a week away, investors are risk-averse. The stock needs a "Earnings Beat" to justify a price above ₹1,100.
> Sector Strength: The Nifty Metal Index is strong (up ~7% this month), which is why the stock is hugging the resistance rather than crashing.
📈 2. The Chart Structure (The Trap)
> The Box: ₹750 – ₹1,085 consolidation range. This "Time Correction" has been healthy.
> The Fakeout (This Week):
- The Move: The stock spiked to ₹1,104 (New High) but was hammered down to close below ₹1,085 .
- Interpretation: This leaves a long "Upper Wick" on the weekly candle, indicating that bears are still defending this fortress. A "Look Above and Fail" often leads to a short-term pullback.
📊 3. Volume & Indicators
> Volume: The "Above Average" volume on a rejection candle is a warning. It implies that while buyers tried to push up, sellers unloaded heavy quantities (Churning).
> RSI: Rising but showing a potential Negative Divergence on daily frames if price makes a high but RSI doesn't.
🎯 4. Future Scenarios & Key Levels
The trade is now an "Event Play."
🐂 Bullish Breakout (Post-Earnings):
- Trigger: A decisive Weekly Close above ₹1,105 (clearing the new wick).
- Target 1: ₹1,235.
- Target 2: ₹1,350.
🛡️ Support (The "Buy Zone"):
- Immediate Support: ₹980 – ₹1,000 .
- Strategy: If the stock dips to ₹980 before Jan 30, it is a low-risk entry.
- Stop Loss: A close below ₹950 invalidates the bullish structure.
Conclusion
This is a "Wait for Confirmation" Setup .
> Refinement: Do not buy the "intraday breakout." Wait for a Closing Basis breakout above ₹1,105.
> Action: Keep it on the watchlist. The real move will likely happen after Jan 30 results.

SILVER - HEALTHY CONSOLIDATION LONGSSilver doing a healthy consolidation - momentum intact.
very strong support for momentum to continue is $90, belov that momentum vill be lost.
small resistance at $93.50
major resistance at $95.50 - $96
above $96 v should likely test 3digits - $100.
above that vill be a price discovery one can trail at ST 1.5 on 75m chart.

HDFCBANK 4HR T/F ANALYSIS----
hdfcbank 4hr t/f analysis----- the top whole structure are bended both side which called structure is elips and it`s also dual direction in cans breakdown of elips into downside so we can measure elips of previous demand can measure body to body measure only green holding volume and interchange into supply so now we have a reversal area in this reversal zone wait for any bullish candle it`s help to confirmation to go with trend ok let`s see---

Hindustan Zinc (D): Bullish (Throwback to Support)(Timeframe: Daily | Scale: Linear)
The stock is undergoing a classic "Throwback" or "Re-test" phase after a confirmed Rounding Bottom breakout. While the 4% drop looks scary, it is a natural reaction (profit-taking) following the "News-Based" rally from the Q3 earnings.
🚀 1. The Fundamental Catalyst (The "Why")
The volatility is driven by two opposing forces:
> Bullish Engine (Results): HZL reported its best-ever quarterly numbers for Q3 FY26 (Net Profit ₹3,916 Cr, up 46% YoY), driven by the silver business. This fundamental floor supports the breakout.
> Bearish Trigger (Today): Silver prices, which had been vertical, saw a sharp correction in global markets today. Since HZL is now a "Silver Proxy," its stock price reacted immediately.
📈 2. The Chart Structure (Rounding Bottom Re-test)
> The Pattern: A Rounding Bottom (Jul 2024 – Jan 2026).
- Neckline: ₹654 – ₹660 . This was the ceiling for 6 months.
> The Current Move (The Throwback):
- Breakout: The stock cleared ₹660 on Jan 19/20.
- Re-test: Today's fall to ₹668 is bringing the price back to check if the "Old Ceiling" (660) can act as a "New Floor."
- Volume Warning: The 28.2 Million volume on a red candle suggests aggressive selling/profit-booking. The stock must stabilize near ₹660 quickly to absorb this supply.
📊 3. Technical Indicators
> EMAs: The Positive Crossover (PCO) remains valid. The stock is still trading well above its 20-Day EMA (approx. ₹630), so the intermediate trend is intact.
> RSI: The dip today has cooled the RSI from "Overbought" levels, which allows fresh momentum to build if support holds.
🎯 4. Future Scenarios & Key Levels
The trade is at a critical "Buy the Dip" zone.
🐂 Bullish Continuation (The Bounce):
- Trigger: Validation of support at ₹660 . Watch for a reversal candle (Hammer/Doji) here.
- Target 1: ₹716
- Target 2: ₹807 (ATH).
🛡️ Support (The "Must Hold"):
- Immediate Support: ₹654 – ₹660 . The Neckline.
- Stop Loss: A daily close below ₹640 would imply the breakout was a "Bull Trap" (Failed Breakout) and could send the stock back to ₹600.
Conclusion
This is a High-Risk, High-Reward Setup .
> Refinement: The "Fall" is likely a buying opportunity provided ₹660 holds.
> Strategy: Wait for the selling frenzy to settle.

Cdsl breakdown 20 jan, support at 1248 and 1040#cdsl
Brutal downfall seen on charts and level of support at 1248 and 1050.
Hope this level will see a huge support and spike.

Nifty at 200 dema and at make and break level 20 janNifty broke the previous support and fallen down again.
Now it also touched 200 dema, looking at global factors it can breach further and seek support at 25049.
If that is broken too then no mercy...
#nifty

Nifty analysis 19 jan on 4 hr time frame#nifty
As plotted in charts nifty can give a breakout and breakdown on break of respective support and resistance.
Either side a rally of 440 point is anticipated.
This can be played with a adeqaute sl via etf or options or fut as per risk capacity...

Hblengine: accident a opportunity or charm is lostHblengine which has given multibaggeer returns and awesome results over the last 2-4 years.
It was 10% down today and a light recovery from 200 day ena.
My perception is as long as 200 dema is protected we are safe and we can see ath in this year.
Order miss but still having good order book and working in multiple segments.

