Dr. Reddy’s Breakout + Bullish Stochastic + Volume Surge = ₹1307🔍 TECHNICAL HIGHLIGHTS:
📉 DESCENDING WEDGE BREAKOUT:
Price has decisively broken above the wedge resistance, signaling a trend reversal.
🚀 GAP-UP OPENING:
Signals aggressive buyer interest and bullish sentiment.
🔄 STOCHASTIC OSCILLATOR:
Fast %K line has crossed above the slow %D line in the oversold zone, indicating momentum is shifting to the upside.
🔊 VOLUME SURGE:
Heavy volume during breakout confirms strong buying pressure and likely institutional participation.
🎯 TRADE SETUP:
✅ PROFIT TARGET : ₹1307
❌ STOP LOSS: ₹1221
📌 CONCLUSION:
All indicators align for a potential bullish rally. With pattern confirmation, momentum support, and volume validation, this setup looks promising. Watch for follow-through price action and volume consistency.
Volume

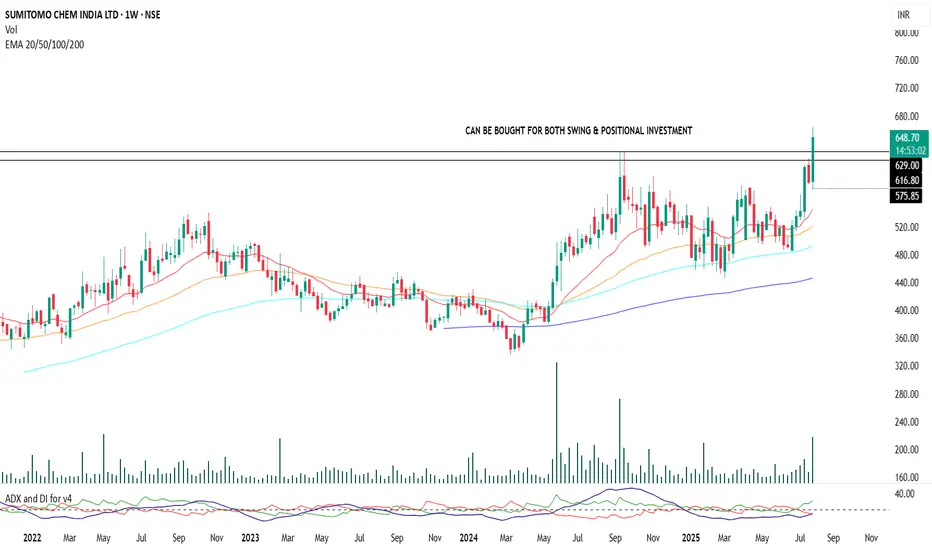
Sumitomo Chemical | Positional Swing Setup with Dynamic SLA strong setup is forming in Sumitomo Chemical with bullish c price action and trend indicators. Entry can be been initiated at current levels with small quantity with a stop-loss placed at ₹570 on a weekly closing basis.
No fixed targets. This is a trailing stop-loss-based position aimed at capturing a sustained trend move.
Add-on Zone: If the price retests the support near the ₹630 level (previous structure/support), more quantity will be added as part of a pyramiding strategy, provided broader market structure remains bullish.
Indicators Used for Trailing SL & Confirmation:
ADX & DI , RSI Levels
Exit Criteria:
Weekly close below ₹570 (hard stop)
Note: This is a disciplined, structure-based swing trade with optional pyramiding. Avoid impulsive exits; trail stop-losses logically based on trend indicators.
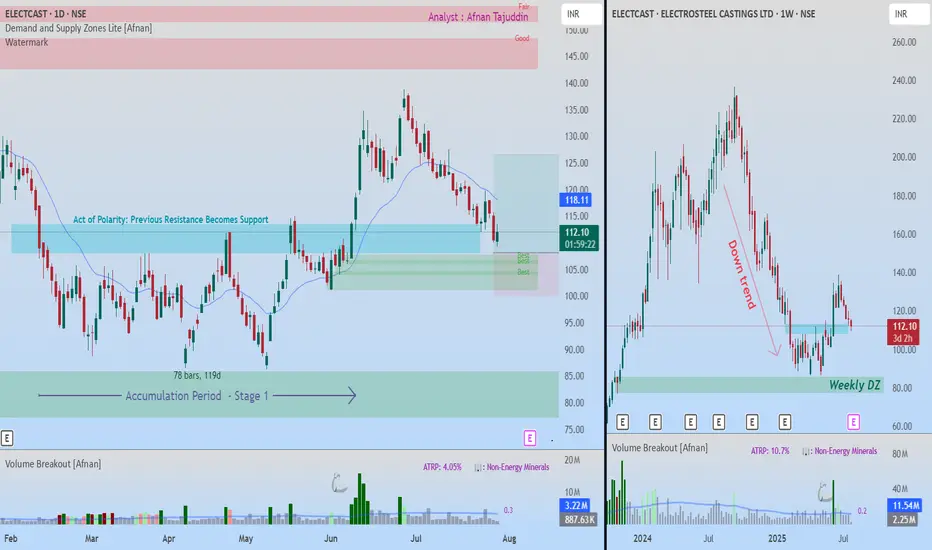
ELECTCAST Analysis – Breakout Retest or Smart Money Re-Entry?Let’s analyze the chart of Electrosteel Castings NSE:ELECTCAST through two distinct lenses:
1️⃣ Demand and Supply Theory
2️⃣ Traditional Technical Analysis
🧱 Smart Money Footprint: Demand & Supply Zone Perspective 🧱
On the weekly chart, the price had been in a steady downtrend since September 2024. But then came a major reversal from a strong weekly demand zone.
This zone is not just a box on the chart — it’s a footprint of institutional smart money. Such zones often represent areas where:
🔹 Institutions previously placed large buy orders.
🔹 There may still be pending orders left unfilled.
🔹 Or, institutions may look to accumulate more, continuing their previous buying activity.
After the price hit this zone:
🔹It reacted sharply upward — a sign of strong demand.
🔹Then, it moved into sideways consolidation, forming a potential accumulation phase.
Zooming into the daily chart, this base was eventually broken with strength, confirming a trend shift.
Now, price is pulling back — and here’s what’s important:
🔹 There are three overlapping demand zones on the daily chart.
🔹 These form a “level-on-level” structure, meaning demand is stacked in layers.
🔹 While the height of these zones is small (good risk-reward), the structure shows deep, layered buying interest.
This pullback into a stacked demand zone — especially after a major trend reversal — is a classic smart money re-entry zone.
📈 Traditional Technical Analysis: Breakout and Retest 📈
Now let’s look at it from a conventional technical trader’s view:
On the weekly chart, the price had been in a sharp downtrend starting from September 2024. But eventually, the fall slowed, and price began consolidating.
Zooming into the daily chart, this consolidation phase lasted over 120 days — and it wasn’t just a pause, it was a full-fledged accumulation. Here’s why:
1️⃣ A well-defined base formed.
2️⃣ There was a spring pattern, where price briefly dipped lower to trap weak sellers.
3️⃣ Tight consolidation followed by a powerful breakout.
4️⃣ Most importantly — the breakout was backed by strong volume, confirming conviction.
After the breakout, price is now:
🔹 Pulling back toward the previous resistance — the ceiling of the accumulation zone.
🔹 That resistance is now acting as new support, forming a classic breakout retest setup.
This is what traditional traders love:
✅ Clear structure.
✅ Confirmed breakout.
✅ Pullback to a well-defined level.
🎯 Confluence = Confidence 🎯
Here’s where it all comes together:
🔁 The breakout retest level is also the exact region where three daily demand zones overlap.
🔁 That entire cluster sits above a major weekly demand zone.
🔁 Both demand-supply theory and traditional technical patterns agree: this is a high-probability reversal zone.
Such confluence adds significant weight to the idea that buyers may soon step in again.
⚠️ Final Thoughts ⚠️
This chart isn’t about prediction — it’s about preparation. When multiple theories agree at the same price point, it’s a sign to pay attention.
“The best opportunities don’t scream — they whisper, where smart money operates quietly.”
Lastly, Thank you for your support, your likes & comments. Feel free to ask if you have questions.
💡 Great trades aren’t rushed — they’re patiently waited for. Trust the process. 🎯📊
📝 This analysis is purely for educational purposes and is not intended as a trading or investment recommendation. I am not a SEBI registered analyst.
Lauruslabs-It can fly towards ATH again!Lauruslabs has given a good breakout of trendline and horizontal resistance with volume.
Stock is looking strong for a reversal and can fly towards ATH if market supports.
Keep in watchlist.

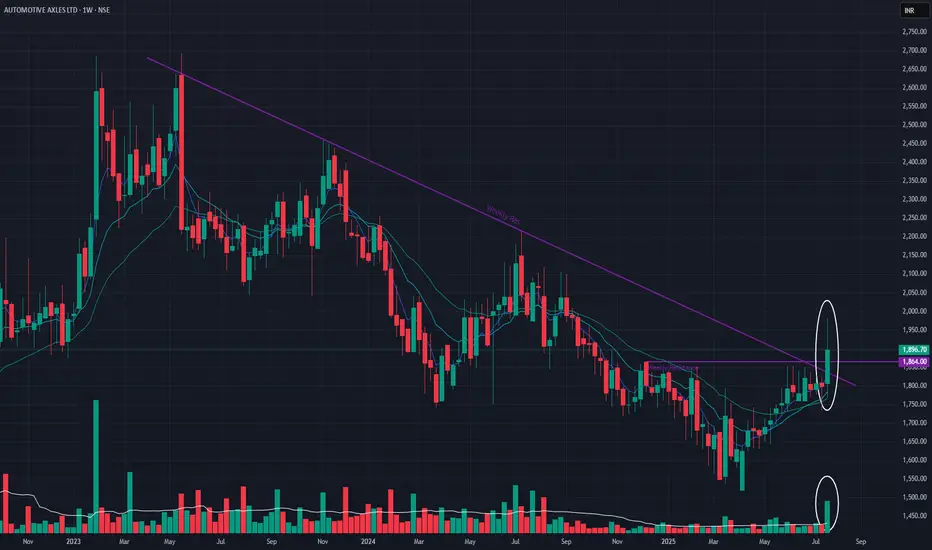
Automotive Axles Ltd (Weekly Timeframe) - Potential Reversal ??After the Double Top formation (May 15, 2023) in weekly timeframe, the stock has been in a downtrend. With this week's price action, the stock seems to BreakOut of a Weekly resistance zone with good volume. EMAs are also in positive state.
A Long-term angular resistance BreakOut along with Short-term resistance BreakOut makes this more significant to consider as a reversal sign. Watchout for next week's price action to determine if the reversal signs are intact or not. If it does, then the next target maybe 2,100.
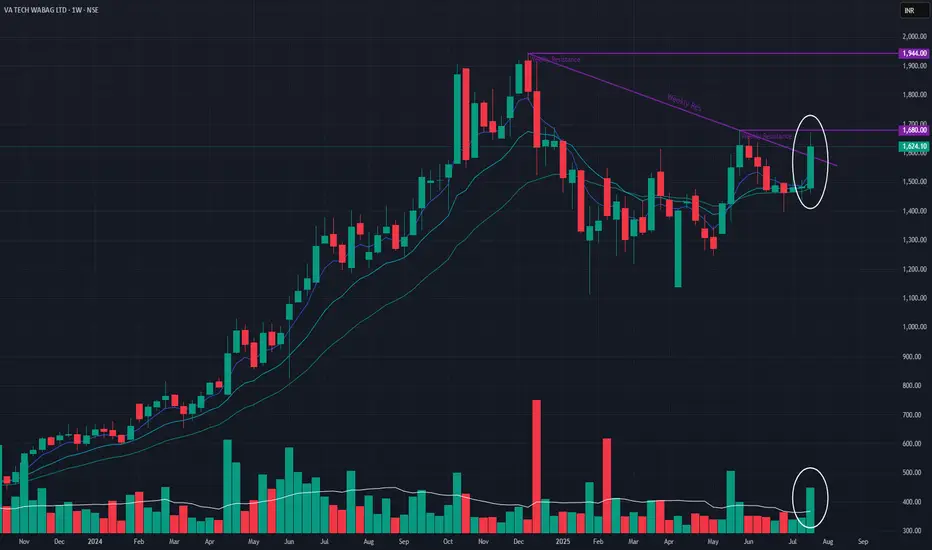
VA Tech Wabag Ltd (Weekly Timeframe) - Potential BreakoutOn weekly timeframe the stock has made-up for all those past 7 weeks of loss with a 9.30% gain with huge volume. The stock also BrokeOut of a longterm weekly angular resistance zone. The coming week if it can BreakOut of the short-term weekly resistance with some good volume, then it may go up to 1,944 in the near future , which is the ATH.
In Daily timeframe, a Golden Cross-over is formed as well, that suggests a bullish sign.
Keep monitoring the coming week's price action.
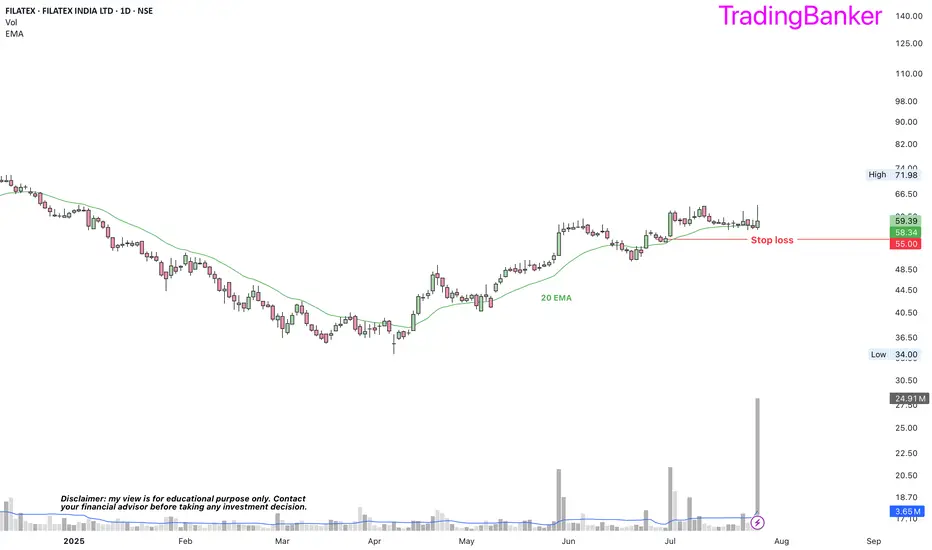
FILATEX: a probable long➡️decent RS rating
➡️improvement in EPS YoY, cash cycle and operating cash flow
➡️promoter holding at 65%
➡️trading above 20 EMA
➡️entered with a stop loss of 55
➡️huge volume spike
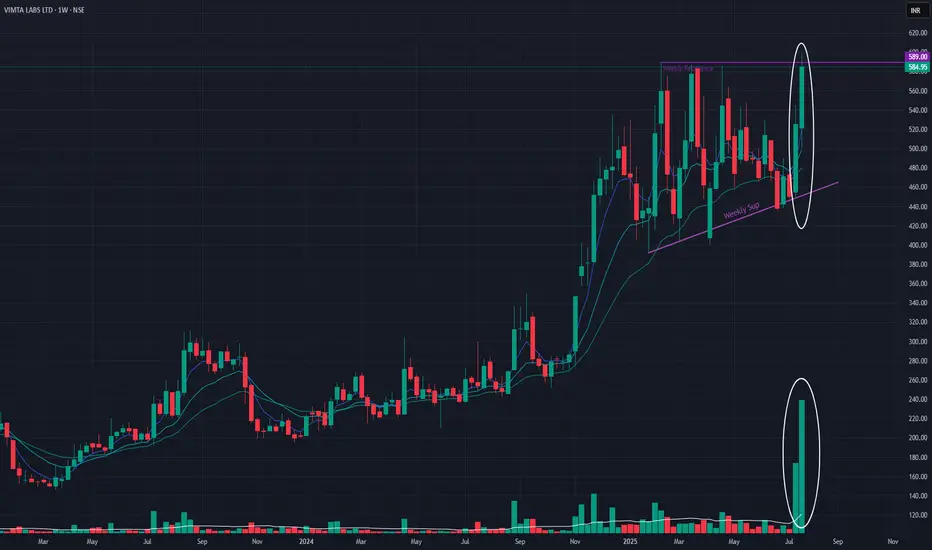
Vimta Labs Ltd (Weekly Timeframe) - Potential BreakoutThis week, the stock has breached the resistance zone and made a new All Time High with huge volume. In Daily Timeframe, the stock has clearly been forming an Ascending Triangle Pattern which is a Bullish pattern. If the stock breaches the resistance zone with good volume, then it may reach new All Time Highs of 780 range.
Awaiting further Price Action.
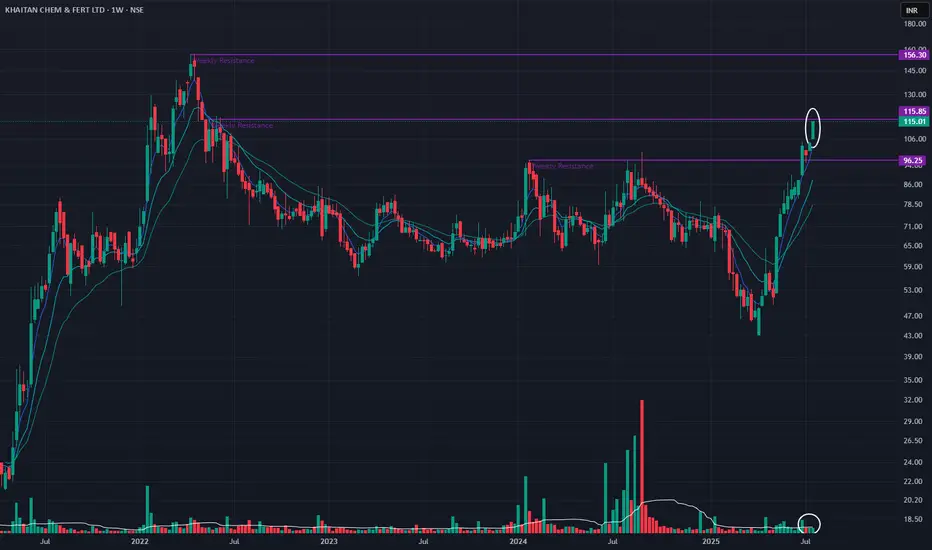
Khaitan Chem (Weekly Timeframe) - Potential BreakoutThe stock has been in a Uptrend since few weeks & a few weeks back it BrokeOut of a Long-term resistance with good volume and there after has been on the uptrend. This week it has reached a key resistance zone. If it can continue the momentum, the stock may BreakOut of the zone and it's next target can be the All Time High at 156 . EMA's are all in PCO state which is a bullish sign .
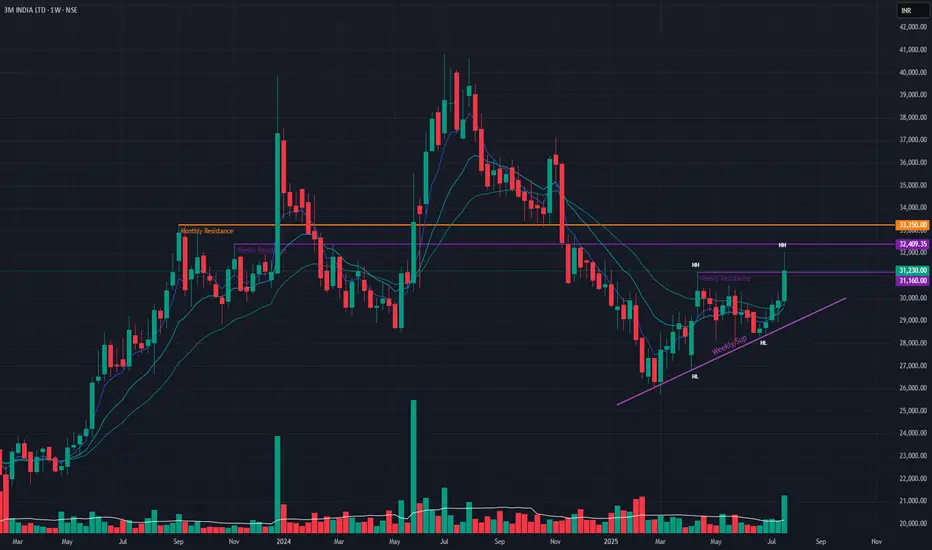
3M India Ltd (Weekly Timeframe) - Potential BreakoutPast few weeks, the stock has been in an uptrend and has breached the short-term weekly resistance during this week with HUGE VOLUME . Next target for the stock is to breach the weekly resistance zone near 32,405. During the week, a positive cross-over of EMAs has been established, indicating positive signs. With this week's bullish candle, the stock has made Higher Highs (HH) while breaching the short-term weekly resistance.
Keep a watch on the stock for next week.
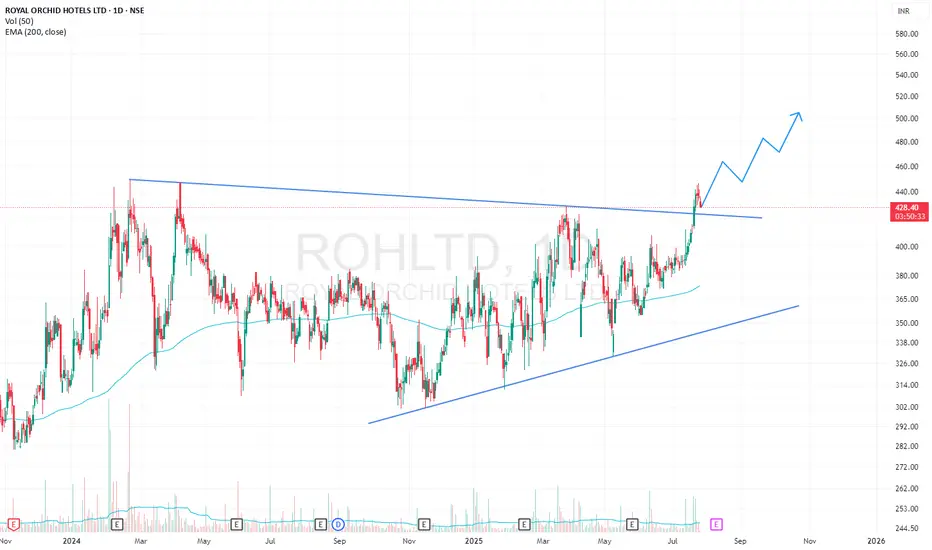
ROHLTD Triangle BreakOut 1DRoyal Orchid Hotels has given a breakout from triangle pattern on 1D timeframe. It has given a breakout with high volumes. It is currently trying to retest its breakout resistance.
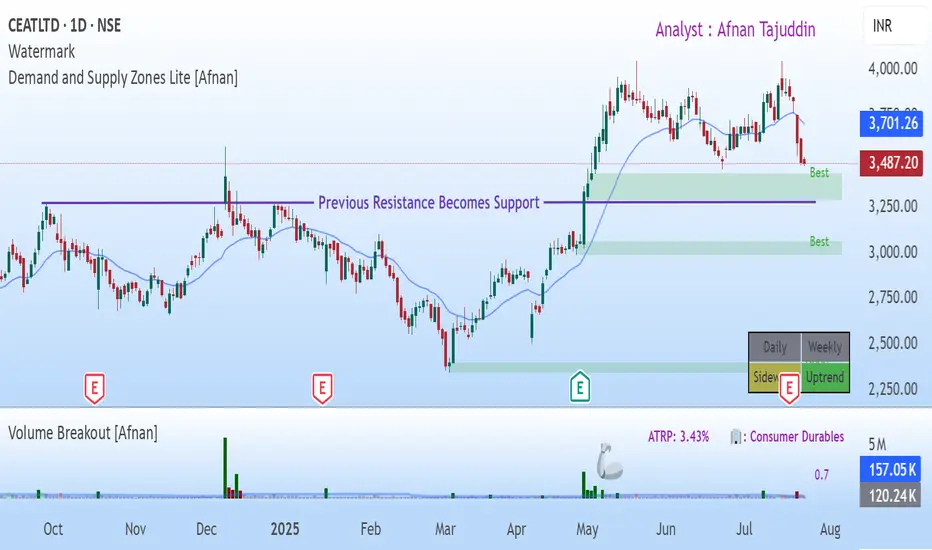
CEAT Ltd: Is a Rebound on the Horizon? A Confluence of TechnicalTraders — let’s dig into CEAT Ltd NSE:CEATLTD . where both demand-supply dynamics and classic technical signals are flashing something worth watching. What’s setting up here isn’t just noise — there’s real structure underneath the surface.
Demand Zone & Institutional Footprints
Let’s start with the core of this setup: the Demand Zone. CEAT’s price is inching toward a daily timeframe Rally-Base-Rally zone — and not just any zone, but one that stands out in terms of quality.
Why does this matter? Because these aren’t retail-driven bounces. These are often the hidden footprints of institutions quietly building positions.
On June 23rd, price came close to this very demand zone — and without even touching it, we saw a sharp bounce. That’s a strong tell. There’s clear demand waiting just below.
Institutions don’t throw their entire order book at the market in one go. They scale in. So when price comes back to this area, it’s likely to trigger those leftover buy orders — potentially leading to another move higher.
Zooming out to the broader view : Both weekly and monthly charts are still in an uptrend. There are no obvious supply zones on the higher timeframes That clears the runway for bullish continuation.
💡 Traditional Technical Analysis Perspective 💡
Now let’s switch gears for a moment and take a look through the lens of classic technical analysis. What’s the chart telling us in plain sight?
CEAT spent months coiling within a consolidation range — nothing impulsive, just sideways chop.
But that changed on April 30th with a decisive breakout. And this wasn’t on light volume — it came with strong participation, a real sign of conviction.
Post-breakout, we’ve seen consistent volume buildup alongside price progression. This isn’t a one-day wonder — it’s been developing.
Act of Polarity at Work: The breakout level had previously acted as firm resistance multiple times. Now that price is retesting it from above, it’s doing exactly what we expect — flipping that resistance into potential support.
Interestingly, this retracement is happening on declining volume. That’s key. It often suggests a healthy retest rather than a breakdown — a potential “buy the dip” scenario, if you will.
🤝 The Confluence: Where Two Worlds Meet 🤝
Here’s where things get really compelling — that demand zone we highlighted? It aligns perfectly with the same level that’s being retested post-breakout. That overlap — this confluence — is no coincidence.
It dramatically increases the odds of a strong bounce, because we’re getting validation from two independent analytical frameworks. When price, psychology, and institutional footprints all point to the same zone — you pay attention.
We could consider a tactical Stop Loss just below the demand zone. And in terms of upside? The previous swing high near ₹4000 stands out as a logical first target.
"Success in trading is a marathon, not a sprint. Consistency, discipline, and effective risk management are your true North Stars."
Stay sharp. Even the cleanest setup can fail — and that’s why managing risk isn’t optional. If price violates the zone and closes below your SL, step out without hesitation.
Thanks for reading — your support, feedback, and questions always help drive this community forward. Let’s keep sharpening our edge together.
🚀 Trade smart, stay disciplined, and let your journey be one of continuous learning! 🚀
Disclaimer: This analysis is intended purely for educational purposes. It does not constitute investment advice or a trading recommendation. I am not a SEBI-registered advisor.
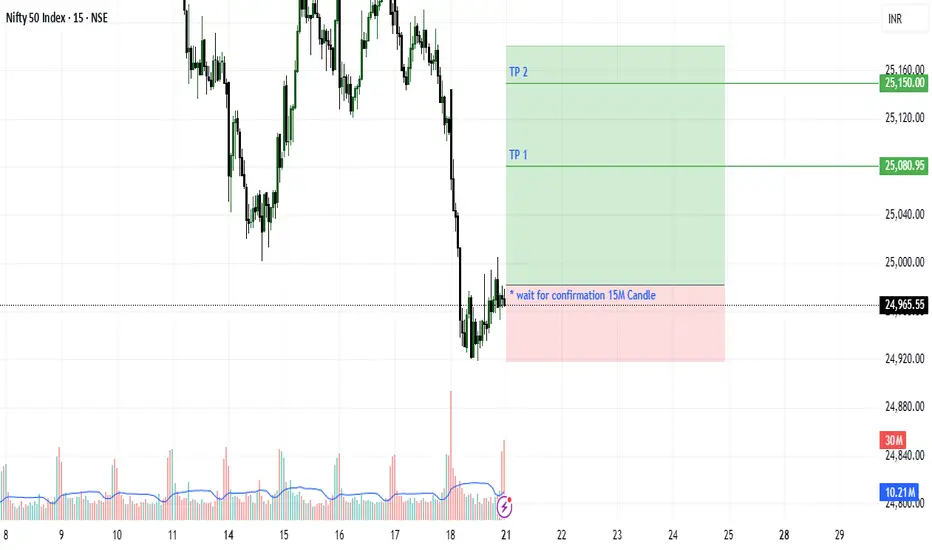
Nifty 50 21/07Just My View
Price Action Analysis for Monday 21/July
Scalping Plan – Buy
Entry: 24,960–24,980 (Only on bullish engulfing / hammer candle)
Stop Loss: 24,920 (below recent wick low)
TP1 25,080 (minor imbalance zone)
TP2 25,150–25,180 (supply area from last breakdown)
* Entry confirmation: Look for a green candle with higher low and closing above previous red candle body.
KIRLOSBROS – A Demand-Supply Sweet Spot? My Take!🔍 What Got My Attention
We’re seeing price approach a well-formed Rally-Base-Rally demand zone, and to me, it’s got the fingerprint of institutional activity written all over it. These zones don’t just appear randomly—this kind of structure often suggests that big players may have unfinished business here, footprint of pending orders.
📐 The Demand-Supply View
Price is entering a daily demand zone —a clean RBR structure .
Just yesterday, we saw a bullish reaction candle form right off that zone. For a demand-supply trader, that’s confirmation—plain and simple.
Stop-loss placement? : just below the demand zone. And the logical target? The next known supply zone on the chart.
What’s more, the weekly chart already confirmed strength. Price bounced from weekly demand zone and powered through a traditional daily resistance—clear signs of momentum shift.
Encouragingly, there's no higher-timeframe supply standing in the way. That clears the runway.
From a demand-supply lens, this is the kind of setup we wait for—strong zone, confirmation signal, no conflicting zones above. It’s not about chasing; it’s about reacting when price comes to us.
📈 What Traditional Technical Are Saying 📈
Now, if we set aside the supply-demand lens for a moment and look at it through a more traditional view, things still line up nicely.
stock was clearly in a downtrend earlier—but that changed when it hit the weekly demand zone or say support area and reversed with strength.
What followed was a period of consolidation. That’s normal—markets pause before deciding on direction.
Then, on June 25th, the trend shifted. Price broke out above both horizontal resistance and a sloping downtrend line— and it did so with volume.
This wasn’t a fake breakout either. Price held above the resistance.
The current pullback? Honestly, it's healthy. After a move up, a dip into support (especially when it lines up with demand) often builds the base for the next leg higher.
And guess what—price is taking support from 20 EMA, which just adds to the confluence.
So even if you’re not a die-hard supply-demand trader, the technicals are telling a similar story: breakout, volume, support holding, pullback into structure—it all points toward potential continuation.
🧠 Why This Setup Stands Out 🧠
What I find compelling here is the alignment across both schools of thought which is not necessary but whether you're supply demand trader or tracking breakouts, both giving positive signal.
It's the kind of scenario where you don’t need to overcomplicate things. You’ve got:
Structure that makes sense.
Clear reaction at a proven level.
No HTF supply zone to kill the momentum.
Now, does that mean it's guaranteed to rip higher? Of course not. But when technical logics all align—this is where probability starts leaning in your favor.
🚀 Fuel for Your Trading Mindset 🚀
"You don’t need to catch every move. You just need to position yourself where risk is small and the story makes sense. 🎯"
📌 Disclaimer 📌
This analysis is shared strictly for educational purposes . It is not a recommendation to buy or sell any security. I am not a SEBI registered analyst .
Lastly, thank you for your support, your likes & comments. Feel free to ask if you have questions.

Aarti Drugs Ltd (Daily Timeframe) - Potential BreakOutThe resistance zone (560-570) was breached only once , and thereafter, the stock was in a downtrend for a prolonged duration. Recent past, the stock has been forming Higher Lows & a buildup in volume in the past few days. The stock gained almost 19.5% over the last few days, assisted by huge volume. On Jul 15, the stock BrokeOut of a major resistance with huge volume, and today it tried to breach the long-term resistance.
The Short-term EMAs are in PCO state as well as a Golden Cross-over has formed few days back, which indicates further uptrend.
We should monitor the stock in the coming days for its price action to take a call.

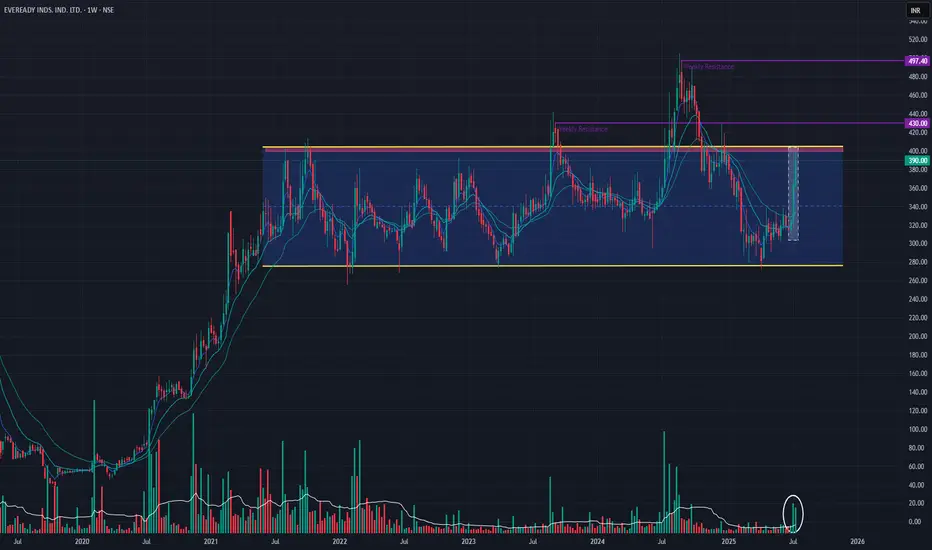
Eveready Inds. Ind. Ltd (Weekly Timeframe) - Potential BreakOutThe stock has been in a range since 2021, with couple of BreakOuts (2023 & 2024) which did not sustain momentum. Past 3 weeks the stock has gained appox: +29% with huge volume buildup . The short-term EMAs are in PCO state, indicating an uptrend . The stock may BreakOut of the resistance zone (398 - 406), if buyers show interest in the stock to take it further up.
Watchout for next week's price action!!
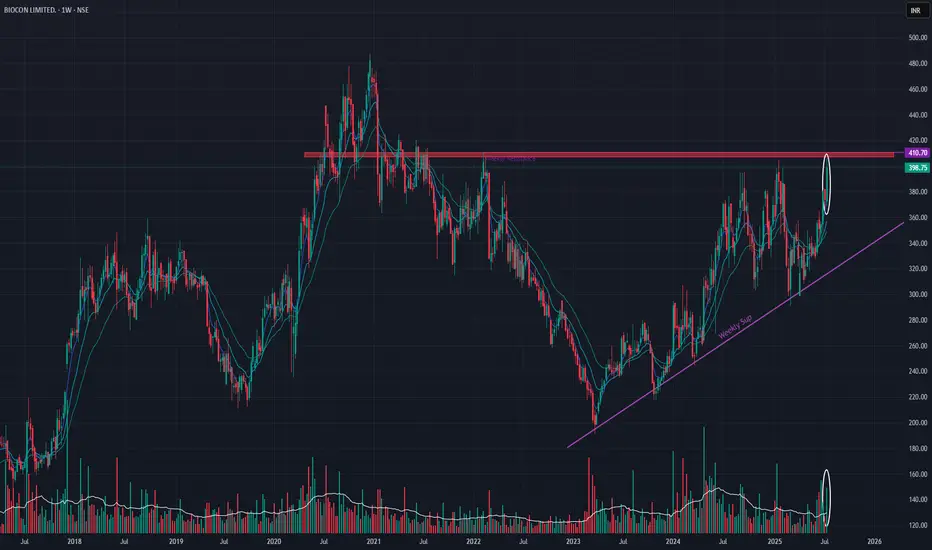
Biocon Ltd (Weekly Timeframe) - Potential BreakOutSince Feb 2021, Biocon has tried to BreakOut of the resistance zone (407 - 411) , without any success. In the recent past (Sep 2024, Jan 2025 & last week) as well it tried to BreakOut of this zone . Last week there has been a gain of +6.56% as well as HUGE spike in volume suggesting buyers interest in the stock, which could mean that the stock may gain momentum and may breakout of the resistance zone. EMA's are also in a PCO state , suggesting an uptrend.
Next week's price action could provide an insight into the stock's trend.
Greenply Industries Ltd (Weekly Timeframe) - Potential BreakOutGreenply was in a downtrend since Aug 2024 and since Feb 2025, the stock has been in an uptrend forming Higher Lows . Last week it has BrokenOut a major resistance with +9.01% gain including a huge spike in volume . If the momentum continues, it may BreakOut the next key resistance at 365.
To be monitored !!

Parag Milk Foods Ltd - Potential BreakOutThe stock has not been able to BreakOut of one of the major resistance zone - 265 - 268 (since March 2019) for a while. Since past few weeks the volume is increasing and a potential BO could be likely. Positive Cross-Over of short term EMAs are also visible which may indicate a potential uptrend and BO.

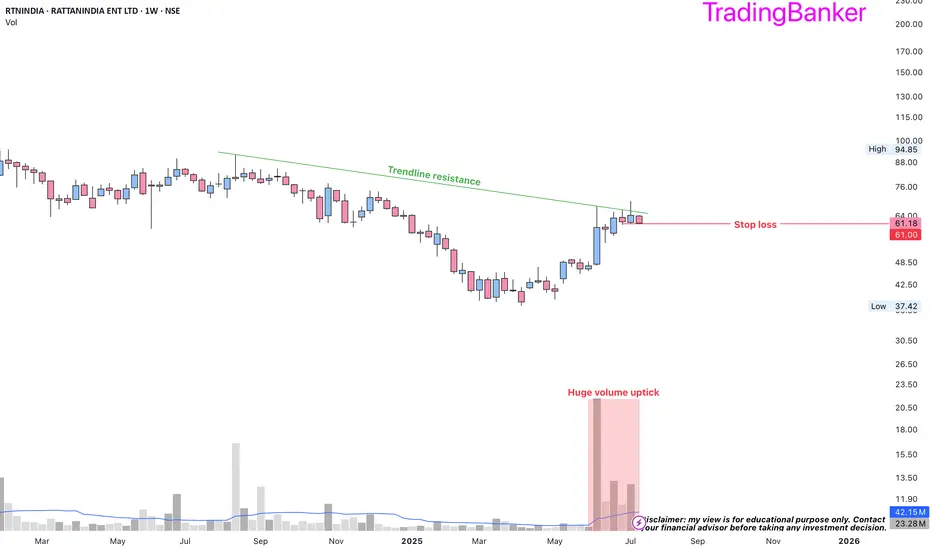
RTNINDIA: high reward to risk ratio➡️heavy volumes and big candles are the footprints of institutions
➡️Fund raising approved for business opportunities
➡️entry price 62.75 with a SL of 61
➡️since the #breakout was not confirmed, moved my SL within a few percentage points
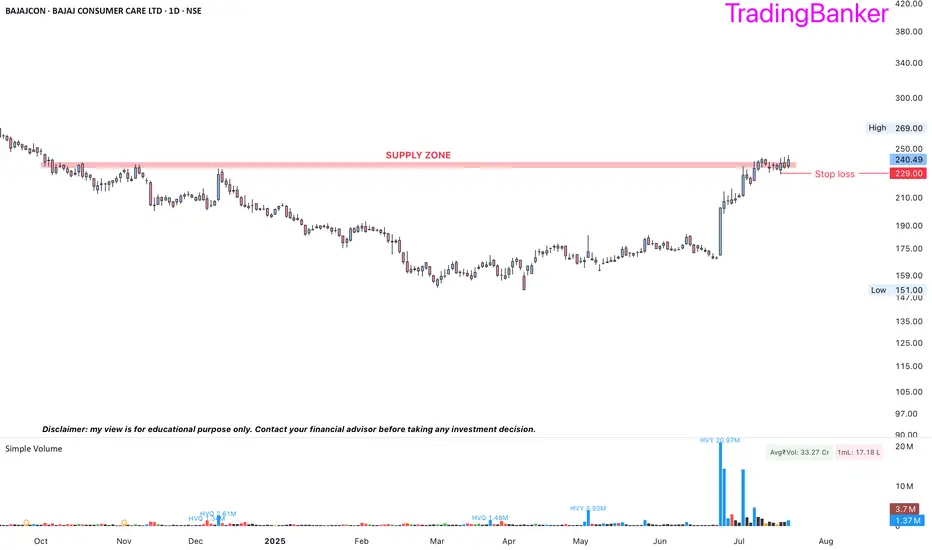
BAJAJCON: a probable long trade➡️heavy volumes and big candles are the footprints of institutions
➡️entry price 233 with a SL of 229
➡️consumption theme
➡️supply zone breakout in the offing and may turn out to be a high reward to risk trade
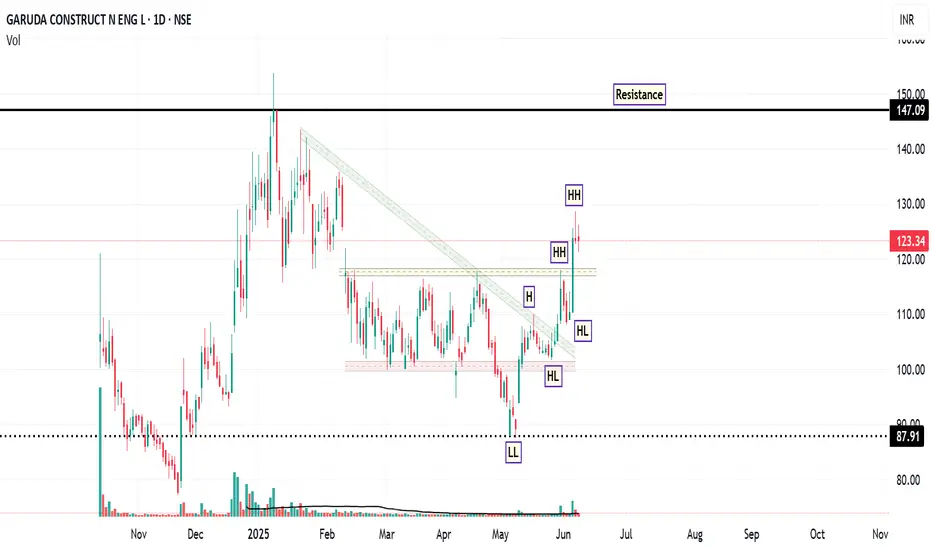
Garuda: Riding the Momentum WaveFrom February to late May 2025, the stock of GARUDA was trading in a sideways consolidation range, roughly between ₹100 (support) and ₹115-₹120 (resistance). The recent powerful green candles have shattered the upper boundary of this range. Also, the most significant event on the daily chart is the decisive breakout from a descending trendline that had capped prices. Also, LL and HH formation observed on daily chart.
The breakout was accompanied by a significant spike in volume ( 862.88K shares ), which is substantially higher than the average volume during the consolidation period. High volume on a breakout lends strong credibility to the move.
The RSI is at a strong 69.20 . It is in bullish territory and rising, indicating strong buying momentum. It is approaching the overbought region (>70), but is not there yet, leaving room for further upside before becoming extended.
If the stock consolidates above the ₹120-₹121 support level. Buyers step in on any minor dip till ₹118 , and the price then continues its upward trajectory towards the resistance targets of ₹129 and subsequently ₹149 .
Disclaimer: This technical analysis is for informational purposes only and should not be considered as financial advice. Trading in the stock market involves risk. Always conduct your own research and consult with a qualified financial advisor before making any investment decisions.