VIPIND: Unlocking Potential After Downtrend
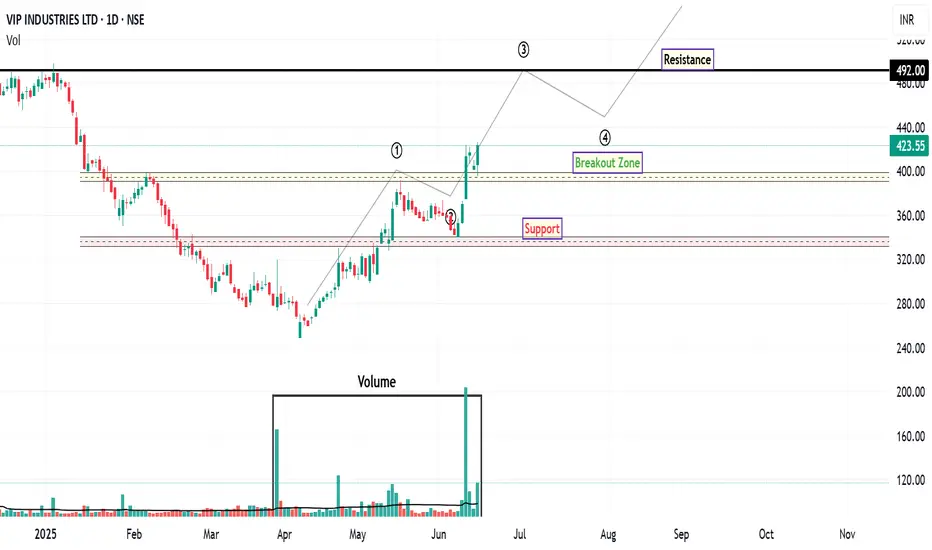
VIP Industries has demonstrated robust bullish momentum over the past few trading sessions, signaling a notable shift in market sentiment. This upward trajectory is particularly significant given the stock's prolonged downtrend since October 2024.
From an Elliott Wave perspective, the recent price action suggests the potential completion of a corrective phase. The retracement from what appears to be Wave 1 to Wave 2 aligns closely with the 61.8% Fibonacci retracement level, which often precedes the initiation of a strong Wave 3 impulse. This potential wave structure, if confirmed, could indicate further upside potential.
A key development supporting this bullish outlook is the stock's recent decisive close above its 200-day EMA, accompanied by a significant surge in trading volume. This confluence of price action and volume confirms strong buying interest and suggests a potential long-term trend reversal. The increased volume further validates the strength of the breakout, indicating broader market participation.
While the immediate outlook appears constructive, traders should be mindful of potential profit-taking around the ₹446 level. This area may present a temporary resistance zone where some short-term corrections or consolidation could occur. However, should the stock successfully navigate this level, the next significant upside resistance target to monitor is ₹492 . This level aligns with prior price highs and could represent a more substantial challenge for further upward movement.
For risk management purposes, a prudent approach would involve considering a stop-loss order positioned below the identified support zone, as depicted on the chart. This strategy aims to mitigate potential downside risk in the event of an unexpected reversal in market sentiment.
Disclaimer: The information provided in this technical analysis is for informational and educational purposes only and should not be construed as financial advice. It is based on observations from the provided chart and commonly used technical indicators. Market conditions can change rapidly, and past performance is not indicative of future results. Always conduct your own comprehensive due diligence and consult with a qualified financial advisor before making any investment decisions.
Volume
SBIN ASCENDING TRIANGLE BREAKOUTSBI breaking ascending triangle pattern
with huge volume bullish rsi
breaking 835 will give more upside
#target 870-912
NO BUY/SELL RECOMENDATION

Bosch continue trade added fresh breakout aheadBosch early trade had given good returns and now we can expect more bugger high 40000--44000 on cards

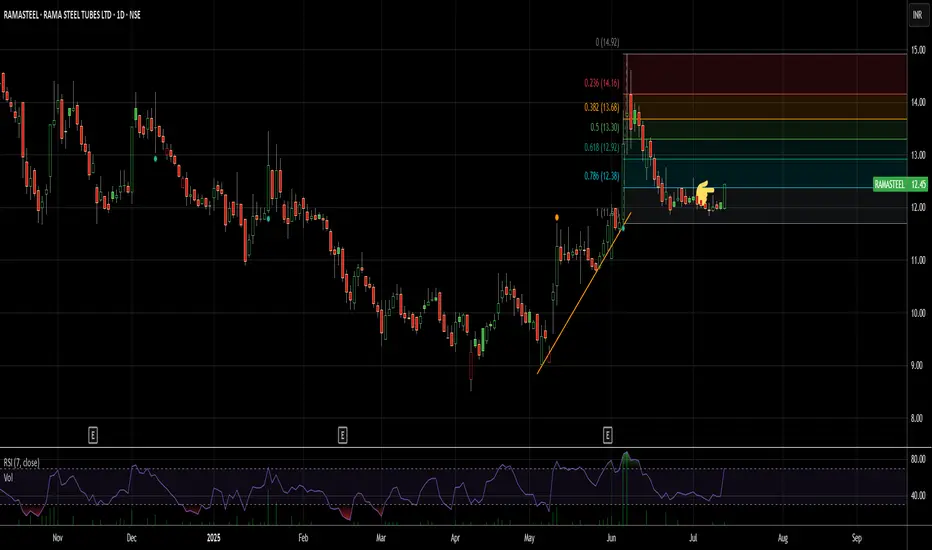
Making a better breakout candle in a consolidationThe overall steel space looks okay
Entry: 12+
Target in short term: 15%
Long term: Covering the whole retracement move back to highs
GLENMARK ROUNDING BOTTOM BREAKOUTGLENMARK breaking ronding bottom weekly
with good volume building up
trading at ATH bullish RSI
NO BUY/SELL RECOMENDATION

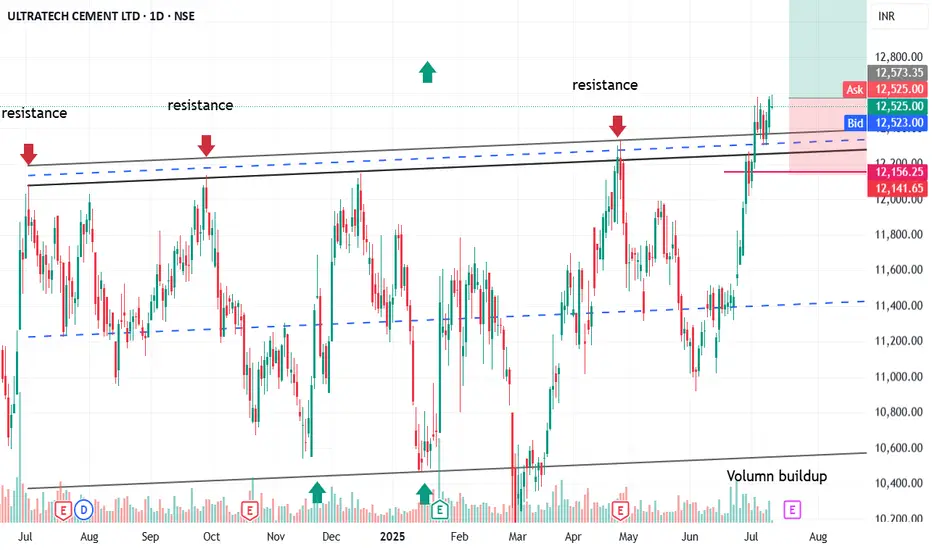
ULTRACEMCO : A opportunity to get 1: 4.5 RR in channel BO• Ultra tech was moving in parallel channel from Q3-2024.
• A perfect channel could be fitted on the stock.
• Last 1 weeks there is a significant volumn spike in the stock.
• Last week closing was above the channel
• If this week closing is above previous week closing then bullish move confirmed
• Swing stop loss is 1214
• Target are channel length + 12500 that is 12500 + 2000=14500 in the chart.
• An opportunity of 1: 4.5 RR in swing trending.
• Already retested the support
• Go long only when todays daily close is above yesterdays close. As index looking week tread with caution and sl.
• Idea is for educational purpose and explore the price action learning with trading psychology.
• Have fun traders!!! 😊
Rossari Biotech Long setup 1:5 RR (Textile chemical sector)
Buy Rossari Biotech long setup
Between 700-710
Stop loss: 665
Target 1: 765
Target 2: 830
Target 3: 862
Trade as per your risk-taking capacity.
Triangle Pattern and trend line breakout with volume
They are among the largest manufacturers of textile specialty chemicals in India.
If US-India trade deal benefits textile sector, this will start running.

Motherson Sumi Cup BreakoutBreakout from cup pattern yeaterday supported by large volume levels (5x from average)
RSI at 74
ADX at 19 with positive ADX at 39
Macd crossover confirming the bullish pattern
Buy level 63-64
Target 66 - 68 - 73++
SL 58

Relaxo Footware looking interestingNSE:RELAXO
After a long consolidation for about 4 months, now the stock is trying to breakout.
Stock Volume and Delivery surged by 2.4 times and 3.4 times respectively indicating good interest.
Market cap of the footwear sector is increased by 1.2% in last trading session
RS crossing above zero indicates the outperformance
RSI going above 70 indicates great momentum
Closed above 100 DEMA. Next resistance is the 200 DEMA around 540.

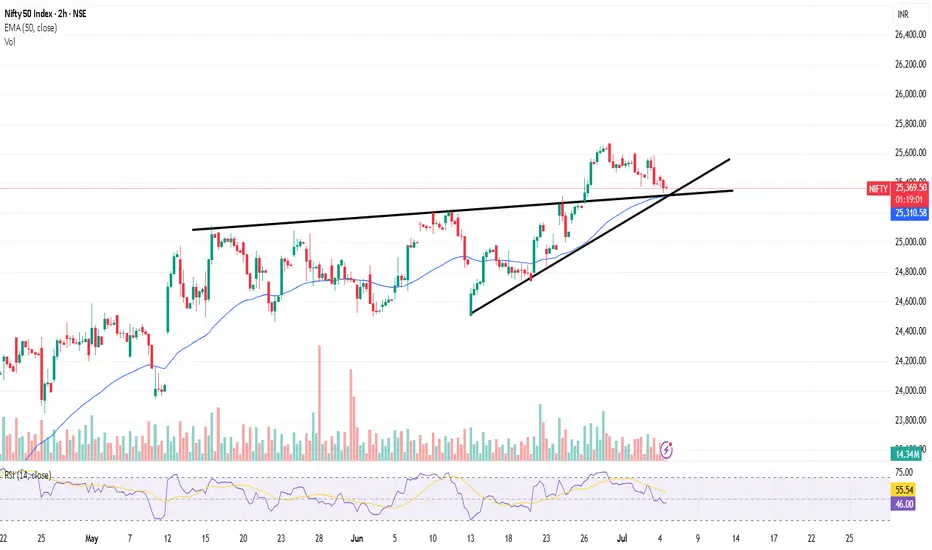
NIfty Bullish Breakout RetestHello Everyone,
Profit Booking in nifty from 25660 to now 25330__RSi also adjusted from overbought to now at 45-50 Volume shows sellers dont have enough strenth to push the market down ....Clearly Buy on dips set up with all the conflunence EMA support and Trendline support makes set up more stronger.
Get ready For new Lifetime High.
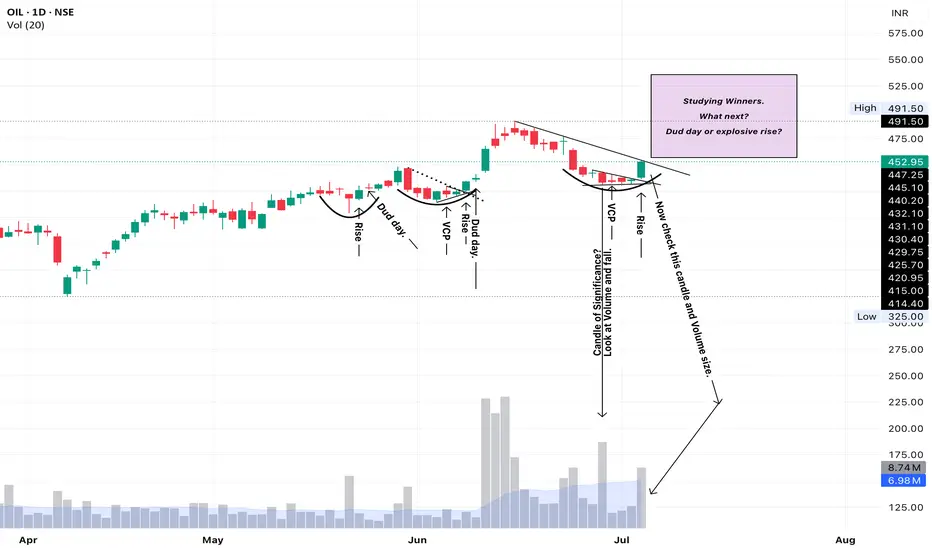
OIL - VCP and riseDisclaimer: I am not a SEBI Registered Analyst. Please do your own research or study.
Also , point out any anomaly you see and assist correct bias.
My Bias: Bullish. If not moved in 2-3 days, this may fade.
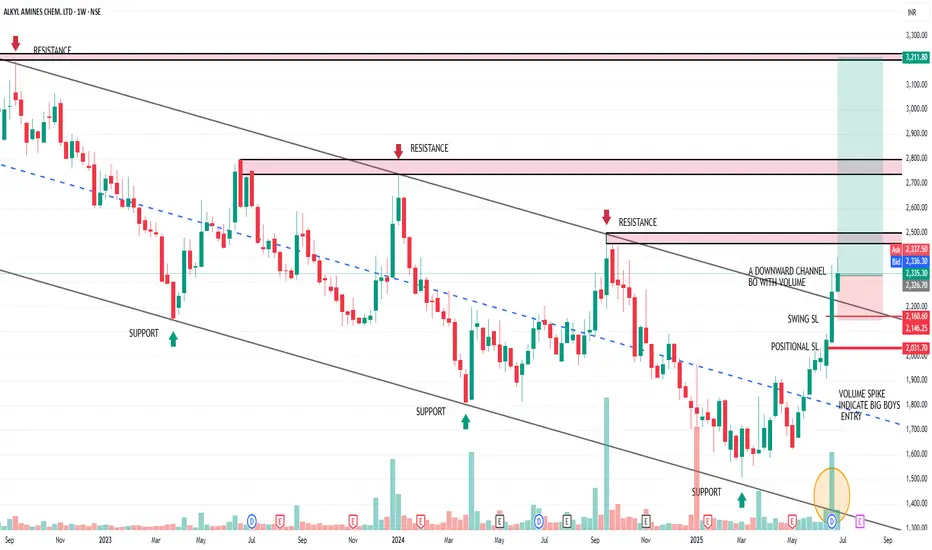
ALKYL AMINES: A classical channel BO with 1:7 RR• AlKYL AMINES was moving in a downward parallel channel from Q4-2022.
• A perfect channel could be fitted on the downtrend
• Last 3 weeks there is a significant volumn spike in the stock.
• Last week closing was above the downward channel
• If this week closing is above previous week closing then bullish move confirmed
• Swing stop loss is 2160
• Positional sl is 2031
• Target are mentioned in the chart.
• An opportunity of 1: 5 RR in swing trending.
• Positional trader may hold this trade till ATH @4725 with a 1: 7 RR.
• Idea is for educational purpose and explore the price action learning with trading psychology.
• Have fun traders!!! 😊
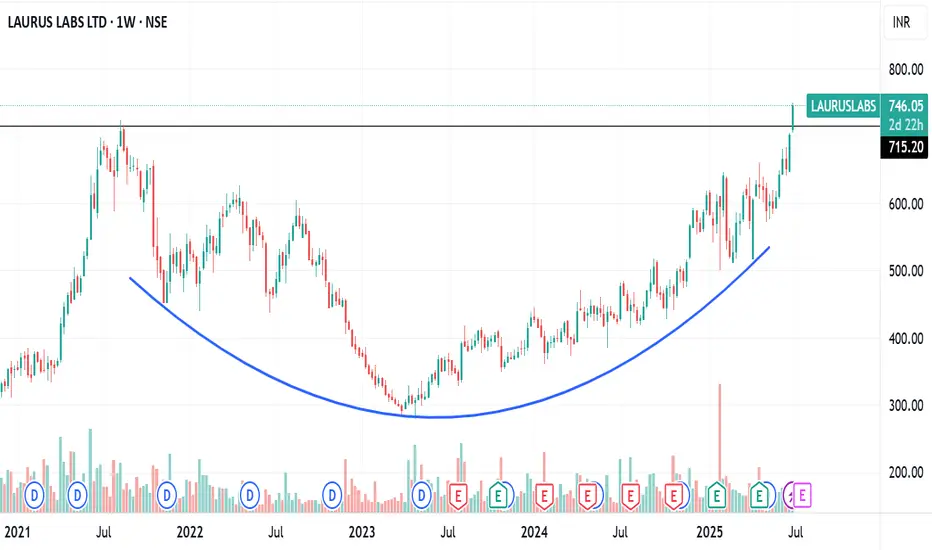
LAURUSLAB ROUNDING BOTTOM BREAKOUTLauruslab breaking rounding bottom pattern
weekly basis with good volume
trading at ATH,multiyear breakout
may retest then start moving upside
NO BUY/SELL RECOMENDATION
Japan has rice shortageGreat setup
Low supply
High demand
Chart has good shape
Higher highs intact
Market looking +ve
Rice stocks in tend
Global tailwinds

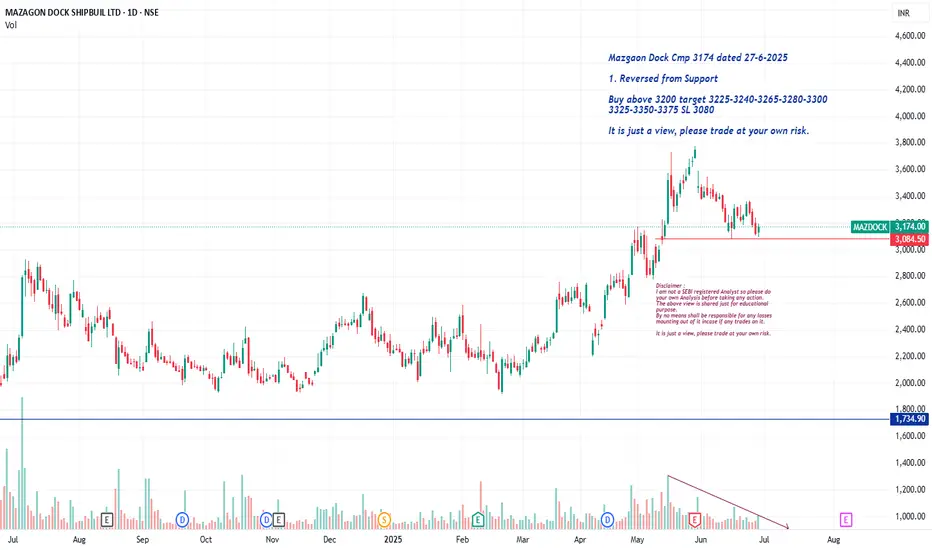
Mazgaon Dock Cmp 3174 Reversed from Support Mazgaon Dock Cmp 3174 dated 27-6-2025
1. Reversed from Support
Buy above 3200 target 3225-3240-3265-3280-3300
3325-3350-3375 SL 3080
It is just a view, please trade at your own risk.
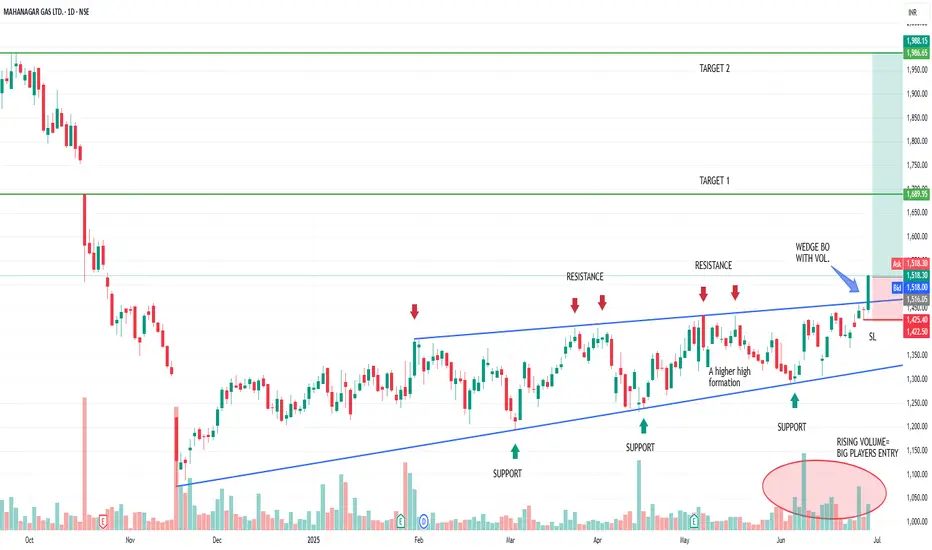
MGL: A study on wedge BO with 1:5 RR• MGL was consolidating in a tight range for the last 7 months.
• It has formed a rising wedge.
• Last 1 months showing significant volume buildup confirming big boys already entered in the trade.
• Today it broke out the wedge with significant volume and strong hourly closing.
• A massive 480 points move is possible in positional bases.
• All the T1 (gap border 1689) and T2 (1986) mentioned in the chart.
• SL for position should be 1425.
• Currently a RR opportunity of 1:5.
• Please note the daily candle yet not closed. Wait for a daily candle closure and make a decision.
• Idea is for educational purpose and explore the price action learning with trading psychology.
• Have fun traders!!! 😊
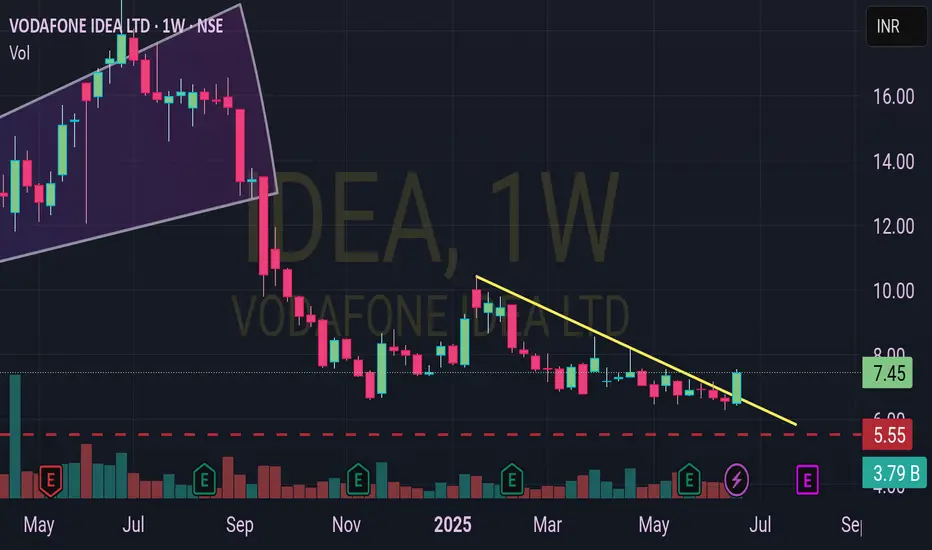
IDEA can be the best idea
🌟 Vodafone Idea Ltd (IDEA) could be a golden opportunity for traders! 📈
🔍 The weekly chart reveals a stock at a discounted rate, fueled by India's market growth.
💡 Even if business struggles, industry giants may step in to lift it—strong long-term potential!
📊 A descending trendline and recent uptick at ₹7.50 (+3.59%) hint at a possible reversal.
🚀 Strong conviction for a bullish future, though risks remain—conviction can falter!
🧠 Validate your belief, analyze fundamentals, and enter with confidence.
🎯 Current price at ₹7.50 vs. resistance near ₹16.00 suggests room to grow!
💪 Big players and market trends could drive this turnaround—don’t miss out!
🍀 Good luck, traders—make your move wisely!
#StockMarket #Trading #IDEA #VodafoneIdea #Investing #IndiaStocks #TechnicalAnalysis #MarketTrends #StockTrading #LongTermInvestment
Disclaimer: Grok is not a financial adviser; please consult one. Don't share information that can identify you.
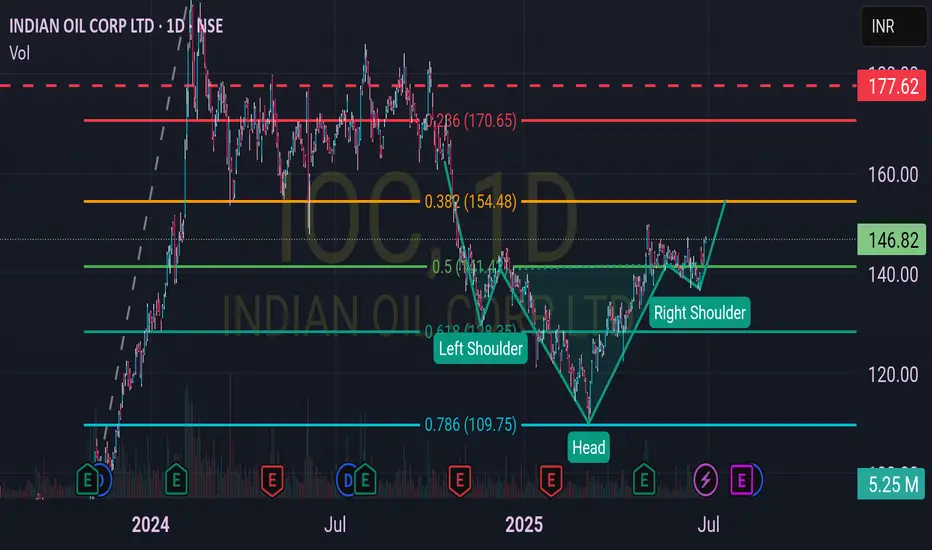
IOC - Fascinated by the Fibonacci!
Unveil the mesmerizing journey of Indian Oil Corp Ltd (IOC) on this captivating chart!
Behold the Fibonacci levels, meticulously drawn two months ago, revealing a fascinating truth.
Witness the price action align flawlessly with these golden ratios, a trader's dream come true.
Marvel at the emerging head and shoulder pattern, hinting at a potential trend reversal.
Anticipate an exhilarating uptrend as the pattern nears completion, sparking excitement.
Strategize with a trailing stop from entry, safeguarding your gains with precision.
Embrace proper risk management to navigate this thrilling market adventure.
The 0.618 level at ₹154.48 and 0.786 at ₹109.75 have held strong, guiding the price.
The current price of ₹146.73 teases a breakout, aligning with the right shoulder.
Prepare for an upward surge, blending Fibonacci magic with pattern perfection!
Analyzing Gold Price Action Based on the Trendline
Introduction
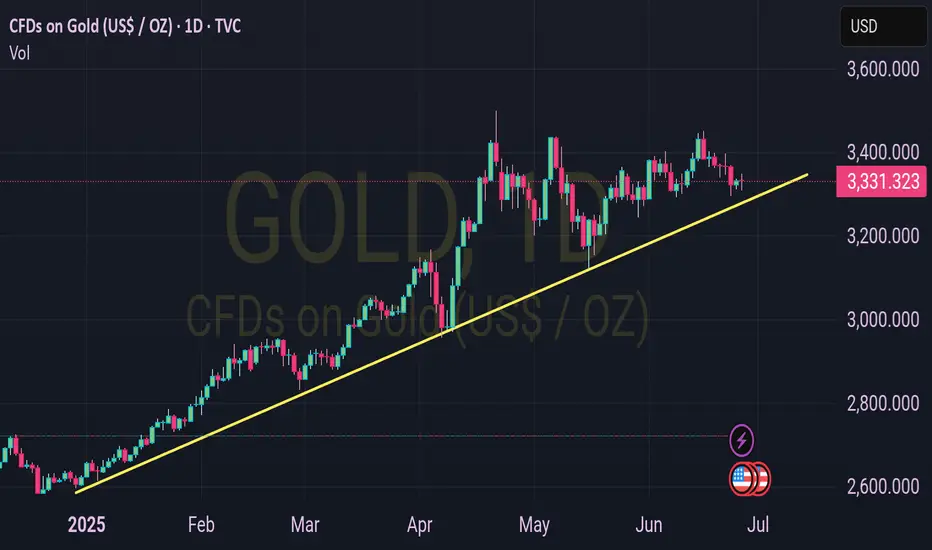
Gold has been a focal point for investors in 2025, with its price movements closely watched for signs of stability or breakout. The chart provided, sourced from TradingView and published on June 26, 2025, offers a weekly view of CFDs on Gold (USD/oz), currently priced at $3,332.30 with a slight decline of -0.973 (-0.03%). Let’s dive into the price action and trendline depicted in the chart to understand the potential direction of gold prices.
Chart Analysis: Price Action and Trendline
The chart showcases a clear upward trendline that has guided gold prices since early 2025. Starting around $2,400/oz in February, the price has steadily climbed to its current level of $3,332.30 by late June. The trendline, marked by a yellow line, acts as a support level, with the price consistently bouncing off it over the past months. This suggests strong bullish sentiment, as buyers have stepped in to defend this ascending support.
Recent price action shows some consolidation, with green and red candlesticks indicating short-term fluctuations. However, the overall trajectory remains upward, with the trendline sloping gently towards $3,600/oz as we approach July. The volume (Vol) indicator, though not detailed in the chart, hints at sustained interest, supporting the possibility of continued upward momentum if the trendline holds.
Insights from the Trendline
The trendline’s role as a dynamic support level is critical. A break below this line could signal a reversal or correction, potentially testing levels around $3,200/oz or lower. Conversely, a sustained hold above the trendline, accompanied by increased volume, could push gold towards the $3,600/oz mark, aligning with the upper range of the chart. Traders should watch for key levels where the price interacts with this trendline, as it may offer opportunities for entry or exit.
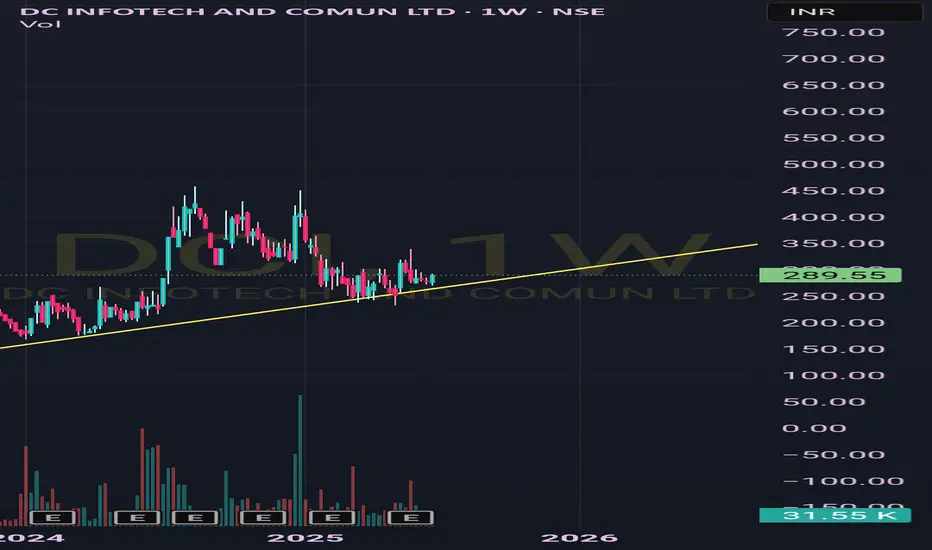
DC Infotech and Communication Ltd: A Rising Star in Tech
DC Infotech and Communication Ltd (NSE: DCLI) is making waves in the tech and telecom sector, as reflected in its recent earnings and market performance. The company reported a notable 6.65% increase in stock price to INR 284.00 as of June 26, 2025, with a weekly gain of 2.40%. The weekly chart reveals a steady upward trend line since 2023, indicating robust long-term growth potential and investor confidence.
The company’s client-focused approach, catering to diverse industries, has bolstered its revenue streams. Recent earnings suggest strong financial health, driven by strategic expansion and operational efficiency. Looking ahead, DC Infotech is well-positioned to capitalize on industry trends, particularly the surge in AI and blockchain technologies. As businesses increasingly adopt these innovations, the company’s expertise in IT solutions and communication services positions it for significant growth.
The price action, supported by a consistent trend line, signals a bullish outlook, with potential to reach INR 400-500 if momentum continues. With a trading volume of 20.41K, market interest remains high. Investors eyeing tech stocks with exposure to trending tech should consider DC Infotech a promising contender in this evolving landscape.
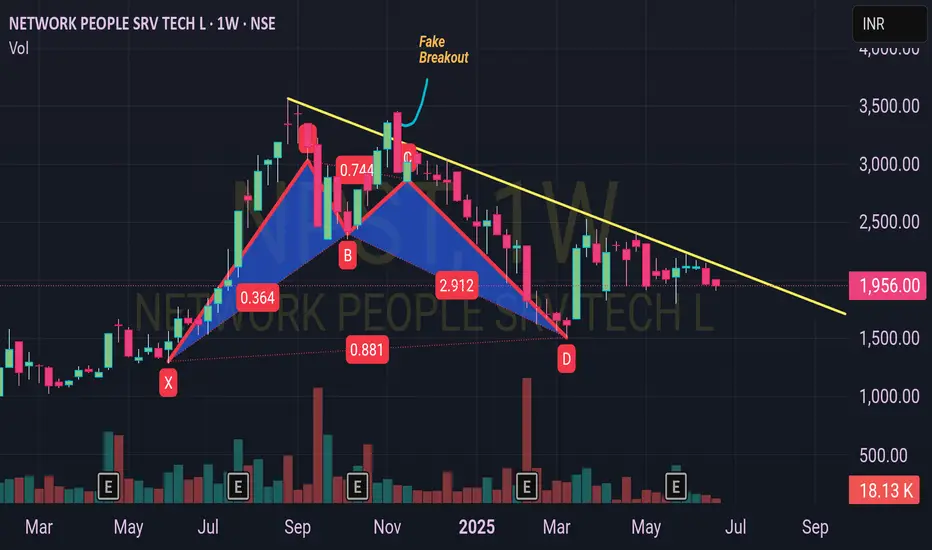
Analyzing the Weekly Chart of NPST on NSE: A Rebound!
The weekly price chart of Network People Services Technologies Limited (NPST) listed on the National Stock Exchange (NSE) offers an intriguing look at its recent market performance. As of June 25, 2025, the stock has shown a notable rebound, currently trading at INR 1,958.00 with a modest gain of +29.70 (+1.54%) and a trading volume of 18.05K. This resurgence comes after the formation of an "M" pattern, a classic technical analysis formation often associated with a potential reversal following a period of consolidation or decline. The chart, published by stocktechbot on TradingView, highlights this pattern, suggesting that investors may be witnessing a shift in momentum.
A closer examination of the chart reveals the "M" pattern's key points, marked as A, B, C, and D. The pattern began with a peak at A (0.741), followed by a dip to B (0.364), a rise to C (2.912), and a subsequent decline to D (0.881). This double-top formation, characteristic of the "M" or double top pattern, typically signals a bearish reversal. However, the recent price action shows the stock breaking above the neckline, labeled as a "Fake Breakout" on the chart, indicating that the anticipated downward move may have been invalidated. This breakout suggests a potential shift to bullish sentiment, supported by the stock's current position above the trend line drawn on the weekly timeframe.
The trend line, a critical tool in technical analysis, has served as a dynamic support level for NPST over the observed period. After hovering near this line, the stock appears to be rebounding, which could indicate the start of an upward trend. The chart’s annotations, including the yellow trend line sloping downward from the peak, align with the price action as it tests and holds above this level. This rebound is a promising sign for traders, as it suggests that buying interest may be increasing, potentially driving the price toward higher resistance levels in the future.
Volume analysis further supports this potential bullish scenario. The chart shows a noticeable increase in volume during the breakout phase, with spikes corresponding to the price movements around points A, B, and C. This heightened activity often accompanies significant price changes and can be interpreted as confirmation of the breakout’s validity. As of the latest data, the trading volume of 18.05K aligns with the stock’s upward movement, reinforcing the possibility that NPST is gaining traction among investors.
In conclusion, the weekly chart of NPST presents a compelling case for a rebound following the "M" pattern, with the stock currently stabilizing above the trend line. While past performance is not a guaranteed predictor of future results, the combination of the breakout, increased volume, and price action suggests a potential shift in market sentiment. Investors and traders should continue to monitor key support and resistance levels, such as the trend line at INR 1,958.00 and the previous high near INR 2,912.00, to gauge the stock’s next move in this evolving technical landscape.
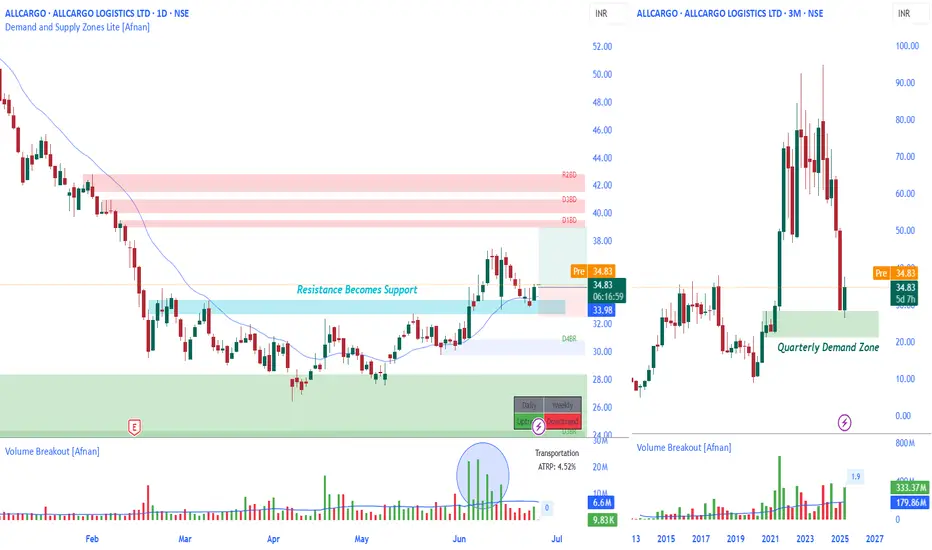
Quarterly Demand Zone + Daily Breakout = Strong ConfluenceLet’s talk about a setup that checks almost every box for a technically sound trade— NSE:ALLCARGO .
This isn’t just any breakout. It’s one of those rare moments when multiple timeframes are pointing in the same direction... and when that happens, smart traders pay attention.
🧱 Quarterly Demand Zone – The Foundation of the Setup
This isn’t just a technical level—it’s a potential stronghold for smart money activity. Price has just entered and reacted from a well-defined Quarterly Demand Zone, which historically tends to be the playground of institutions, not retail noise.
What I find especially compelling is how the reaction from this Quarterly Demand Zone isn't just visible—it’s meaningful. The current quarterly candle is green, forming on increasing volume, and there are only 3 days left until it closes. That’s not random—it’s calculated accumulation.
🧱 Daily Price Action Breakdown
On the Daily timeframe, the stock had been in a tight sideways range for a while. That consolidation wasn’t random—it was accumulation. We saw repeated tests of a clear resistance zone, gradually weakening that level... and then?
Boom. Breakout.
And not a weak or fake-out move either. This one came with conviction and volume. Now the price is pulling back slightly, retesting the breakout zone—which, by the way, is now acting as support thanks to the Polarity Principle . The most recent daily candle? Showing signs of price respecting this level.
💡 When price responds to a higher timeframe demand zone and then breaks out on the lower timeframe with strength, that’s a serious signal of institutional activity and trend continuation. you’re not just chasing momentum—you’re trading with alignment .
📊 Technical Highlights
Quarterly Demand Zone Reacted : Price reversed from a higher timeframe zone—classic smart money footprint.
Quarterly Candle Turned Bullish : Green candle forming with rising volume, hinting at a potential long-term reversal.
Daily Breakout From Consolidation : Resistance was tested multiple times, finally gave way.
Volume Confirmation : Breakout candle printed on above-average volume—always a good sign.
Polarity Flip : Resistance has turned into support, and price seems to be holding it for now.
📍 My Take on This Trade
For a swing trader who values structure and confirmation, this setup is about as clean as it gets. The Quarterly Demand Zone is doing the heavy lifting here , giving you that deep, institutional-level context. And the daily breakout? The story is unfolding right in front of us.
I’m bullish on this setup. Entry at CMP 34.83, Place stop-loss just below yesterday's ’s candle low (with a bit of a buffer). First target? The daily supply zone—which could offer a solid 1:2 risk-to-reward. If the rally continues, consider trailing your stop loss to lock in gains. But let’s be real: any setup can fail. Price could easily dip back into the range or break lower. That’s why risk management isn’t optional—it’s essential. This isn’t financial advice—just an analytical perspective for educational purposes.
🧠 Final Thoughts
If the Quarterly chart is your tide, the Daily is just the wave. And right now, both are flowing in the same direction. That’s not the time to hesitate—that’s the time to execute (with proper risk, of course).
✨ “Price reacts where smart money acts. Your job is to listen, not predict.” 🔍
🎯 Remember, it’s not about predicting—it’s about aligning your trades with high-probability setups.
📈 Stay sharp, trade clean, and respect the zones.
Thanks for the read. Got thoughts or questions? Drop them below—I’m always happy to chat charts.
Thanks for the support—keep studying the charts, and keep sharpening your edge. 📈💬
This analysis is for educational purposes only. I’m not a SEBI-registered advisor and this is not a trading or investment recommendation.
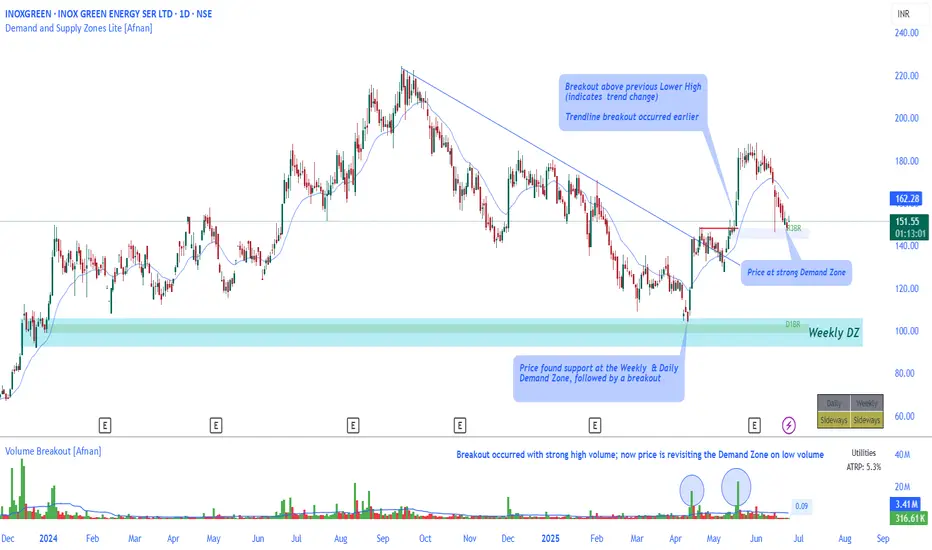
Demand Zone Retest After Breakout – Healthy Pullback NSE:INOXGREEN has been quietly setting up an interesting structure on the daily chart — one that could catch the attention of traders who follow clean trend reversals and demand zone dynamics.
The recent action is about patience and structure — the kind of move that often builds the foundation for the next big move.
📊 What’s Happening on the Chart?
Trendline Breakout: After months of trending lower, price finally broke above its falling trendline — a signal that sellers were starting to lose control.
Structure Shift: Not long after the trendline breakout, price took out a key lower high. That’s your textbook sign of a potential trend change from bearish to bullish.
Support Found at Demand: Before all this, the stock found solid footing at a strong Weekly + Daily Demand Zone — a level where buyers stepped in with confidence.
Now Back to Demand (But Quietly): After the breakout, price is now calmly pulling back into a nearby demand zone — and it’s doing so on low volume. That’s typically a good thing; it shows there’s no panic selling, just a quiet retracement.
🧠 Why This Matters
This kind of setup often catches traders off guard. The breakout already happened, the volume confirmed it — but now the market is “retesting” the move, checking if the breakout is for real.
Here’s why this zone is worth watching:
Pullbacks on low volume into demand are often healthy — it means sellers aren't in control.
If buyers show up again, especially with a bounce or bullish candle, it could confirm the next move higher.
As long as this demand zone holds, the larger structure stays positive.
🔍 My Closing Take
It’s easy to get caught up in the breakout hype, but sometimes the real opportunity is in the retest — when most people stop watching. If this zone holds and price starts moving with momentum again, it could be a sign of strength returning.
🔥 "Patience and preparation turn market uncertainty into opportunity." 🔥
This analysis is shared for educational purposes only and is not a trading or investment recommendation , as I am not a SEBI registered Analyst.