Senores Pharma: Cup & Handle - Ready for Some Action?NSE:SENORES
Senores Pharma is forming a potential cup and handle on the daily timeframe. A breakout attempt on Feb 6, 2025, failed to sustain above ₹607.35 as selling pressure came in second half.
Now, the cup and handle pattern is progressing, making next week crucial. A close above ₹607.35 is the key level to watch for confirmation.
Volumes are rising, with today's volume (Feb 21, 2025) nearly 5x yesterday's. The stock's resilience despite market pressure indicates strength.
Cup and Handle pattern usually don't disappoint so would be interesting to watch.
Senores Pharmaceuticals is a research-driven company focused on developing specialty pharmaceutical products for regulated markets. The company has shown impressive financial performance:
Recent Financials (Q3 FY25):
Net Sales: ₹106.4 crore (up 35% YoY from ₹78.7 crore in Q3 FY24)
QoQ Performance: Increased from ₹104.4 crore in Q2 FY25 (up 1.92%)
EBITDA: ₹29.1 crore (up 92% YoY)
PAT: ₹17.2 crore (up 142% YoY from ₹7.1 crore in Q3 FY24)
9MFY25 Performance:
Total Revenue: ₹288.1 crore (up 157% YoY from ₹112.1 crore in 9MFY24)
PAT: ₹40.7 crore (up 162% YoY)
Market Position : The stock has outperformed its sector and the broader Sensex, achieving consecutive gains over the past month and trading above multiple moving averages.
Future Projections : Management anticipates a top-line growth of 50%-60% for FY26, with plans to launch five new products in the current quarter.
Strategic Focus : Continued investment in R&D and infrastructure development is expected to enhance manufacturing capabilities and expand product offerings.
Volume

CreditAcess Grameen Standing near a crucial trendline support!Chart of Creditaccess is quite interesting.
Stock has a trendline support from which it has bounced multiple times in past.
Recently, stock has tried to bounce with very very very heavy volumes indicating big money getting exchange.
Given the history of the stock, we should at least expect 100% upside from this level. But it ccan also be a trap and stock can breakdown from here.
A safer level to watch is would be a weekly closing above 1110.
Support is 800 WCB for stock.
On upside, stock can go to 1480, 1710, 2000++
Very very risky. It can be a bottom fishing or a trap.
Idea shared for educational purposes only. We all should just watch what will happen from here and learn from it.

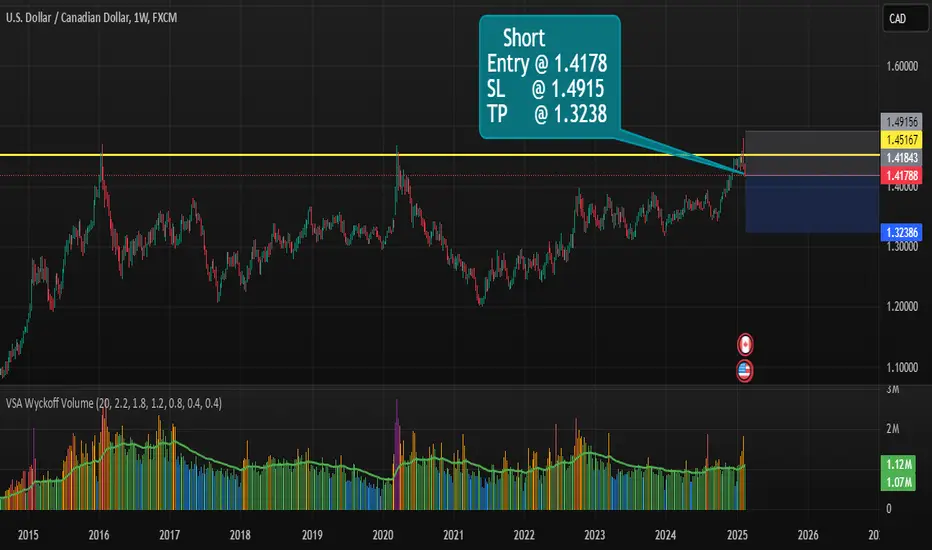
USDCAD Short Set up....📉 USDCAD Short Trade Setup
🔹 Entry: 1.4178
🔹 Stop-Loss (SL): 1.4915
🔹 Take-Profit (TP): 1.3238
USDCAD has reached a strong resistance zone, previously tested in 2016 and 2020. Price is showing signs of rejection, making this a potential short opportunity.
🎯 Trade Plan:
- Short from 1.4178
- Stop above recent highs at 1.4915
- Targeting a move towards 1.3238
📊 Volume Analysis:
Wyckoff volume suggests potential weakness at resistance, supporting the short bias.
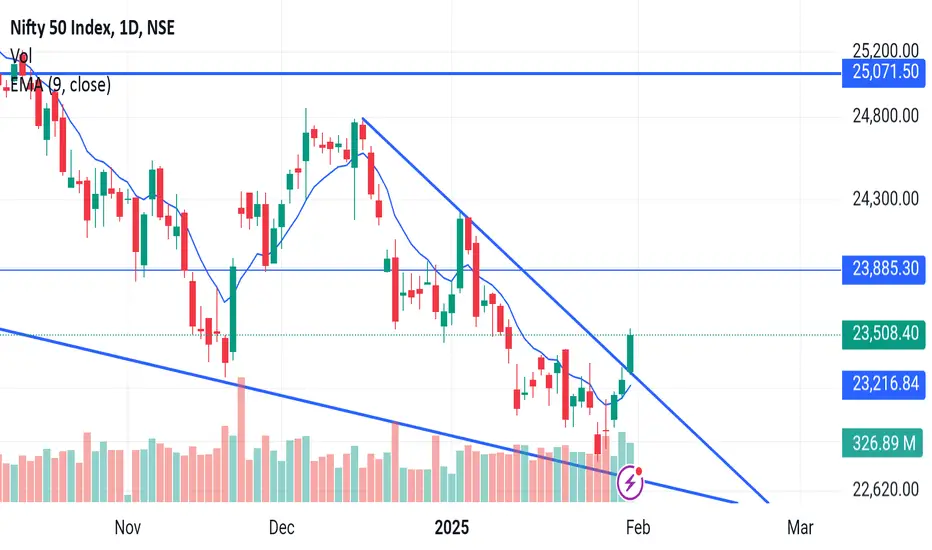
NIfty 23200 important Support swing tradeHello,
Nifty Retrace more than 50% of previous swing high and now at trendline support RSI oversold with slow selling volume is not active on sellers side also hidden divergence and oscilators are bullish bullish reversal possibilities with stop loss of 23180

Bajaj Healthcare - Occasional buying volumes looking good!Bajaj Healthcare - Good daily volumes occasionally!
Still in uptrend after breakout and retest, good places to buy marked in the chart!
0.618 and FVG forced closely, between 560 range looking good!
After testing certain range might swing may continue until 780 in short to medium term!
#Budget 2025
#Watch out for upcoming news
#Watch out for upcoming earnings before entering

Analyzing Silver's Price Action: Educational Trade IdeaShort Bias Setup:
Entry: Wait for the price to retest the descending trendline (~$31.50) and fail to break above it.
Target: $30.00 (initial), followed by $28.50 if momentum persists.
Stop Loss: Above $32.00 to protect against a trendline breakout.
Alternative Long Opportunity:
Entry: A confirmed breakout above the trendline with high volume (~$32.20).
Target: $33.50 (resistance level) and beyond if the trend reverses.
Stop Loss: Below $31.00 to minimize risk.

Nifty gets clear breakout in descending triangle patternNifty go long position with clear stop loss. Nifty cleard breakout descending triangle with huge volumes
MSFT Support on Weekly MA20, $515 Price TargetMSFT hasn't missed an earnings since before 2024.
Weekly chart looks strong. On the 1 hour you can see they went low for a last liquidity grab.
ER tonight if positive reaction can make the stock go to 480-500
This feels all around bullish to me and they are also to announce partnership progress in AI projects.
NFA - I went with August contracts.
Good luck

KAYA LTD - Symmetrical Triangle - MonthlyKAYA LTD formed Symmetrical Triangle pattern on Monthly chart.
Formed symmetrical triangle and given breakout with very huge volume and retest done .
RSI is looking good and taking support
ROCE going minus every year since last 5-7 years :(
poor sales growth since last 5 years :(
FII's and DII's has increased their holding little bit since last 2 quarter.
What will happen next quarter ? will it go sideways or downtrend will start ?
Resistance1 : 505-511
Resistance 2 : 590-600
No Entry, No Targets until positive results or news coming :)

Equinox India - Cup & Handle and Downward channel BOEquinox India has given a BO from downward channel and is also making an Cup & Handle pattern on weekly time frame. This looks quite positive and post breakout of Cup & Handle pattern it is heading for 3X returns. Other factors:
1. Recent accord of merger with Embassy group after 5 years makes Equinox is leading listed real estate company with one of the largest land bank.
2. After 2008, it has given breakout out of downward channel.
3. Cup & Handle is in making on a higher time frame so on breakout it can move 3X.
4. Volumes are also building
5. Price-Book ratio (1.7x) is lowest among other real estate players
Do keep this stock in your radar!!
Keep following @Cleaneasycharts as we provide Right Stock at Right Time at Right Price.
Cheers!!!

SWING (OBSERVATION) - CREDITACCESS GRAMINScript showing good intraday momentum supported with huge volumes bounced from support trendline and given breakout of major Trendline in hourly frame - now at activity area -if sustained high of 1020 can give further upward

Good time to buy.Same sector good results posted. Also good fundamentally buy trigger this stock may be good returns in future a days..

IDBIBANK PARELLEL CHANNEL BREAKOUTIdbibank breaking parellel channel weekly basis
breaking 20ema taking #support at 200ema
with huge volume,strong rsi
#target 107 sl 65
#q3result on 20 january
NO BUY/SELL RECOMENDATION

Kaveri Seeds, Strong CloseKaveri Seeds gave Strong weekly Close. I'm aiming for 50% from here.
🚨 DYOR
🚨 SL must it depends on ur risk appetite

ONGC RESISTANCE BREAKOUT WEEKLYONGC breaking long time resitance weekly basis
with strong volume building last 2 week
breaking 20 wma,rsi in bullish zone
macd crossover about to happen
#target1 300,breaking 300 #target2 344
NO BUY/SELL RECOMENDATION

SWING (BEARISH OBSERVATION) - DIXON TECH SHORT - Script broke major bullish support trendline in high Intraday momentum supported with volumes, the above rejection area can act as SL -17500 while 15900 (major swing high ) can be potential TRGT

GODREJCP : Morning Star Pattern at SupportGodrej Consumer Products has given breakout near 1100 and now it is retesting its level and making a Morning Star Candlestick Pattern on Support this is a good sign for a stock.
There is a Saying in stock market "Retest Stocks are the best Stock" ... if it will follow this proverb we can get a good profit with Trailing Stop-loss..
All data is available in public domain..
CMP : 1140
TG : near ATH
SL : Doji's low
Stock's selection based on 5 Point Analysis:
1: Idea : Breakout Retest.
2: Support : Volume, Delivery .
3: Technical : Morning Star Candlestick Patter at support.
4: Fundamental : PE, PAT, Industry & peer PE and sector performance.
5: Timing : Entry Timing on Daily chart.
Disclaimer : It is my personal view as a trader and for educational purpose only. Equity market involves risk .
Please consult your financial adviser before taking any decision.

Bharti Airtel Cmp 1682 Triangle BO with VolumesBharti Airtel Cmp 1682 dated 13-12-2024
1. Ascending Triangle BO @ 1685
2. Price rise with Volumes
3. RSI BO
Buy above 1685 SL 1630 target 1700-1715-1730-1745-1750-1760-1770-1780
Pattern target 1860 SL 1585
It is just a view, please trade at your own risk.

Greaves Cotton Cmp 252 Rectangle BOGreaves Cotton Cmp 252 dated 10-12-2024
Weekly Chart (Positional)
1. Rectangle Bo @ 250 (done)
2. Price Rise with Volumes
3. RSI BO
Buy above 255 SL 200 target 260-280-300-325-350-375-400
It is just a view, please trade at your own risk.

EICHERMOTORS RECTANGLE BREAKOUT Eichermotors breaking a rectangle box on
weekly basis with volume spike
macd crossover this week,bullish rsi
#target 6000 after breaking 5450
#positionaltrading
NO BUY/SELL RECOMENDATION

UNITEDSPIRIT WEEKLY BREAKOUTUnitedspirit breaking rounding bottom
on weekly basis withhuge volume building up
macd crossover done,strong rsi
trading at ATH
#target 1860
EDUCATIONAL IDEA

Policybazar-A rounding bottom pattern of ATH breakoutPolicybazar has formed a beautiful rounding bottom pattern and is now looking strong for a strong bullish trend.
Stock belongs to new age startup category and investing has more risk associated compared to bluechip stocks.
ATH breakouts are usually explosive and can be considered for quick swing trade as well.A similar pattern was observed in Zomato and stock has given good returns since then.
Idea is just my personal opinion and not a recommendation.

DEVYANI INTERNATIONAL DESCENDING TRIANGLE BREAKOUTDevyani international descending triangle brakout
with volume spike,rsi bullish
breaking 200 ema
above 183 #target 222
sl 167
no buy/sell recomendation
