Bharat Forge (D): Strongly Bullish, Multi-Resistance BreakoutThis is a high-conviction breakout event. The stock has decisively broken out of a 17-month corrective pattern, shattering two major resistance levels simultaneously. This move is supported by a powerful confluence of bullish indicators across all timeframes and is underpinned by strong fundamental results.
📈 1. The Long-Term Context
- The Correction: After hitting its All-Time High (ATH) in June 2024 , the stock entered a 10-month corrective downtrend.
- The Reversal: This trend reversed in April 2025 , and the stock began a new recovery.
- The Consolidation: This recovery was capped by two distinct resistance levels, forcing the stock into a consolidation phase where, volume was drying up (a sign of accumulation).
🚀 2. The Decisive Breakout (Today's Action)
Today, the stock broke this stalemate with explosive force:
- The Surge: A powerful +5.55% rally on high-conviction volume of 4.81 Million shares.
- The Dual Breakout: This move shattered both key resistance levels at once:
1. The long-term angular resistance (from the June 2024 ATH).
2. The short-term horizontal resistance (from June 2025, at the ₹1,362 level).
- The Catalyst: This technical breakout is supported by strong Q2 earnings, which act as a fundamental driver, giving the move a higher probability of success.
📊 3. Confluence of Bullish Indicators
This breakout is not isolated. It is confirmed by a rare "trifecta" of bullish signals on Daily, Weekly, and Monthly timeframes:
- RSI: The Relative Strength Index is rising on all three timeframes .
- EMAs: The short-term Exponential Moving Averages are in a "PCO" (Price Crossover) state on all three timeframes .
- SMAs: A recent SMA Golden Cross (50-day crossing 200-day) is active, confirming the new long-term uptrend.
🎯 4. Future Scenarios & Key Levels to Watch
This breakout provides a very clear road map based on identified levels:
🐂 The Bullish Case (Momentum Continues)
- Trigger: If the current momentum is sustained, the stock is in a new uptrend.
- Target 1 (Short-Term): ₹1,525
- Target 2 (Medium-Term): ₹1,625
🐻 The Pullback Scenarios
- Scenario A (Healthy Re-test): The momentum pauses, and the stock pulls back to test the "resistance-turned-support" level at ₹1,362 . A bounce from here would be a textbook confirmation and a secondary buying opportunity.
- Scenario B (Breakout Failure): If the breakout is a "fakeout," the stock will fail to hold ₹1,362 and will likely fall to the next major support level at ₹1,305 .
Volume

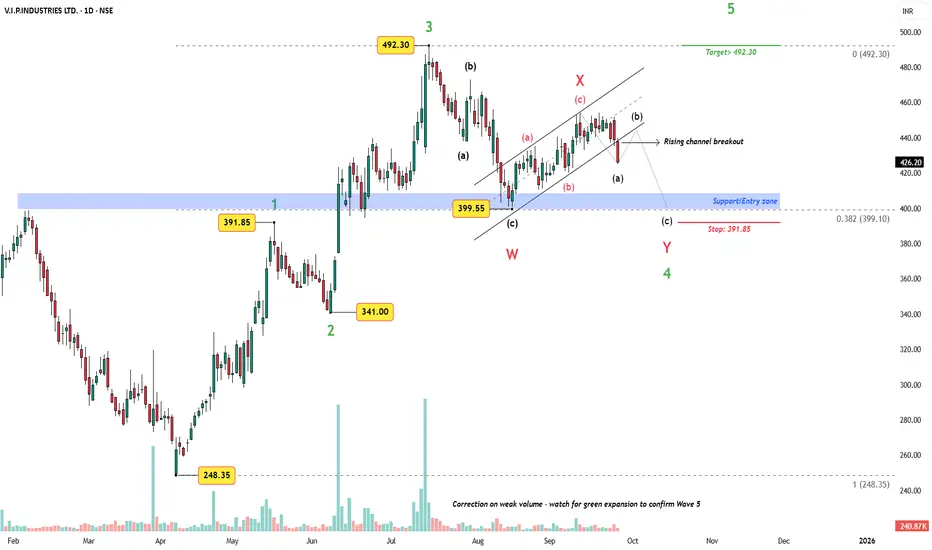
VIP Industries – Rising Channel Breakdown, Support Zone in FocusChart Structure
The stock completed a wave 3 advance up to 492.30. What followed is a corrective W–X–Y structure, which probably might test the previous breakout zone around 408–400. This aligns with the 0.382 Fibonacci retracement and previous Wave 1 high, providing strong support.
Key Observations
The corrective leg has unfolded on weak volume, typical of a Wave 4 structure.
Recent breakdown from the rising channel suggests a final (c) leg of Wave Y into the blue support zone.
A possible wave (b) retest of the broken channel cannot be ruled out before the final dip.
As per Elliott Wave rules, Wave 4 must not overlap Wave 2 (391.85) – keeping structural integrity intact.
Trade Plan
Entry Zone: Strictly in the 408–400 support band.
Stop-Loss: 391.85 (under prior Wave 1 high, violation would invalidate the count).
Target: A new high above Wave 3, i.e., ≥492.30, as Wave 5 should extend beyond Wave 3.
Volume Insight
Correction is unfolding on weak volume – confirmation of Wave 5 will require a green volume expansion from the support zone.
Conclusion
As long as 391.85 holds, the Wave 4 correction is near its end. A rally into Wave 5 with targets above 492 remains the primary scenario. However, patience is key – entry only in the marked support band.
Disclaimer: This analysis is for educational purposes only and does not constitute investment advice. Please do your own research (DYOR) before making any trading decisions.
Torrent Pharma (D): Strongly Bullish, Blue-Sky BreakoutThis is a high-conviction breakout. The stock has broken out of a 4-month consolidation, setting a new all-time high on high volume. The move is strongly supported by all indicators and a powerful fundamental catalyst.
📈 1. The Dominant Pattern: ATH Breakout
- The Consolidation: After making its previous ATH in July 2025, the stock entered a 4-month sideways trend.
- The "Lid": A horizontal resistance line formed at this ATH (approx. ₹3,787 ) restricted all forward movement.
- Volume Contraction: Volume was "drying up" during this consolidation phase. This is a classic bullish sign of seller exhaustion and accumulation.
🚀 2. The Decisive Breakout (Today's Action)
- The Surge: Today, the stock shattered this resistance with a 6.63% surge , backed by a high-conviction volume of 1.65 Million shares.
- The New ATH: This move resulted in a new all-time high, pushing the stock into a "blue-sky" price discovery phase.
- The Catalyst: This technical move is not speculative. It is driven by strong Q2 2026 earnings (30% profit growth), confirming that institutions are buying on good news.
📊 3. Key Technical Indicators
Indicator analysis confirms the bullish momentum across all timeframes:
- RSI: The Relative Strength Index is rising on the Daily, Weekly, and Monthly charts .
- EMAs: The short-term Exponential Moving Averages are in a "PCO" (Price Crossover) state on all three timeframes.
🎯 4. Future Scenarios & Key Levels to Watch
⚠️ A Note of Caution (The "Fakeout" Risk)
The risk is a "bull trap" or "fakeout." The correct thing to watch for, is bearish divergence (i.e., if the stock makes another new high, but the RSI makes a lower high).
🐂 The Bullish Case (Confirmation)
- Confirmation: The ideal "textbook" move would be a re-test . We want to see the stock pull back to the ₹3,787 level and "bounce," confirming the old resistance has become new support.
- Target: If the bullish momentum continues, the next logical target is ₹4,100 .
🐻 The Bearish Case (Breakout Failure)
- Trigger: The breakout fails, and the stock loses momentum (a "bull trap").
- Confirmation: The price falls and closes back below the ₹3,787 support level, invalidating the breakout.

Sobha (W): Bullish, Breakout ConfirmationThe stock has decisively broken a 17-month angular downtrend line, signaling a major change in character. The underlying momentum on higher timeframes (Weekly & Monthly) is strong, suggesting this is the start of a new bullish leg.
📈 1. The Long-Term Context
- The 2024 Peak: After hitting its All-Time High (ATH) in June 2024 , the stock entered a prolonged 10-month correction.
- The 2025 Bottom: This downtrend found its bottom in April 2025 , and the stock has been in a reversal/recovery phase since.
- The Resistance: This recovery was consistently blocked by a strong, angular resistance trendline formed from the June 2024 ATH.
🚀 2. The Decisive Breakout (This Week's Action)
This week, the 17-month pattern was broken:
- The Move: The stock decisively broke out and closed above this long-term angular resistance trendline for the first time.
- The Surge: This breakout was confirmed with a +5.10% surge for the week, backed by 1.2 Million in total weekly volume.
- Volume Context: This breakout comes after a period of low, consolidating volume, which often precedes a significant move.
📊 3. Key Technical Indicators
The underlying momentum on higher timeframes strongly supports this breakout:
- EMAs: Short-term Exponential Moving Averages are in a "PCO" (Price Crossover) state on both the Monthly and Weekly charts, confirming a bullish trend.
- RSI: The Relative Strength Index is rising on both the Monthly and Weekly timeframes, showing that buying strength is building and sustaining.
🎯 4. Future Scenarios & Key Levels to Watch
This breakout provides a clear road map based on identified levels:
🐂 The Bullish Case (Momentum Continues)
- Trigger: If the current momentum is maintained, the breakout is confirmed.
- Target: The first major target is the ₹2,060 level, which represents the next significant resistance zone near the 2024 highs.
🐻 The Bearish Case (Re-test Scenario)
- Trigger: The initial momentum is lost, and the stock pulls back to verify the breakout.
- Confirmation: A "re-test" where the stock drops to touch the old resistance trendline, which should now act as new support.
- Support: This re-test level is at approximately ₹1,620 . A bounce from this level would be a secondary, high-conviction buy signal.

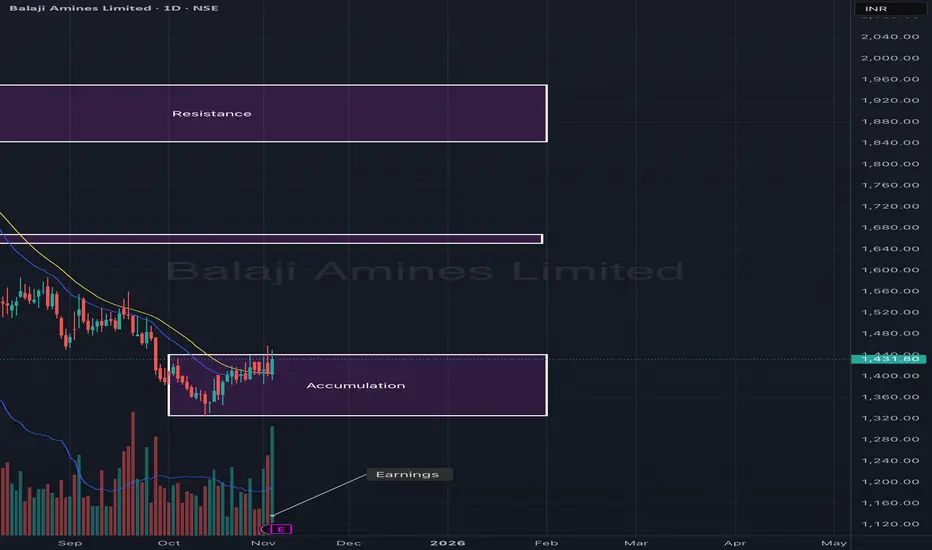
Balaji Amines Ltd – Accumulation Phase Before Potential UpsideBalaji Amines appears to be in a strong accumulation zone after an extended downtrend. The stock has been consolidating between ₹1,350–₹1,450, forming a solid base supported by stable volumes. A sustained move above this range could mark the beginning of a trend reversal and initiate a fresh leg toward the upper resistance levels.
The recent earnings announcement may act as a potential catalyst, as the stock shows early signs of momentum supported by short-term moving average crossovers.
🎯 Key Levels:
CMP: ₹1,431.80 (+1.93%)
Accumulation Zone: ₹1,350 – ₹1,450
Resistance 1: ₹1,650 – ₹1,700
Resistance 2: ₹1,900 – ₹1,950
Stop-Loss: ₹1,340 (on daily close basis)
📊 Technical View:
Price consolidating near the base zone post-correction, signaling accumulation.
Volume stability and EMA alignment suggest early buying interest.
A breakout above ₹1,450 could trigger a move toward ₹1,700.
Sustaining above ₹1,700 may open the next leg toward ₹1,950+.
🧠 View:
Balaji Amines is forming a base after prolonged correction. A close above ₹1,450 with volume confirmation can trigger momentum toward ₹1,700 in the short term, and ₹1,950 in the medium term.
Breakout Garuda breaking out from the line. After good results.
PROS:
Company has reduced debt.
Company is almost debt free.
Company is expected to give good quarter
Company has delivered good profit growth of 102% CAGR over last 5 years
Company has a good return on equity (ROE) track record: 3 Years ROE 32.7%

Suzlon Energy Ltd – EMA Crossover & Volume Confirmation (Daily CSuzlon Energy has shown a bullish EMA crossover on the daily chart, supported by a strong volume burst, signaling renewed buying interest after a corrective phase. The price has reclaimed the baseline resistance zone (₹59–₹61), and a sustained move above it could open the path toward the next major resistance near ₹68.
This setup suggests a potential trend reversal with strong momentum confirmation.
🎯 Key Levels:
CMP: ₹59.99 (+1.27%)
Baseline Resistance: ₹59 – ₹61
Target Zone: ₹67 – ₹69
Support Zone: ₹54 – ₹55
Stop-Loss: ₹53 (on daily close basis)
📊 Technical View:
20 EMA has crossed above 50 EMA, indicating a bullish trend shift.
Volume spike during the crossover adds strength to the move.
Price breakout from consolidation confirms accumulation.
Sustaining above the baseline could trigger a continuation rally toward ₹68+.
🧠 View:
Suzlon Energy is showing early signs of trend reversal after weeks of consolidation. A close above ₹61 with sustained volume can extend momentum toward ₹68, while ₹54 acts as key support.

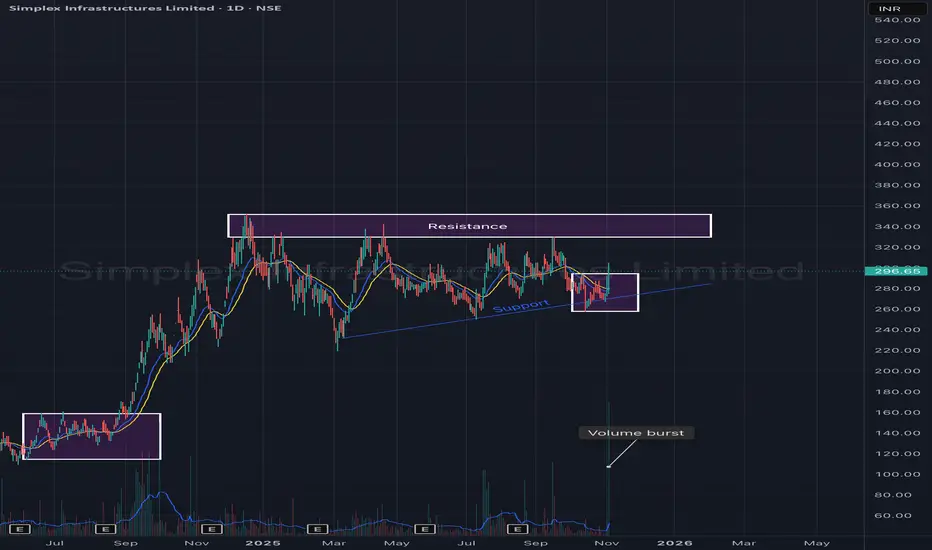
Simplex Infrastructures Ltd – Ascending Triangle Formation with Simplex Infrastructures is showing signs of accumulation and trend continuation within an ascending triangle pattern on the daily chart. The stock has been consistently forming higher lows while facing resistance around the ₹330–₹340 zone.
A recent volume burst near the support trendline indicates strong buying interest from lower levels — hinting at a potential breakout attempt in the coming sessions.
🎯 Key Levels:
CMP: ₹296.65 (+3.20%)
Support Trendline: ₹270 – ₹280
Resistance Zone: ₹330 – ₹340
Breakout Target: ₹370 – ₹390
Stop-Loss: ₹270 (on daily close basis)
📊 Technical View:
Formation of a higher-low structure within an ascending triangle.
Strong volume activity around support confirms accumulation.
Short-term EMAs are flattening, awaiting breakout confirmation.
A close above ₹340 with volume could trigger the next up leg toward ₹380+.
🧠 View:
Simplex Infra is building strength within a bullish ascending triangle pattern. A decisive move above ₹340 may confirm breakout momentum, supported by the recent volume surge, while the rising trendline continues to act as a strong base.
Ambuja Cements Ltd – Inverted Head & Shoulder Breakout in ProgreAmbuja Cements is displaying a classic Inverted Head & Shoulder pattern on the weekly timeframe, signaling a potential medium-term trend reversal. The neckline breakout zone around ₹560–₹580 is being tested again, and the price has shown a strong rebound from this area, confirming buyer strength.
The stock had earlier broken out of a falling wedge pattern, further strengthening the bullish bias. A sustained move above ₹580 with volume could confirm the breakout and pave the way for higher targets.
🎯 Key Levels:
CMP: ₹577.20 (+2.09%)
Pattern: Inverted Head & Shoulder + Falling Wedge
Neckline Zone: ₹560 – ₹580
Target-1: ₹630 – ₹640
Target-2: ₹690 – ₹710
Stop-Loss (Weekly Close): ₹540
📊 Technical View:
Price breaking out from a falling wedge after forming a reversal base.
EMA alignment turning positive – 20 EMA attempting to cross above 50 EMA.
Volume spikes seen near breakout areas indicate accumulation.
Sustaining above ₹580 may lead to a rally toward ₹640 and then ₹700+.
🧠 View:
Ambuja Cements shows early signs of a trend reversal backed by a strong chart structure. A weekly close above ₹580 would confirm the breakout, opening potential upside targets of ₹640 and ₹700 in the medium term.

Aarnav Fashion is a buy technical breakoutPrice volume suggests big buying in Aarnav with stock more than 10% up
Promotor increased stake in company.
Buy and hold for 30/40% more up move.

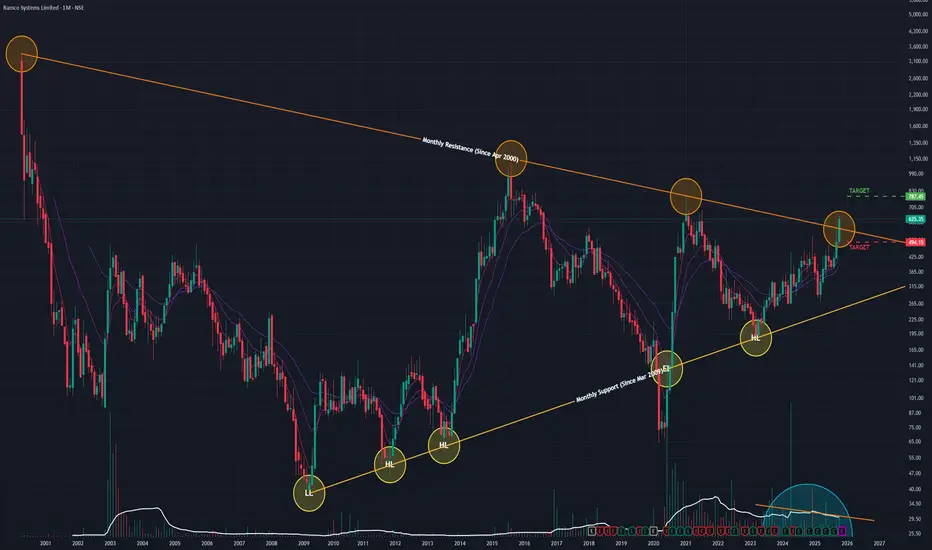
Ramco Systems (M): Extremely Bullish, Multi-Decade BreakoutThis stock is displaying one of the most powerful bullish technical signals possible: a decisive breakout from a 25-year angular resistance trendline . This is a major, long-term secular trend change.
📈 1. The Long-Term Context
- The 25-Year Pattern: Since its peak in April 2000, the stock has been held down by a massive, multi-decade angular resistance trendline.
- The Bottom & Reversal: The stock formed its ultimate bottom in March 2009. Since then, it has been in a slow, 16-year recovery, forming a pattern of Higher Lows against this unbreachable resistance.
- Volume Contraction: Volume was declining (or contracting) during the final phases of this consolidation. This is a classic sign of seller exhaustion right before a major breakout.
🚀 2. The Decisive Breakout
In October 2025, this 25-year pattern was shattered:
- The Surge: The stock surged +26.61% in a single month.
- High-Conviction Volume: This move was backed by a massive spike in volume ( 2.77 Million shares), confirming strong institutional interest and the validity of the breakout.
- The Close: Most importantly, the stock closed firmly above the 25-year trendline, signaling the "lid" has finally been broken.
📊 3. Key Technical Indicators
The underlying momentum supports this new long-term trend:
- RSI: The Relative Strength Index is rising, showing that strong buying momentum is accelerating.
- EMAs: The short-term Exponential Moving Averages are in a "PCO" (Price Crossover) state, confirming the new bullish trend is in effect across timeframes.
🎯 4. Future Scenarios & Key Levels to Watch
This breakout provides a very clear road map.
🐂 The Bullish Case (Confirmation)
- Confirmation: The "gold standard" for a breakout of this magnitude is a successful "re-test." We want to see the price pull back to the old trendline (now new support, around ₹560 ) and "bounce," confirming the breakout is genuine.
- Target: Once confirmed, the next logical technical price target is ₹787 .
🐻 The Bearish Case (Breakout Failure)
- Trigger: If the momentum is not sustained, and the breakout is a "fakeout" (a "bull trap").
- Confirmation: The stock fails to hold its gains and closes back below the broken trendline (around ₹560 support level) on high volume.
- Target: This failure would invalidate the immediate thesis and likely lead to a sharp sell-off.
Navin Flourine (M): Strongly Bullish, Multi-Year BreakoutThe stock has decisively broken out of a multi-year consolidation phase, backed by exceptional volume. This move signals the end of its sideways trend and the potential start of a new, major bull market.
📈 1. The Long-Term Context
- Primary Uptrend: The stock was in a powerful primary uptrend from July 2013 to May 2021.
- Multi-Year Consolidation: Since May 2021, the stock has been in a wide and long sideways consolidation phase.
- The "Lid": This entire consolidation was capped by a formidable horizontal resistance line formed in September 2022. This level rejected multiple breakout attempts over the last three years.
- Volume: Volume during this long consolidation was average, suggesting a balance between buyers and sellers as the stock built its base.
🚀 2. The Decisive Breakout (The October 2025 Event)
This month, the entire multi-year pattern changed:
- The Surge: The stock surged +23.06% in a powerful, decisive move.
- High-Conviction Volume: This breakout was accompanied by 6.9 Million in volume, confirming strong institutional interest and the validity of the move.
- The Close: Most importantly, the stock closed firmly above the multi-year horizontal resistance, signaling the "lid" has finally been broken.
📊 3. Key Technical Indicators
The underlying momentum strongly supports this bullish breakout:
- RSI: The Relative Strength Index (RSI) is rising, showing that buying strength is accelerating.
- EMAs: The short-term Exponential Moving Averages are in a "PCO" (Price Crossover) state, confirming the new bullish trend.
🎯 4. Future Scenarios & Key Levels to Watch
⚠️ A Note of Caution (The "Fakeout" Risk)
The primary risk after a powerful breakout is a "fakeout" (or "bull trap" ). This happens when the price breaks out, lures in buyers, but then fails to hold its gains and falls back below the broken resistance level.
🐂 The Bullish Case (Breakout Confirmation)
- Confirmation: The bullish momentum continues. The "old resistance" level (around ₹4,938 ) must now prove to be the "new support." A small pullback to retest this level, followed by a bounce, would be the strongest confirmation.
- Target: If the breakout is sustained, the next logical price target is ₹7,445 .
🐻 The Bearish Case (Breakout Failure)
- Trigger: The momentum fails, and the breakout is confirmed as a "fakeout."
- Confirmation: The stock falls and closes back below the critical resistance-turned-support line.
- Target: This failure would trap the new buyers and likely lead to a sharp sell-off, with the price falling back toward the lower end of its old trading range, starting with the ₹4,495 level.

PayTM (M): Strongly Bullish, Pending BreakoutThe stock has completed a major trend reversal from its 2024 all-time lows. It is now challenging a critical, multi-year resistance level. All technical indicators suggest that pressure is building for a significant bullish breakout.
📈 1. The Long-Term Context
- Major Reversal: After hitting its all-time low in May 2024, the stock has reversed its trend and has been in a sustained uptrend for over a year.
- Multi-Year Base: This entire move has built a massive base, leading to the current showdown at a key horizontal resistance line formed in January 2022 .
- Recent Consolidation: For the past three months, the stock has consolidated just below this major resistance. The volume has been "drying up" during this period, which is a classic bullish sign of seller exhaustion.
🚀 2. The Current Setup (The Decisive Move)
- Price Compression: The stock is currently coiling in a tight range, less than 5% below this critical multi-year resistance.
- Building Momentum: The surge in October ( +15.96% on 63.19M in volume ) showed a strong rejection of lower prices and a powerful move back up to test the "lid" of this pattern.
📊 3. Key Technical Indicators
The underlying momentum strongly supports a bullish resolution:
- RSI: The Relative Strength Index is in a clear rising state, showing that buying strength is building.
- EMAs: The short-term Exponential Moving Averages are in a "PCO" (Price Crossover) state, confirming the bullish momentum is intact across timeframes.
🎯 4. Future Scenarios & Key Levels to Watch
The setup provides two very clear scenarios. The immediate action is to watch for the breakout.
🐂 The Bullish Case (Breakout Confirmation)
- Trigger: A decisive, high-volume close above the horizontal resistance line (approx. ₹1,350 - ₹1,370 ).
- Confirmation: This would confirm the multi-year base is complete and the stock is entering a new, long-term bull market.
- Target: The next logical price target would be ₹1,725 .
🐻 The Bearish Case (Breakout Failure)
- Trigger: The stock fails to break the resistance and momentum is not sustained.
- Confirmation: A high-volume rejection from this level, followed by a break below the recent consolidation.
- Target: This failure would likely see the stock fall to retest its immediate support level at ₹1,090 .

HindPetro (M): Strongly Bullish, Breakout in ProgressThe stock has decisively broken out of a 10-month accumulation phase on high volume, signaling a potential new leg up. The bullish indicators are all aligned, and the focus now shifts to whether this breakout can be sustained.
📈 1. The Long-Term Context
- Consolidation Phase: The stock has been in a broad sideways trend since January 2024, building a large base.
- Key Resistance: A horizontal resistance line formed in September 2024 has acted as a "lid," rejecting all price advances for the past year.
- Drying Volume: volume has been "drying up" during this consolidation. This is a classic sign of seller exhaustion and accumulation by buyers.
🚀 2. The Decisive Breakout
- The Surge: In October, the stock finally broke this pattern with a decisive 7.35% surge.
- High-Conviction Volume: This move was backed by massive, high-conviction volume of 106.56 Million shares, confirming strong institutional interest and the validity of the breakout.
- The Close: Most importantly, the stock closed firmly above the horizontal resistance trendline , turning that old "lid" into a new potential "floor" (support).
📊 3. Key Technical Indicators
The underlying momentum supports this bullish move:
- EMAs: Short-term Exponential Moving Averages are in a "PCO" (Price Crossover) state, confirming strong, positive momentum.
- RSI: The Relative Strength Index (RSI) is rising, showing that buying strength is accelerating with the price.
🎯 4. Future Scenarios & Key Levels to Watch
⚠️ A Note of Caution
Instead of a "double-top," the key risk to watch for is a "fakeout" (or a "look above and fail"). Also watch for bearish divergence
🐂 The Bullish Case (Breakout Confirmation)
- Confirmation: The stock must now hold above the old resistance level (the breakout point). A successful retest of this level would be the strongest bullish confirmation.
- Target 1: ₹565
- Target 2: ₹700 (if upside momentum accelerates)
🐻 The Bearish Case (Breakout Failure)
- Trigger: If the current breakout is a "fakeout," the price will fail to hold and will drop back below the resistance line it just broke.
- Target: A failure here would likely see the stock fall to retest the immediate support level of ₹375.

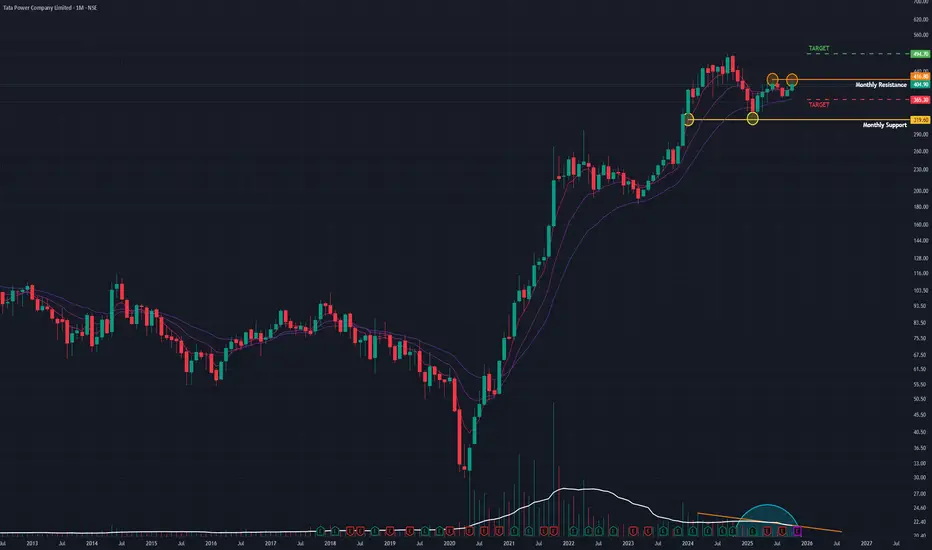
Tata Power (M): Coiling Spring Ready for an ATH Breakout?Tata Power is displaying a classic and very clean technical setup. After its parabolic run to an All-Time High (ATH) in September 2024 (around ₹490 ), the stock has entered a healthy, multi-month sideways consolidation. This is a bullish "coiling spring" or "accumulation" pattern.
📊 The Technicals
1. The Range (The "Box"):
The battle lines are clearly drawn.
- Resistance: A strong horizontal supply zone at the ATH, around ₹405 - ₹415 .
- Support: A firm demand zone and the bottom of the range at ₹365 .
2. Volume is Key:
The most bullish signal here is the volume contraction . Throughout this sideways "box," the volume has been drying up. This indicates that sellers are becoming scarce, and the stock is being absorbed by buyers in preparation for the next move.
3. Momentum Indicators:
- EMAs: Short-term EMAs are in a "PCO" (Price Crossover) state, showing bullish momentum.
- RSI: The RSI is rising, indicating that buying strength is building up under the surface.
4. Recent Price Action:
The surge in October (+4.18% on high volume) was an attempt to break this resistance. It failed, which confirms that the ₹415 level is a formidable barrier that will require significant volume to overcome.
🎯 The Scenarios
This is a "wait and watch" setup where we let the price tell us what to do next.
- 🐂 THE BULLISH CASE (Trigger)
I am watching for a decisive daily close above the ₹415 resistance level . This must be accompanied by a high-volume spike (higher than the October attempt) to confirm that the supply has finally been absorbed.
- Target 1: ₹490 .
- Next Target: Price discovery.
- 🐻 THE BEARISH CASE (Invalidation)
If the stock fails to break out and instead breaks down with conviction, the setup is invalidated.
- Trigger: A daily close below the ₹365 support level .
- Target: A deeper correction.
Conclusion:
The indicators and volume profile suggest a bullish resolution. The stock is coiling, and the pressure is building. The smart money is waiting for the high-volume breakout above ₹415 for confirmation.
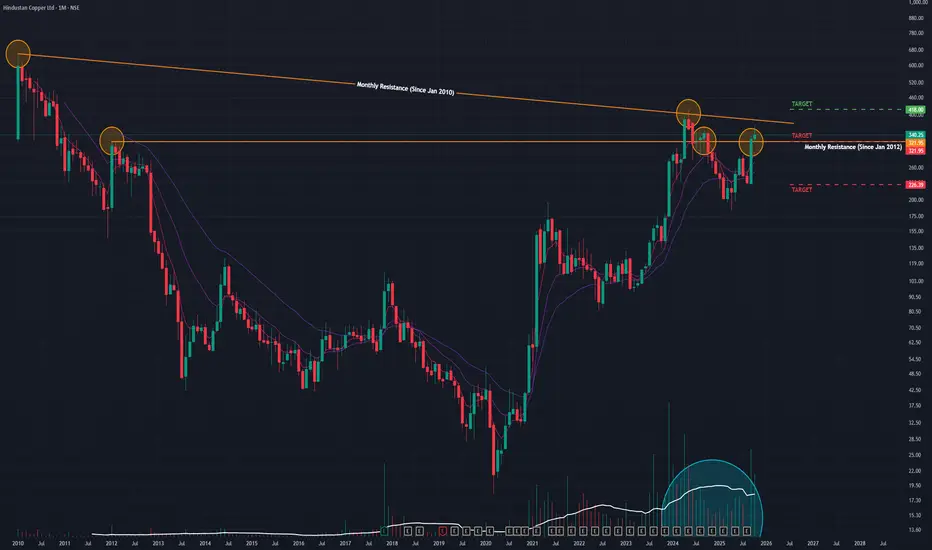
HindCopper (M): Very Bullish, but at a major inflection pointThe stock has successfully completed a multi-decade base breakout and is now challenging its final long-term resistance. The momentum is bullish, but a new ATH will require a confirmed break of the 2010 trendline.
📈 1. The Long-Term Context (The "Big Picture")
- Parabolic Uptrend: After hitting its all-time low in March 2020, the stock has been in a massive bullish uptrend, surging over 2,170% from its bottom.
- Brief Correction: This major move was followed by a healthy, brief downtrend/consolidation that found its low in May 2025, allowing the chart to reset for its next move.
- Recent Rising Volume: Critically, trading volume has been rising significantly in recent months, confirming strong investor interest in this new trend.
🚀 2. The Current Breakout (The Decisive Move)
The stock is currently navigating two of the most significant resistance levels on its multi-decade chart:
1. Jan 2012 Horizontal Resistance: A major structural level that capped all rallies for over 12 years.
2. Jan 2010 Angular Resistance: A long-term downtrend line that forms the final barrier to a new price discovery phase.
In September and October, the stock achieved a major milestone: it broke out and closed above the 12-year horizontal resistance line .
During October, the stock successfully retested this old resistance as new support . While it finished the month with a 3.28% gain on exceptionally high volume , it also formed an "inverted hammer" candle. This candle at a new support level is a sign of a "battle," where sellers tried to push the price down but buyers ultimately stepped in, defending the breakout.
📊 3. Key Technical Indicators
The underlying momentum on higher timeframes supports a bullish resolution:
- RSI: The Relative Strength Index is rising on the Monthly chart, indicating strong, sustained buying momentum.
- EMAs: The short-term Exponential Moving Averages are in a "PCO" (Price Crossover) state on the Monthly timeframe, confirming the long-term trend is powerfully bullish.
🎯 4. Future Scenarios & Key Levels to Watch
The stock is currently coiled less than 15% below its final angular resistance from 2010.
🐂 The Bullish Case (Final Breakout)
- Trigger: A decisive, high-volume breakout and close above the 2010 angular resistance trendline .
- Confirmation: This would confirm the start of a new, long-term bull market and put the stock into "blue-sky" price discovery.
- Target: The next logical technical price target is projected to be ₹415 , with a high probability of a move toward a new ATH.
🐻 The Bearish Case (Breakout Failure)
- Trigger: The stock fails to break the 2010 trendline and, more importantly, loses its new support (the 2012 breakout level).
- Confirmation: A high-volume close below the ₹320 support level.
- Target: This failure would signal a fake breakout and could lead to a sharp correction, retesting the next major support level at ₹225 .
Conclusion
This is a high-conviction breakout setup. The successful retest of the 12-year resistance is a very bullish sign. All eyes should now be on the 2010 angular trendline . A break above it would be the final confirmation, while a failure and drop below ₹320 would invalidate the immediate bullish thesis.
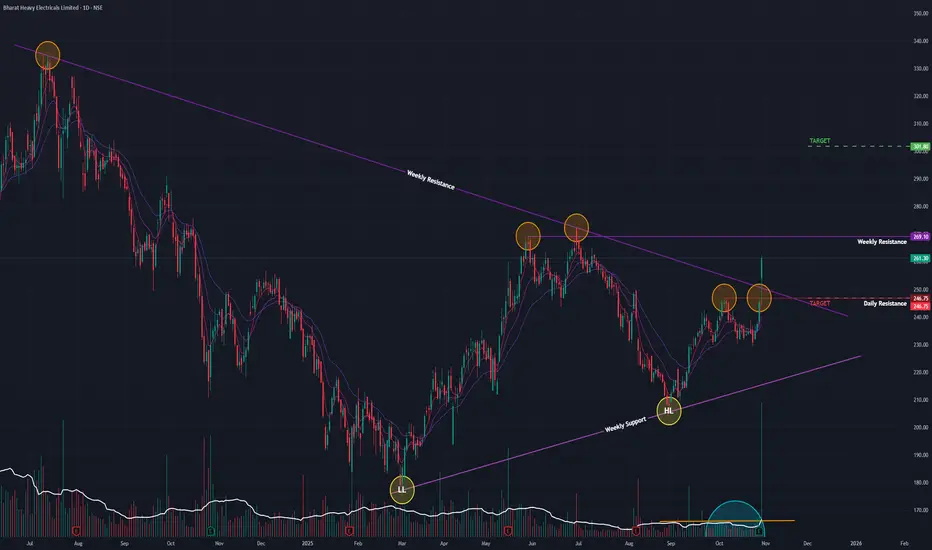
BHEL (D): Strongly Bullish, on a high-volume trendline breakoutThe stock has shown a significant character change, breaking a long-term corrective downtrend with exceptional force. All short-term and long-term indicators are aligning, suggesting a new bullish leg has begun.
📉 1. The Long-Term Context (The "Big Picture")
- Massive Run-Up: After a parabolic 1,720% surge from its March 2020 bottom, the stock hit a major peak in July 2024.
- Corrective Downtrend: This was followed by a healthy 8-month correction (Jul 2024 – Feb 2025), which allowed the stock to build a new base.
- Reversal Pattern: In recent months, the stock has reversed this trend by forming a clear pattern of Higher Lows , indicating that selling pressure has been absorbed and accumulation has taken place.
🚀 2. The Current Breakout (Today's Decisive Action)
Today's price action is the most significant bullish signal for the stock this year.
- High-Volume Surge: The stock surged +6.48% on massive volume of 75.43 Million shares, indicating strong institutional interest.
- Major Trendline Break: The price gapped up above the angular resistance trendline (formed since the July 2024 high) and, most importantly, closed firmly above it .
- Short-Term Breakout: This move also broke and closed above a minor, short-term resistance, adding to the bullish conviction.
📊 3. Key Technical Indicators
The underlying momentum across all timeframes supports this breakout:
- RSI: The Relative Strength Index is rising on the Daily, Weekly, and Monthly charts, showing broad-based, building momentum.
- EMAs: Short-term Exponential Moving Averages are in a "PCO" (Price Crossover) state on all three timeframes, confirming the trend is strongly bullish.
🎯 4. Future Scenarios & Key Levels to Watch
The path forward is now defined by two clear levels:
🐂 The Bullish Case (Breakout Confirmation)
- Immediate Hurdle: The next major test is the horizontal resistance at ₹265 .
- Confirmation: A decisive close above ₹265 would confirm the breakout and open the door for a significant rally.
- Target: If this momentum is sustained, the next logical price target is the ₹300 level.
🐻 The Bearish Case (Fake Breakout)
- Trigger: If today's move is a "fakeout," the price will fail to breach ₹265 and fall back below the broken angular trendline.
- Confirmation: A close back below the gap-up level (today's open) would be a bearish sign.
- Target: This failure would likely see the stock fall to retest its closest support at ₹245 .
Conclusion
Today's high-volume, gap-up breakout above a multi-month downtrend line is a powerful bullish event. The indicators are all aligned, suggesting this is the start of a new upward move. The key level to watch for confirmation is ₹265 .
IOC ASCENDING TRIANGLE BREAKOUTIOC breaking ascending triangle weekly basis
with huge volume this week
RSI bullish above 60
trading above 20 week ema
target1 180 target 2 can be 196
NO BUY/SELL RECOMENDATION

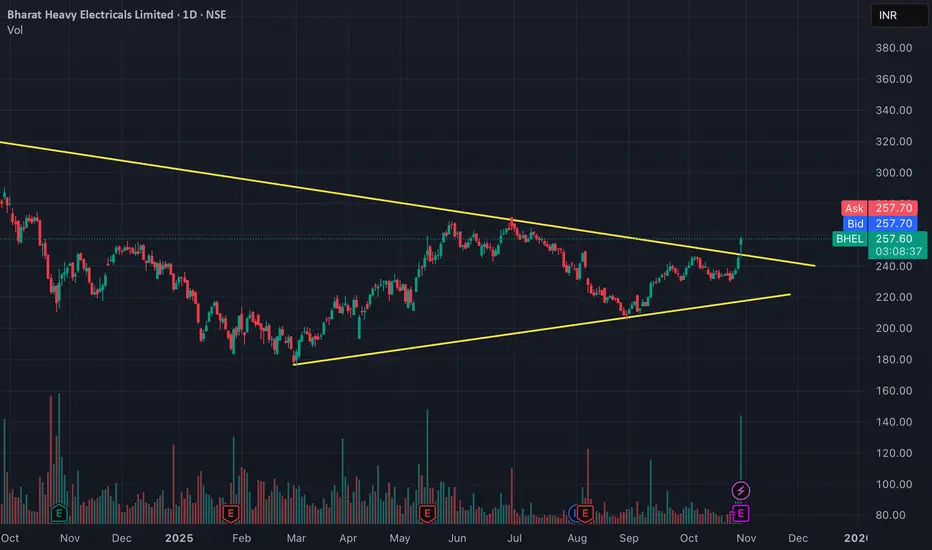
Breakout - BHELThere is a breakout in triangle pattern in BHEL with a strong volume. It is expected to give minimum 5% returns.
Disclaimer: Make you own analysis before investment
MRPL (D): At a Critical ResistanceOverall Context and Current Setup
After reaching its all-time high in February 2024, MRPL entered a pronounced downtrend. However, a potential reversal has been forming since March 2025, marked by the stock establishing a clear pattern of Higher Lows .
The stock is currently challenging a critical, long-term horizontal resistance line that originated in October 2024. This level has repelled multiple breakout attempts in the past.
Today's Price Action
Today, the stock showed significant bullish intent, surging 4.26% on massive volume of 31.2 million shares . Despite this strength, the price action revealed a key struggle:
- The stock broke above the resistance line intraday but failed to secure a close above it. This indicates that significant selling pressure still exists at this level.
Bullish Indicators
Several indicators support a potential bullish breakout:
- Volume: Buying interest has been increasing, with surging volume over the past few days.
- SMA: A Golden Crossover (e.g., 50-day SMA crossing above the 200-day SMA) confirmed just three days ago, signaling potential long-term bullish momentum.
- EMAs: Short-term Exponential Moving Averages are in a positive crossover state (showing bullish alignment) across the Monthly, Weekly, and Daily timeframes.
- RSI: The Relative Strength Index (RSI) is rising on all three timeframes, indicating strengthening upward momentum.
Potential Scenarios
The current setup presents a classic conflict between strong bullish indicators and a powerful overhead resistance.
1. Bullish Scenario: The primary confirmation signal to watch for is a decisive daily close above the resistance line, supported by high volume. If the stock can achieve this, it would signal a confirmed breakout, with the next potential target near the 195 level .
2. Bearish/Consolidation Scenario: If the breakout fails and momentum wanes, the stock is likely to pull back. The most significant support level to watch would be at 138 , which aligns with the recent structure of higher lows.
Conclusion: The battle at this resistance line is critical. The price action in the coming days will be key to determining whether the bullish momentum is strong enough to finally break through or if the stock will reject this level once again.

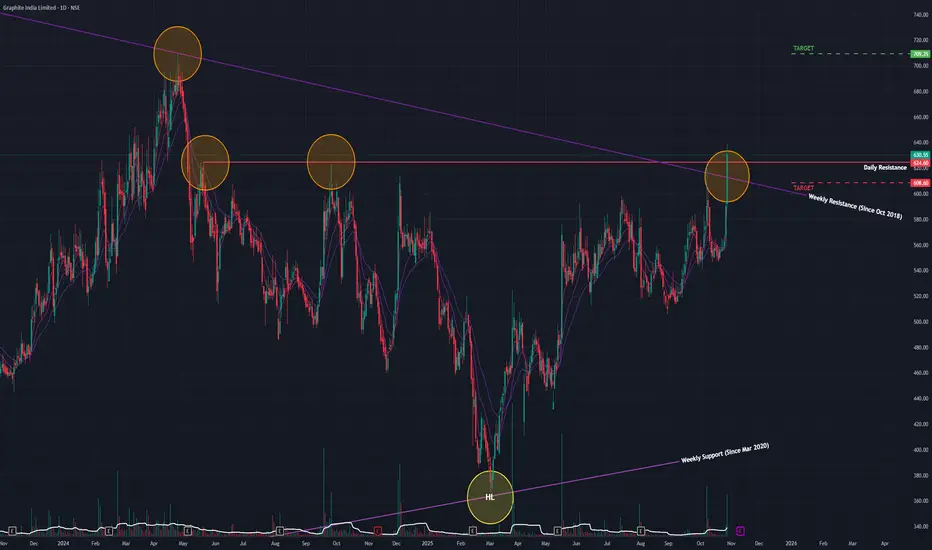
Graphite (D): Mighty Dual-Resistance Breakout Signals Major RevAfter being in a multi-year downtrend since its All-Time High (ATH) in August 2018, Graphite India (GRAPHITE) is showing compelling signs of a major trend reversal. Today's powerful price action has broken through two critical resistance levels, suggesting a new uptrend may be underway.
The Long-Term Bottoming Process
While the stock peaked in 2018, a very long-term bottoming process has been in place. Since April 2020, the stock has been forming a pattern of Higher Lows (clearly visible on the Monthly chart), indicating a gradual shift from supply to demand over the years. Although there was a more recent downtrend from May 2024, that appears to have reversed starting in March 2025.
Today's Decisive Dual Breakout
Today's session (Wednesday, October 29, 2025) was technically very significant:
- Strong Price Surge: The stock rallied by +6.82% .
- Massive Volume: The move was supported by a huge volume of 8.6 million shares , indicating strong buyer conviction.
- Dual Resistance Breach: In a powerful display, the stock broke out and closed above two key resistance levels simultaneously :
1. A long-term angular resistance trendline in place since October 2018.
2. A short-term horizontal resistance trendline formed since May 2024.
Breaking through a confluence of long-term and short-term resistance on high volume is a potent bullish signal.
Broad-Based Technical Strength
This breakout is strongly supported by a clear alignment of momentum indicators across all major timeframes (Monthly, Weekly, and Daily):
- Short-Term EMAs: All three timeframes are in a bullish Positive Crossover (PCO) state.
- RSI (Relative Strength Index): The RSI is also in a rising trend on all three timeframes.
Outlook and Key Levels to Watch
With this dual breakout, the technical landscape has shifted significantly in favor of the bulls.
- Bullish Target: If the stock can sustain this momentum, the next logical area of resistance and potential price target is the ₹709 level. The ideal confirmation, would be a successful re-test of the broken resistance zone followed by a bounce.
- Critical Support: If this breakout proves to be a "fakeout" and the price falls back below the broken resistance, the key support level to watch is ₹608 . A close below this would negate the bullish signal.
In conclusion, today's action represents a potentially major turning point for Graphite India. Confirmation via a successful retest would provide the highest confidence that a new long-term uptrend has begun.
Vintage Coffee (D): Breaks Out of Consolidation on High VolumeAfter a powerful 125% rally since March 2025, Vintage Coffee (VINCOFE) entered a healthy sideways consolidation phase in July. Today, that consolidation has been decisively resolved to the upside, signaling a potential continuation of the primary uptrend.
Today's Decisive Breakout
The stock has been capped by a stubborn horizontal resistance trendline since July, with multiple previous breakout attempts failing* at this level. Today's price action (Wednesday, October 29, 2025) was different:
- Strong Price Surge: The stock rallied by +7.82% .
- High-Volume Confirmation: The move was supported by a strong volume of 7.53 million shares.
- Key Resistance Breach: Most importantly, the stock closed above the resistance trendline , a significant technical victory for the bulls.
This breakout is particularly convincing because it follows a classic volume pattern: volume dried up during the consolidation and then surged in the past couple of days, fueling today's successful move.
Underlying Technical Strength
The breakout is well-supported by key momentum indicators on the Weekly and Daily timeframes:
- The short-term Exponential Moving Averages (EMAs) are in a bullish Positive Crossover (PCO) state.
- The Relative Strength Index (RSI) is in a rising trend.
Outlook and Key Levels to Watch
With the consolidation now broken, the path of least resistance is higher.
- Bullish Target: If this bullish momentum is sustained, the next logical area of resistance and potential target is the ₹180 level.
- Critical Support: The old resistance level, around ₹155 , is now the most critical new support zone.
As you rightly noted, the ideal scenario would be a successful re-test of this ₹155 level. A bounce from this "resistance-turned-support" would provide the strongest confirmation for the next leg up.

MRPL Triangle BreakoutMRPL has given a Breakout after forming a Triangle Pattern on 1D timeframe with very high volumes. The stock is also trading above its 200EMA.
