Eternal (D) - Hits New High But Stalls at Channel ResistanceZomato has been trading in a predictable, well-defined pattern, but recent price action, including a new all-time high today, is showing significant signs of exhaustion that could signal a short-term reversal.
The Ascending Channel
Since July 2025, the stock has been trading within a clear ascending channel , consistently respecting the upper boundary as resistance and the lower boundary as support. This pattern has provided a reliable roadmap for the stock's trajectory.
Today (Tuesday, October 14, 2025), while the stock did register a new All-Time High (ATH), it importantly failed to break out of the channel's resistance and was rejected from this upper boundary. This price action suggests that selling pressure is emerging at this predictable level.
Warning Signs of Waning Momentum
Several indicators support the view that the current up-move is losing steam, despite the new high:
- Bearish Divergence: The Relative Strength Index (RSI) is in a "lowering state" while the price is making new highs. This is a classic bearish divergence , a strong indicator that the underlying momentum of the trend is weakening.
- Declining Volume: The recent rally towards the top of the channel has been accompanied by decreasing volume, which suggests a lack of strong conviction from buyers at these higher levels.
While the short-term EMAs remain in a bullish state, the rejection at resistance combined with these warning signs presents a compelling case for a potential pullback.
Outlook
Based on the consistent channel pattern and the clear signs of weakening momentum, the most probable scenario is that Zomato will reverse from this resistance level and trend down towards the channel's support line.
The key action to watch for in the coming days is a confirmation of this reversal, such as a close below today's low or the formation of a strong bearish candle. A decisive, high-volume breakout above the channel's resistance would be needed to invalidate this bearish outlook.
Volume

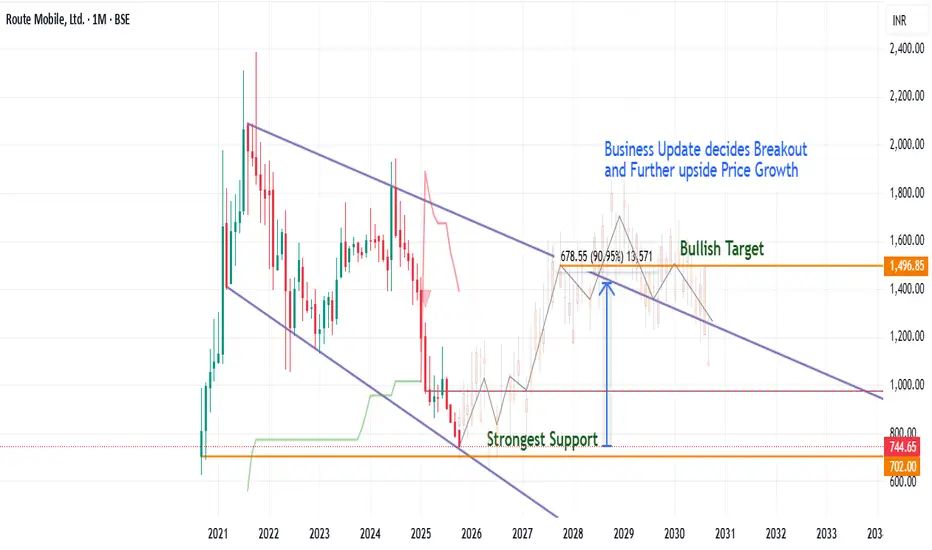
"Broadening Wedge Descending Pattern – Route Mobile" (Bullish)🔹 Technical Setup:
A Broadening Wedge Descending Pattern has emerged on the monthly timeframe, signaling a potential major trend reversal after a prolonged consolidation.
The stock has tested and respected its strongest support zone (₹700–₹750) and is now attempting a breakout, indicating the early stage of a multi-year bullish cycle.
📈 Pattern: Broadening Wedge (Descending)
🧭 Strong Support: ₹700–₹750
🎯 Bullish Target Zone: ₹1,500+ (first breakout confirmation)
📊 Potential Upside: ~90% from support
⚡ Trigger: Breakout above ₹1,500 sustained with business growth momentum
🔹 Fundamental & Business Catalysts Supporting the Breakout:
1) Global Expansion Momentum – Integration with Kaleyra expands Route Mobile’s presence to 100+ countries and strengthens Tier-1 enterprise relationships.
2) Strong Backing from Proximus Group (Belgium) – Adds credibility, global scale, and capital depth for accelerated growth.
3) Technology Edge with Nokia Partnership – Co-developing secure, carrier-grade CPaaS solutions for operators and enterprises worldwide.
4) Enterprise Wins Boosting Recurring Revenue – Projects with IRCTC, L&T Metro, and Nagpur / Hyderabad / Pune Metros in smart ticketing and enterprise communication.
5) Google RCS Collaboration – Reinforces Route Mobile’s role in next-generation, AI-driven messaging ecosystems.
6) New Growth Engine – Konera Platform Launch 🚀
***Enables seamless API integration for fintechs, enterprises, and developers.
***Offers global communication coverage through a unified API layer.
***Aims to reach 92% of India’s population by year-end, fueling massive digital connectivity and CPaaS adoption.
Manaksla (D) - Surges 11%, Challenges All-Time High ResistanceManaksla Coated Metals & Ind is showing significant strength, with a powerful surge today pushing it directly against its all-time high resistance. While the underlying trend is bullish, a confirmed breakout is still needed to signal the next leg up.
The Context: Uptrend and Consolidation
The stock has been in a healthy uptrend, which recently culminated in the formation of a new All-Time High (ATH). Following this peak, the stock entered a sideways consolidation phase over the past few weeks, a common and often constructive pattern as it absorbs previous gains before its next potential move.
Today's Powerful Move
Today's session (Monday, October 13, 2025) saw a significant increase in buying pressure:
- Strong Price Gain: The stock surged by +11.05% .
- High Volume: This move was supported by a robust volume of 25.95 million shares .
Crucially, despite this strong surge, the stock closed the day still within its consolidation range , right at the doorstep of the ATH resistance. This sets up a critical test for the days ahead.
This bullish intent is backed by strong technical indicators. The short-term Exponential Moving Averages (EMAs) and the Relative Strength Index (RSI) are both in a bullish state across the Monthly, Weekly, and Daily timeframes.
Outlook and Key Levels to Watch
The immediate future of the stock hinges on its ability to overcome the ATH resistance.
- Bullish Breakout Trigger: A decisive close above the All-Time High on strong volume would confirm a breakout. This would signal a continuation of the primary uptrend, with a potential next target of ₹210 .
- Potential Pullback Scenario: If the stock is rejected from this resistance and fails to break out, it may pull back towards the lower end of its consolidation range. The key support level to watch is ₹128 , which, as you noted, could present a favorable buying opportunity for those looking to enter on a dip.
In conclusion, Manaksla is at a critical juncture. The battle at the all-time high resistance is the key event to monitor. A breakout would affirm the bulls are in control, while a rejection would suggest a longer period of consolidation.

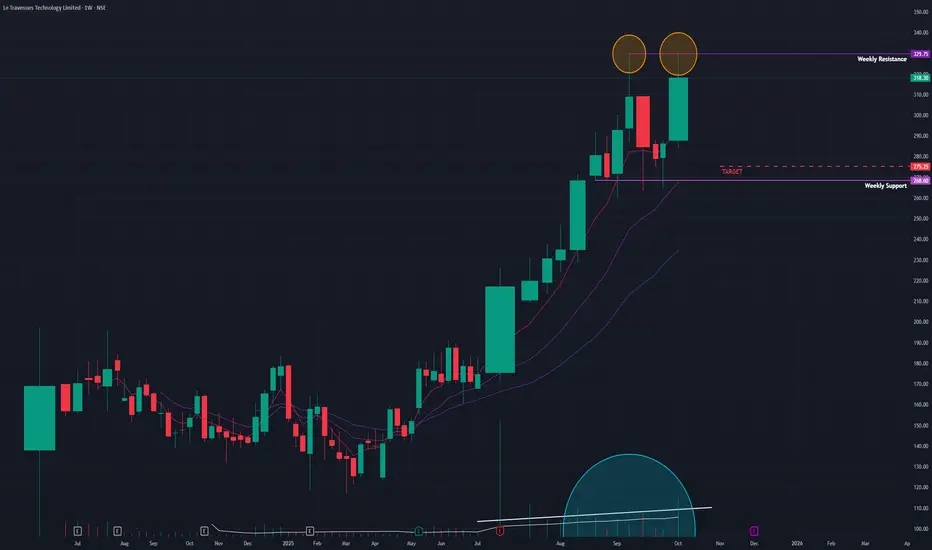
Ixigo (W) - At a Crossroad: Bullish Trend vs. Bearish PatternAfter a spectacular run-up, Ixigo (Le Travenues Technology Ltd) has entered a sideways consolidation phase. The current price action presents conflicting technical signals, placing the stock at a critical inflection point where it could either be pausing before another surge or forming a major top.
The Powerful Backdrop
Since April 2025, Ixigo has been in a powerful bull market, delivering an extraordinary gain of approximately 166% in just a few months. Following this rapid ascent, the stock's strong momentum has paused since August 2025, with the price now trading within a well-defined horizontal range.
The Current Dilemma: Two Competing Scenarios
The technical picture offers two distinct and competing interpretations:
1. The Bullish Case (A Healthy Consolidation):
This perspective views the current phase as a normal and healthy pause, where the stock is building energy for its next advance. This argument is supported by:
- Strong Underlying Momentum: Key indicators like the short-term Exponential Moving Averages (EMAs) remain in a bullish positive crossover state, and the Relative Strength Index (RSI) is still rising, suggesting the primary uptrend remains intact.
2. The Bearish Warning (A Potential Reversal):
Conversely, there are clear warning signs that the rally could be losing steam:
- Potential Double-Top: A Double-Top pattern , a classic bearish reversal signal, appears to be forming at the upper boundary of the trading range.
- Elevated Volume: Typically in a bullish consolidation, volume tends to decrease. However, volume has remained relatively high during this phase, which at a potential peak, can be a sign of distribution (selling) rather than accumulation.
Conclusion and Key Triggers to Watch
Ixigo is currently in a state of equilibrium, and a breakout from the current range is required for confirmation of the next directional move.
- Bullish Trigger: A decisive close above the range's resistance would invalidate the Double-Top pattern and signal a continuation of the uptrend. This would open a path towards the ₹380 level.
- Bearish Trigger: A decisive close below the range's support would confirm the Double-Top pattern, suggesting the bullish momentum has faded and a correction towards the ₹275 level could be imminent.
Until either of these levels is breached, patience is warranted. The direction of the break from this consolidation will be the key to identifying the stock's next major trend.
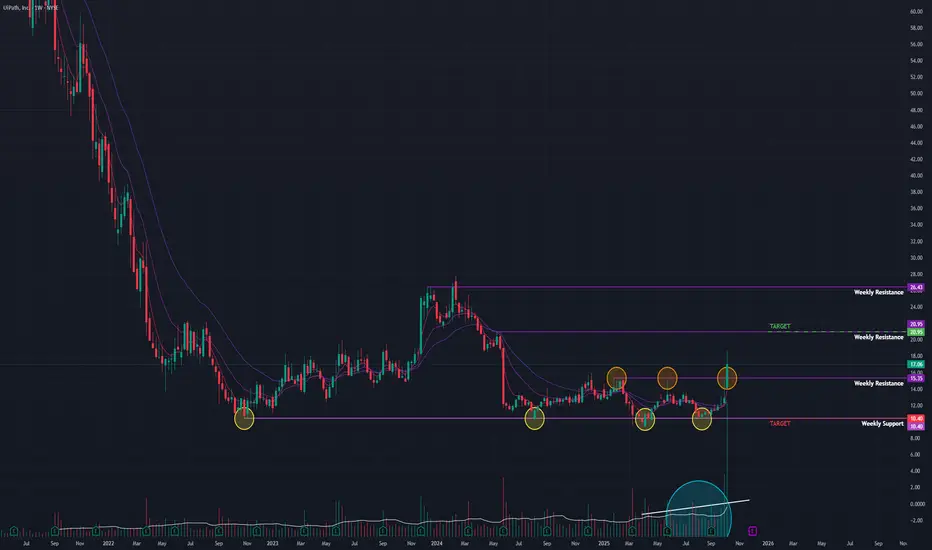
UI Path (W) - A Massive 32% Surge Signals Major Trend ReversalAfter being locked in a severe bear market since its 2021 IPO, UI Path (PATH) has just delivered its most significant bullish signal to date. An explosive, high-volume breakout this past week suggests its multi-year basing phase may be complete and a new major uptrend is beginning.
The Long-Term Bottoming Process
Following its IPO in April 2021, UI Path entered a protracted downtrend. The stock finally stopped making new lows in October 2022, transitioning into a multi-year sideways consolidation range. This long basing period is often where accumulation occurs, setting the stage for a potential trend reversal.
This Week's Explosive Breakout
The week ending Friday, October 10, 2025, marked a dramatic shift in character for the stock:
- Monumental Weekly Gain: The stock skyrocketed by an incredible +32.21% .
- Enormous Volume: This move was validated by a massive trading volume of 366.81 million shares , indicating powerful institutional buying.
- Major Resistance Breach: The surge shattered a key resistance level that had capped prices for the duration of its multi-year consolidation.
This powerful price action has flipped the short-term Exponential Moving Averages (EMAs) into a bullish positive crossover. Concurrently, the Relative Strength Index (RSI) is now strongly rising on both the Monthly and Weekly charts, confirming a significant shift in long-term momentum.
Outlook and Key Levels
The breakout from a multi-year base is a technically powerful event that could define the stock's direction for months to come.
- Bullish Target: If this newfound momentum is sustained, the next major area of resistance and potential target is the $21 level.
- Critical Support: In case of a pullback, the breakout zone around the $10 level is now the most critical new support. A failure to hold this level would invalidate the bullish signal.
This week's action represents a significant technical turning point for UI Path. The key now is to watch for follow-through buying or a successful retest of the $15.35 breakout level to confirm the start of a new, sustained uptrend.
PNB (W) - Historic Crossroads, 15-Year Trendline Breakout LoomsPunjab National Bank (PNB) is currently positioned at one of its most significant technical junctures in over a decade. A classic bullish reversal pattern is now challenging a formidable, long-term resistance, setting the stage for a potentially explosive move.
The Bullish Setup: An Inverted Head & Shoulders
After reversing its downtrend in February 2025, the stock has meticulously formed a large Inverted Head and Shoulders pattern . This is a well-regarded bullish reversal pattern that typically signals the beginning of a sustained uptrend upon a successful breakout.
The Critical Resistance Confluence
What makes this setup particularly compelling is the location of the pattern's neckline. A breakout requires the stock to overcome a confluence of two powerful resistance levels simultaneously:
1. A 15-Year Resistance Trendline: A major, long-term descending trendline that has been in place since November 2010. Breaking this would be a historically significant event.
2. A Short-Term Horizontal Resistance: A more recent horizontal price ceiling that aligns perfectly with the long-term trendline.
This alignment of a classic reversal pattern with a multi-decade resistance makes the current price level a critical battleground between buyers and sellers.
Supporting this potential breakout, momentum indicators are strong. The short-term EMAs are in a positive crossover and the RSI is rising on both the Monthly and Weekly timeframes. Furthermore, a gradual increase in volume recently suggests growing buyer interest.
Outlook and Key Levels
The outcome depends entirely on whether this critical resistance zone can be breached.
- Bullish Breakout Scenario: A decisive close above the neckline and the dual trendlines, especially on high volume, would confirm the breakout. The measured target of the pattern projects a potential move towards the ₹138 level.
- Rejection Scenario: If the stock fails to overcome this heavy resistance, a rejection could send it back to test support near the ₹100 level, which roughly corresponds to the right shoulder of the pattern.
The key signal to watch for is a high-volume close above the neckline. Until that occurs, this historic resistance remains the primary obstacle.

SIB (W) - A Powerful Breakout After a Bullish ReversalAfter a brief downtrend from its January 2024 all-time high (ATH), South Indian Bank has signaled a strong bullish reversal, culminating in a decisive, high-volume breakout this past week.
The Reversal and Consolidation
The stock's downtrend was halted by the formation of a Double Bottom , a classic bullish reversal pattern, which kicked off a new uptrend in April 2025. Following this, the stock entered a consolidation phase, trading sideways as it approached a descending resistance trendline from its ATH. During this period, trading volume noticeably dried up, often a precursor to a significant move.
This Week's Decisive Breakout
The stock broke out of its consolidation this week with exceptional force:
- Massive Price & Volume Surge: The stock gained +15.04% , supported by an enormous volume of 180.45 million shares.
- Dual Resistance Breach: The breakout was technically significant as the price closed decisively above two key resistance levels: the primary descending trendline and a short-term horizontal resistance.
This powerful move is strongly supported by momentum indicators. The short-term Exponential Moving Averages (EMAs) show a positive crossover, and the Relative Strength Index (RSI) is rising on both the Monthly and Weekly charts, indicating strong underlying momentum.
Outlook and Key Levels
The breakout suggests a clear upward path, but key levels should be monitored.
- Bullish Target: If the momentum continues, the next major target is the ₹45 level. This would require the stock to break through its previous ATH, which will now act as a significant resistance zone.
- Key Support: If the breakout fails to sustain, the primary support area is likely to be around the ₹27 level.
The key now is to watch for follow-through buying in the upcoming week or a potential retest of the broken trendline as support, which would further confirm the strength of this new uptrend.

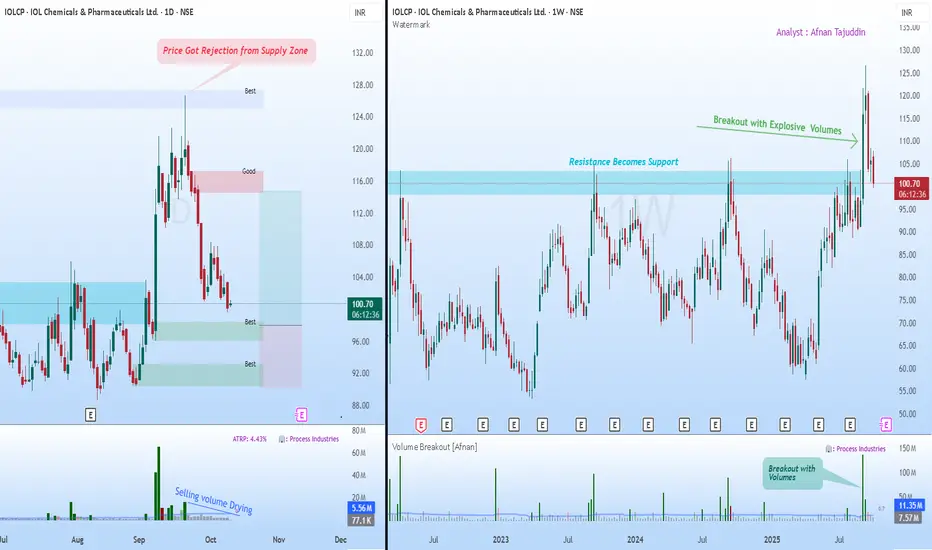
Supply & Demand Setup in IOLCP Could Signal Next Big Move📊 Supply & Demand View 📊
If you’ve been watching IOL Chemicals lately, you’ve probably noticed how cleanly it’s been respecting those key supply and demand structures. These zones aren’t random—they’re the visible fingerprints of institutions building or offloading positions in stages. When price revisits such levels, we often see sharp, almost surgical reactions.
Now, what’s catching my eye on the daily chart is the recent rejection from a supply zone. The pushback was clear, triggering a short-term decline. But here’s where it gets interesting: the selling volume has been steadily tapering off. That usually suggests the aggressive sellers are stepping aside, hinting that downside momentum could be losing steam.
Meanwhile, we’ve got multiple untested demand zones forming below—areas where buyers have shown conviction before. If price drifts into one of these regions again, I wouldn’t be surprised to see a fresh wave of institutional buying step in.
🚀 Breakout Retest View 🚀
Zooming out to the weekly chart tells a complementary story. After grinding under a major resistance for months, the stock finally broke through with explosive volume —the kind that only big money typically leaves behind. That breakout wasn’t just a blip; it reset the broader structure.
Now, the same resistance level has flipped into support—a textbook case of the law of polarity . As long as price continues to respect that zone, the larger trend remains firmly constructive.
What I find compelling is the combination of elements here: strong breakout volume, a healthy pullback, and structure alignment across timeframes. All signs point to this being a typical retest phase rather than a reversal.
✨ Final Takeaway ✨
Both charts are speaking the same language. The daily timeframe is hinting at exhaustion from sellers, while the weekly view reinforces the idea of a bullish continuation once demand reasserts itself. Should price stabilize around those lower demand zones, we could be looking at the next leg of the trend unfolding from there.
💡 Risk Management Reminder 💡
It’s easy to get carried away when the setup looks clean, but the market doesn’t owe certainty to anyone. Stick to your stop-loss, size your positions with care, and remember that discipline—more than any indicator—is what protects your capital.
“Charts reveal opportunities, but discipline secures profits.”
🔄 Stay patient, stay consistent — the market rewards preparation, not prediction. 🔄
This breakdown is shared purely for educational purposes and shouldn’t be taken as a trading or investment recommendation. I’m not a SEBI-registered analyst.
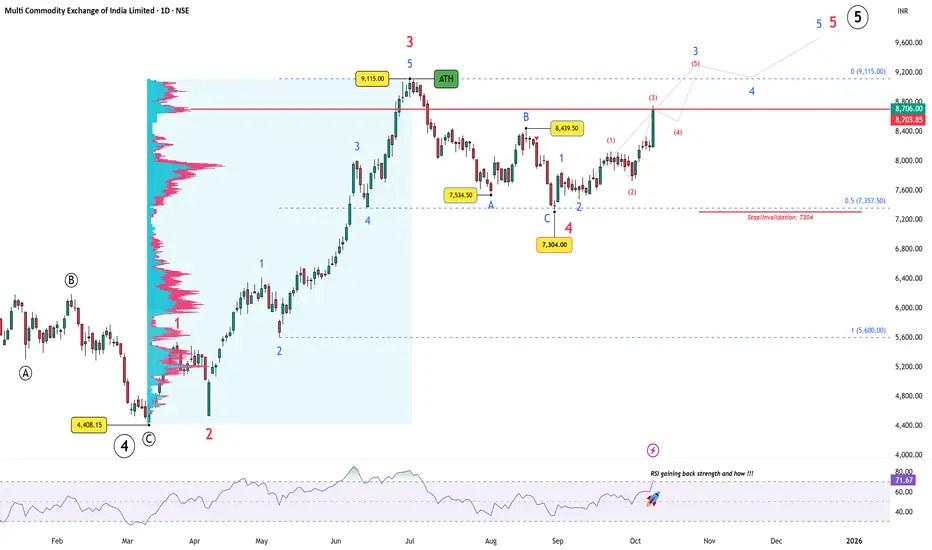
MCX: Riding the Bullion Buzz, One Wave at a TimeBack in July, MCX reached its peak at ₹9,115 — to complete an extended wave 3 which was accompanied by RSI divergence and fading momentum. A correction was expected, and the market delivered precisely that.
Price found support almost to the point — ₹7,304 , marking the completion of Wave 4 within the broader impulse. The retracement ended right at 0.5 Fibonacci level of wave 2 and wave 3, validating the initial projection.
Since then, structure has shifted to a bullish 1-2, 1-2 formation, suggesting that a new impulsive advance (Wave 3 of 5) is in progress. RSI has turned sharply higher — gaining back strength and how!!!
Meanwhile, the macro picture adds fuel. With gold and silver rallying relentlessly , trading volumes across the commodity space have surged — a direct tailwind for MCX’s business model. Rising activity in precious metals typically translates into higher revenue for the exchange, aligning both fundamentals and technicals toward the same bullish narrative.
Key Levels
Support : ₹7,304 (Wave 4 low)
Resistance : ₹9,115 (ATH)
Intermediate zone : ₹8,700–₹8,800 (FRVP resistance shelf)
As long as price holds above ₹7,304, MCX remains positioned for a continuation toward new highs in the coming weeks.
Disclaimer: This analysis is for educational purposes only and does not constitute investment advice. Please do your own research (DYOR) before making any trading decisions.
Crompton Greaves: Momentum Exhausted, Base Formation UnderwayAfter a sharp corrective leg, Crompton Greaves Consumer appears to be completing a Wave (2) retracement, setting the stage for a potential next impulse.
Wave Structure
The broader cycle from the ₹125 low (2016) to ₹512.80 (2021) unfolded as a clean five-wave impulse , marking higher-degree Wave 1.
A deep A–B–C correction followed, bottoming near ₹251 — the low of higher-degree Wave 2.
From there, the stock rallied in five waves to ₹484 (labeled Wave (1) of the new impulse).
The ongoing decline fits neatly as a Wave (2) correction, which could be nearing completion — right above the crucial invalidation level of ₹251.
As long as ₹251 holds, the bullish impulse count remains valid.
Momentum Check
RSI on the weekly timeframe has dipped near 31, retesting its prior reversal zone.
“Momentum washed out — Wave (2) may be nearing completion.”
That aligns with the exhaustion one typically sees at the tail end of a corrective C-wave.
Technical Context
The Volume Profile shows heavy trading between ₹300–₹320 — the key supply-demand zone.
Once price reclaims this shelf, it could validate the start of Wave (3), potentially targeting new highs over the coming quarters.
Invalidation remains at ₹251 — a clean, technical stop defining structural risk.
Fundamental Snapshot
Crompton’s numbers reinforce the long-term base-building narrative:
Revenue : ₹78.61 B in FY 2025 — a steady climb from ₹39 B in 2017.
Free Cash Flow : ₹6.06 B, with healthy generation despite periodic volatility.
Debt : Nil as of FY 2025 — a clean balance sheet.
P/E Ratio : ~34.8, compressing over the past two years as earnings normalized.
Market Cap : ₹181 B, stable yet below its 2021–22 peak, indicating subdued sentiment.
Summary
The setup points to a near-completion of corrective structure, exhausted momentum, and stable fundamentals — a combination that often precedes a strong impulsive advance.
Disclaimer:
This analysis is for educational purposes only and does not constitute investment advice. Please do your own research (DYOR) before making any trading decisions.
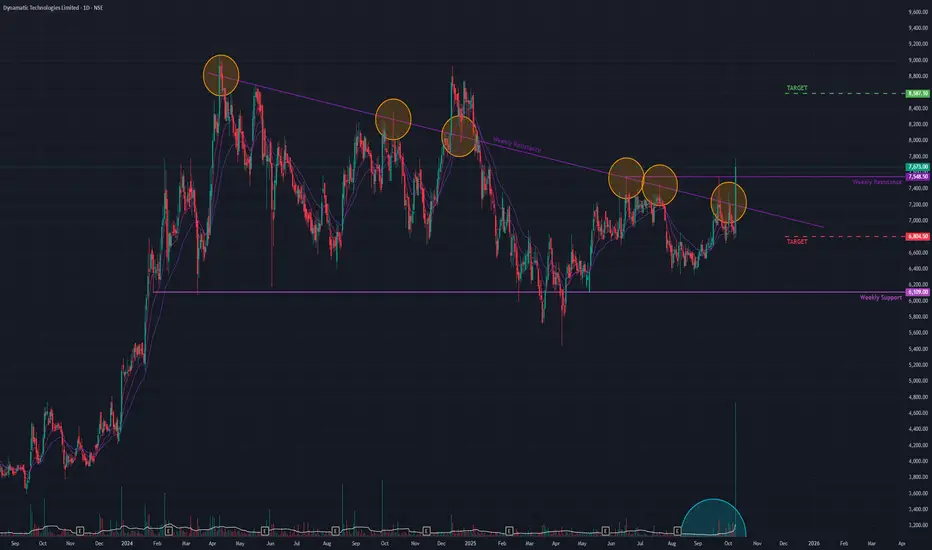
Dynamatic (D) - Double Breakout Signals Trend ContinuationAfter consolidating since its all-time high in April 2024, Dynamatic Technologies has delivered a powerful and technically significant breakout, suggesting its previous uptrend is ready to resume.
The Consolidation Pattern
For the past several months, the stock has been trading within a Triangle Pattern . This is a classic continuation pattern, indicating a pause in the trend rather than a reversal. While there have been several attempts to breach the upper descending trendline of this pattern in the past, all have failed, highlighting the strength of the resistance.
Today's Decisive Breakout
Today's session was exceptionally bullish and stands out from previous attempts for two key reasons:
1. Powerful Surge: The stock surged +12.19% , decisively breaking out of the triangle pattern's angular resistance.
2. Dual Confirmation: Critically, the move also pushed the stock's closing price above a key horizontal resistance level that has been in place since June 2025.
Breaking two distinct and significant resistance levels on the same day provides strong confirmation that this is a genuine breakout, not another "fakeout."
Outlook and Key Levels
With the consolidation phase likely over, the path of least resistance appears to be upward.
- Bullish Target: If this bullish momentum is sustained, the next logical target for the stock is the ₹8,590 level.
- Key Support: Should the momentum fade, the recently breached horizontal resistance near ₹6,800 is now expected to act as the primary support level.
The key confirmation to watch for in the coming days is sustained trading above the breakout zone. A successful retest of this area as support would further validate the bullish outlook.
Sky Gold (D) - A Golden Breakout from the Downtrend?After being in a corrective downtrend since its all-time high in December 2024, Sky Gold has just executed a technically significant breakout. This move suggests that the period of selling pressure may be concluding and a new uptrend could be underway.
The Breakout Signal
The stock has been constrained by a descending (angular) resistance trendline that formed from its peak. Today's price action decisively broke this barrier:
- Trendline Breach: The stock successfully broke out of the downtrend trendline.
- Massive Volume Confirmation: The breakout occurred on the back of huge trading volume , lending strong credibility to the move.
- Preceding Accumulation: Notably, trading volume has been steadily increasing over the past three days, indicating growing buyer interest leading up to the breakout.
This bullish price action is well-supported by technical indicators. Across the Monthly, Weekly, and Daily timeframes, the short-term Exponential Moving Averages (EMAs) are in a positive crossover, and the Relative Strength Index (RSI) is rising, confirming a build-up in positive momentum.
Outlook and Key Price Levels
The primary challenge now is for the stock to sustain this newfound momentum.
- Bullish Target: If the breakout holds with continued strong volume, the next logical resistance and potential target is the ₹400 level.
- Key Support: If this proves to be a false breakout and the price fails to hold above the trendline, a retreat to the support level around ₹260 is possible.
The immediate future is critical. Traders should now watch for follow-through buying or a successful retest of the broken trendline, which would now be expected to act as support, to confirm the validity of this breakout.

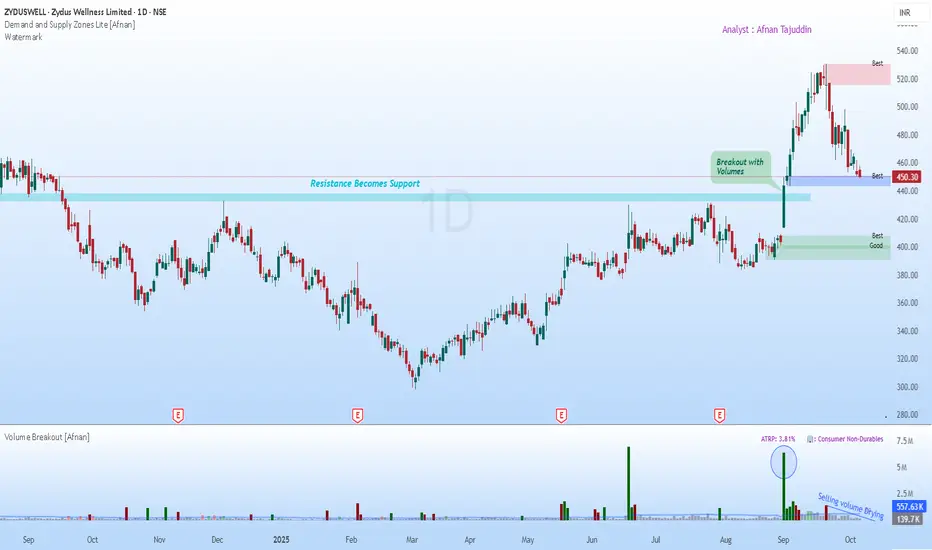
Powerful Setup & Art of the Pullback: Supply & Demand Concept📊 Supply & Demand View 📊
When you look closely, supply and demand zones are essentially the fingerprints of institutional activity. Big players rarely dump or buy entire positions in one shot—they stagger their trades, leaving behind identifiable imbalances on the charts. Every time price revisits these zones, it tends to react sharply.
Take Zydus Wellness as a clear example of this dynamic. After an impressive rally to a fresh all-time high, a predictable wave of profit-taking emerged, carving out a new supply zone at the top. This is the moment where sellers stepped in decisively, nudging prices down in a healthy correction. These zones aren’t just lines or boxes on a chart—they mark areas where significant buying or selling has historically occurred, often foreshadowing price reversals.
Now here’s where it gets interesting: price is at strong demand zone, And this isn’t just any support level—this is the very origin of the rally that shattered all previous resistance and propelled the stock to its highs. Areas like this tend to hold clusters of unfilled buy orders, meaning a return to this level often triggers a meaningful bounce as buyers re-enter the fray.
🚀 Classical Chart View 🚀
From a more traditional technical lens, the story remains bullish. The chart highlights a key resistance that had capped price for some time. When this level finally broke, it wasn’t subtle—volume spiked, signaling strong conviction from major market participants.
This is a textbook “resistance becomes support” scenario. The price is now retesting this old barrier. What makes this retest particularly noteworthy is the noticeable drop in selling volume during the pullback. This drying of volume suggests sellers are losing momentum, making it more likely that the pause is temporary rather than a reversal. The convergence of this retested resistance with a high-quality demand zone creates a compelling setup for the next move higher.
✨ Final Takeaway ✨
Both perspectives are telling a consistent story. Supply and demand analysis highlights a prime zone for buyers to re-engage, while classical technical confirm the strength of the underlying trend. The price has already found a foothold at the Best Quality Demand Zone, which could very well act as the springboard for the next leg of the rally. For anyone considering a position, a stop-loss below 430 provides a sensible buffer beneath this structural support.
💡 Risk Management Reminder 💡
Even the cleanest setups aren’t guarantees. Stick to your risk rules, size positions carefully, and maintain a disciplined stop-loss. Remember—the goal is to protect capital, not to perfectly predict the market.
“The art of trading is not about being right all the time, but about losing less when you are wrong.”
🔄 Patience and discipline win more often than bold predictions. 🔄
This analysis is for educational purposes only and should not be interpreted as trading advice. I’m not a SEBI-registered analyst.
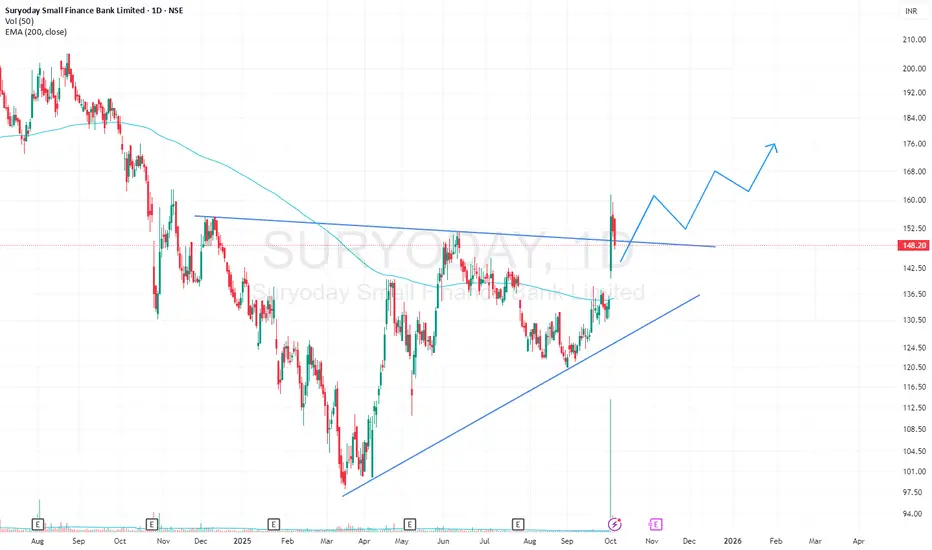
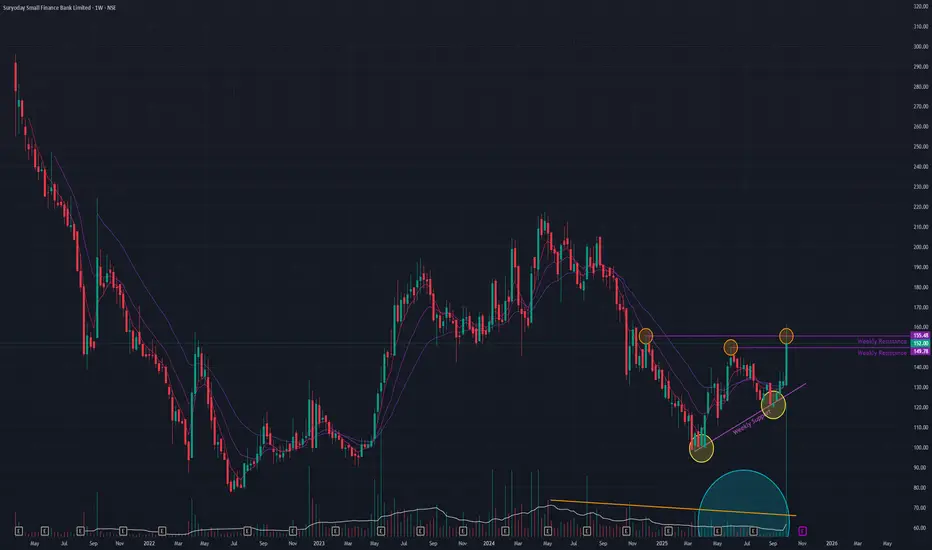
SURYODAY SFB Triangle BreakOutSuryoday SFB has given a breakout from a Triangle pattern with high volumes on 1D timeframe. The stock is apparently retesting its resistance trendline. The stock is also trading above its 200EMA.
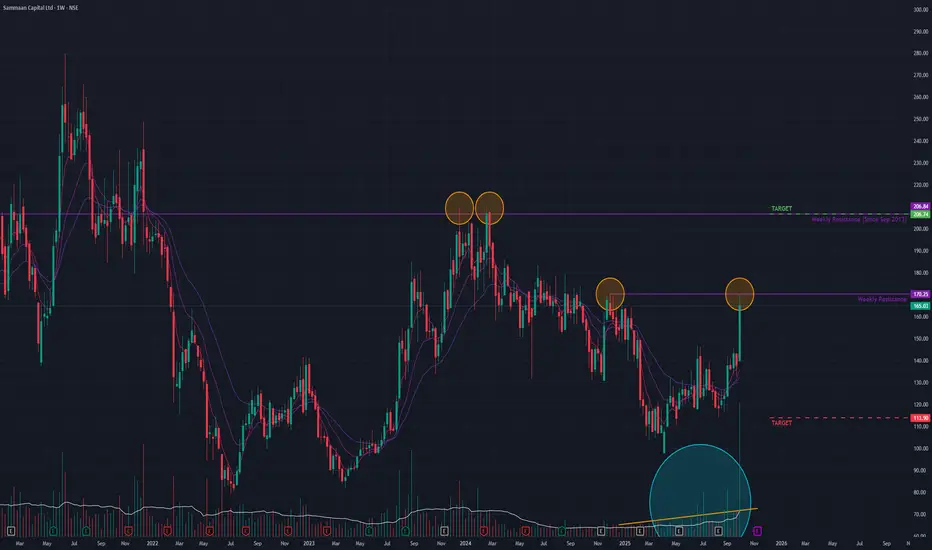
Sammaan Cap (W) - Poised for a Potential BreakoutAfter a prolonged downtrend that began in August 2018, Sammaan Capital transitioned into a sideways consolidation phase starting in March 2020.
Recently, the stock has shown significant bullish intent. Last week, it surged by +19.74% , accompanied by an exceptionally high volume spike of 462.74 million shares . This powerful move brought the price to the brink of breaking out from a key short-term resistance trendline.
Several technical indicators support a bullish outlook:
- Moving Averages: The short-term Exponential Moving Averages (EMAs) are in a state of positive crossover on both the monthly and weekly timeframes.
- Momentum: The Relative Strength Index (RSI) has also registered a positive crossover on both timeframes, signaling strong upward momentum.
- Volume: A steady increase in average volume suggests growing buyer interest.
Future Outlook:
The stock's direction hinges on its ability to overcome the immediate resistance.
- Bullish Scenario: If the current momentum is sustained and the stock achieves a decisive breakout with strong volume, the next potential target is the 205 level.
- Bearish Scenario: Conversely, a failure to breach this resistance could lead to a loss of momentum, potentially pulling the price back towards the 112 support level.
The price action in the coming week will be crucial in confirming the stock's next directional move.
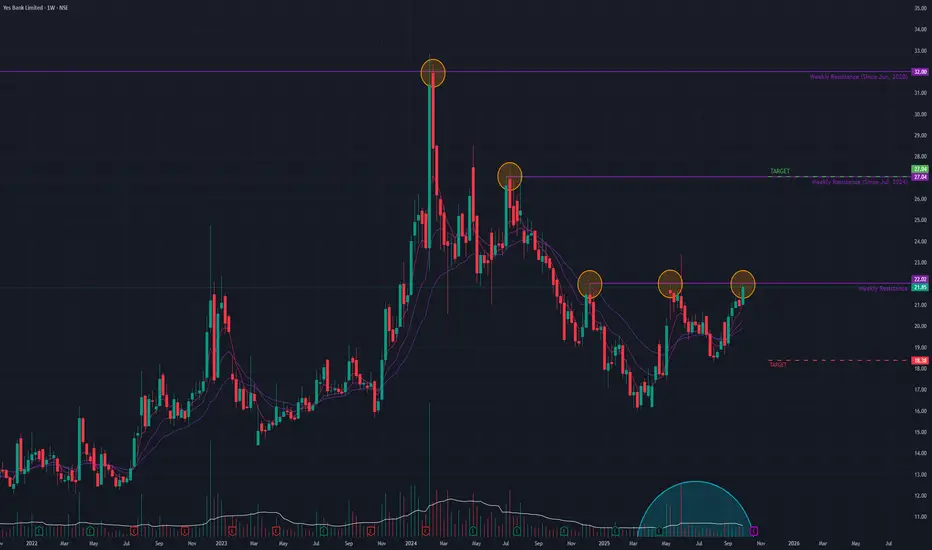
Yes Bank (W) - Challenges Key Resistance in Potential Trend RevYes Bank is showing signs of a potential trend reversal after being locked in a multi-year sideways consolidation since June 2020. Last week, the stock gained +4.2% on the back of a massive volume surge , indicating a significant increase in buyer interest.
The stock is now positioned directly below a critical horizontal resistance trendline . A decisive breakout above this level is required to confirm a shift from its long-term consolidation phase into a new uptrend.
Strong Long-Term Bullish Signals 👍
The potential for a reversal is supported by positive signals on higher timeframes:
- Monthly & Weekly Momentum: Short-term Exponential Moving Averages (EMAs) are in a bullish crossover state on both the monthly and weekly charts.
- Confirmed Strength: The Relative Strength Index (RSI) is also rising on both the monthly and weekly timeframes, confirming strong underlying momentum.
Outlook: A Breakout Awaits
The stock is at a crucial make-or-break point. While the long-term indicators are bullish, overcoming the overhead resistance is essential.
- Bullish Case 📈: If the current momentum is sustained and the stock achieves a decisive breakout, the next potential target is the ₹27 level.
- Bearish Case 📉: If the resistance holds and the momentum fades, the stock could pull back to find support near the ₹18 level.
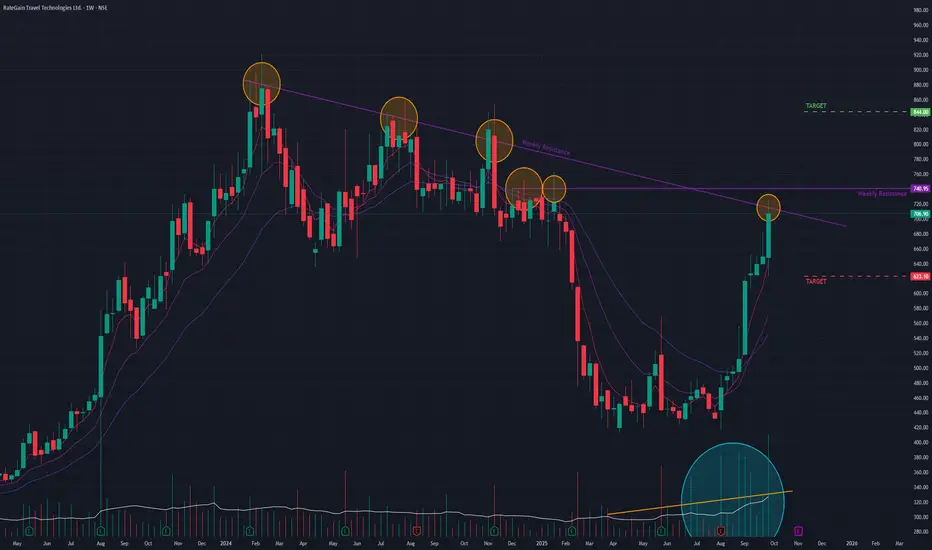
Rategain (W) - Challenges Major Resistance After Parabolic RallyFollowing a powerful trend reversal that began in August 2025, RateGain has surged over 70% and is now confronting a major confluence of resistance. The stock is simultaneously testing a long-term angular resistance trendline and a key horizontal resistance level .
This critical test comes after a prolonged downtrend that was in place since February 2024, positioning the stock at a crucial make-or-break point.
Strong Bullish Undertone 👍
The rally is supported by a host of positive technical indicators, suggesting strong underlying momentum leading into this resistance zone:
- Rising Volume: There has been a consistent increase in trading volume , indicating growing and sustained buyer interest.
- Positive Momentum: Short-term Exponential Moving Averages (EMAs) are in a bullish crossover state.
- Confirmed Strength: The Relative Strength Index (RSI) is also rising, confirming the bullish momentum.
Outlook: A Breakout Awaits Confirmation
The stock's ability to overcome this dual resistance will be the key determinant of its future trend.
- Bullish Case 📈: A decisive and high-volume breakout above both resistance levels in the coming week could trigger the next leg of the rally, with a potential price target of ₹845 .
- Bearish Case 📉: If the resistance holds and momentum fails to carry the stock through, a pullback towards the support level of ₹623 is possible.
Suryoday (W) - Shows Reversal Signs but Halts at Key ResistanceSuryoday Small Finance Bank is showing signs of a potential trend reversal, marked by the recent formation of Higher Lows . Last week, the stock made a significant move, surging +14.38% on massive volume. During this session, it broke through two minor resistances but ultimately closed below a critical long-term resistance level .
This price action indicates a powerful attempt by buyers that was met with significant selling pressure at a key technical barrier.
Conflicting Technical Signals
The current technical landscape presents a mixed picture, highlighting the uncertainty at this juncture:
Bullish Signs 👍:
- Weekly Momentum: On the weekly timeframe, both the short-term Exponential Moving Averages (EMAs) and the Relative Strength Index (RSI) are in a bullish crossover state.
Bearish Signs 📉:
- Declining Volume: The overall trading volume has been drying up , which typically signals a lack of conviction from buyers, despite last week's volume spike.
Outlook: A Decisive Week Ahead
The stock is at a critical inflection point. The powerful surge last week shows bullish intent, but the failure to close above resistance and the low overall volume are causes for caution. The price action in the upcoming week will be crucial in determining whether the stock has the strength to finally break through resistance or if it will be rejected again.
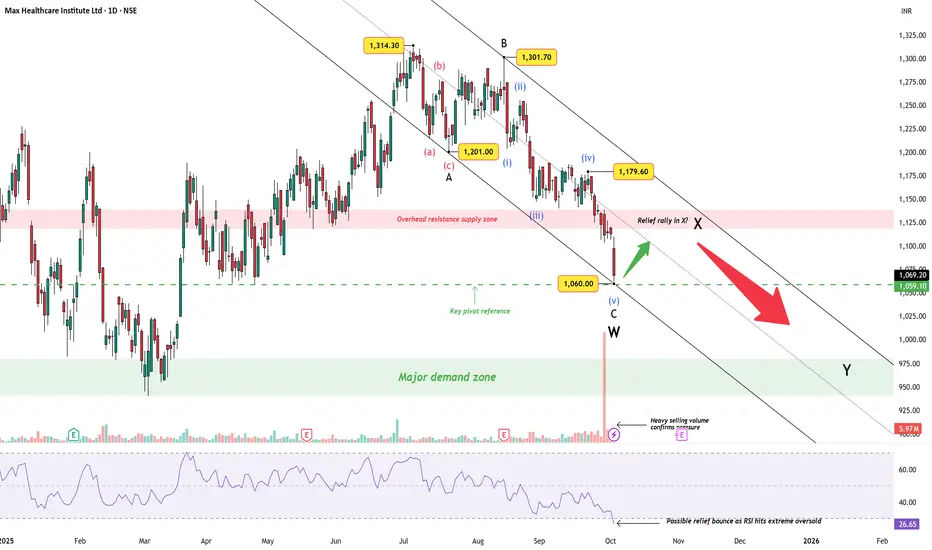
Max Healthcare – Impressive Earnings, Fragile TechnicalsMax Healthcare Institute shares have slid sharply, closing near ₹1,069 with heavy selling volume. On the Elliott Wave front, price appears to have completed Wave W at 1,060 after a clean five-wave decline. With RSI deeply oversold, a relief rally in Wave X could unfold, but the larger structure still favors another leg down into Wave Y , with the major demand zone around 980–940 in focus.
The overhead resistance supply zone near 1,120–1,140 remains the key cap for any bounce. Unless price reclaims this zone with strength, the downward bias prevails.
What makes this interesting is the fundamental backdrop :
Revenue grew from ₹1,542 crore in June 2024 to ₹2,027 crore in June 2025.
Net profit held steady above ₹300 crore in the latest quarter.
Annual revenue surged from ₹2,504 crore in 2021 to ₹7,028 crore in 2025, with net profit crossing ₹1,075 crore.
Despite these strong numbers, technicals are hinting at caution — proving that even fundamentally solid stocks can correct when sentiment turns.
Bias: Short, unless Wave X reclaims supply convincingly.
Disclaimer: This analysis is for educational purposes only and does not constitute investment advice. Please do your own research (DYOR) before making any trading decisions.
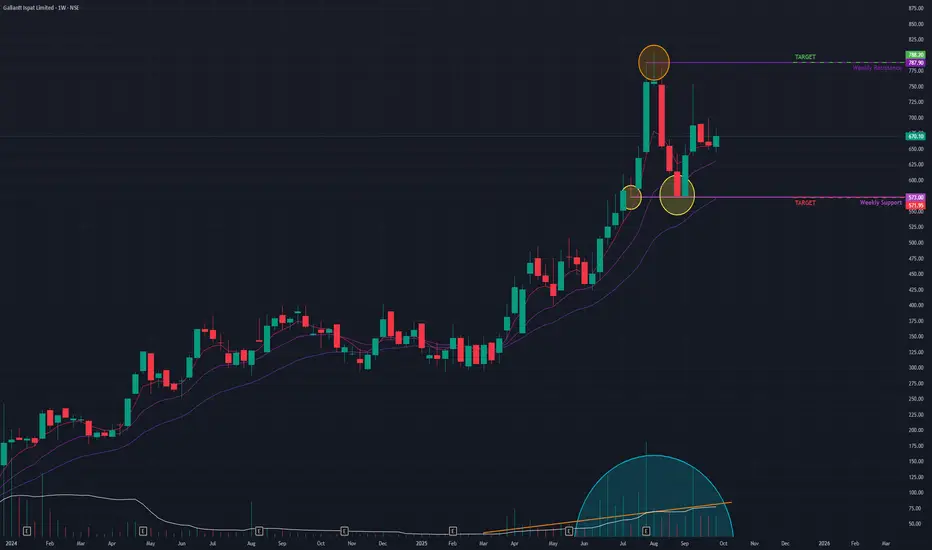
Gallant Isp (W) - Consolidates in Bullish Pattern After New ATHFollowing a powerful and sustained uptrend since May 2023, Gallantt Ispat Ltd. reached a new All-Time High (ATH) in August 2025. For the past few weeks, the stock has entered a healthy sideways consolidation phase . This type of consolidation after a strong rally is often a bullish continuation pattern, suggesting the primary uptrend is likely to resume.
Strong Underlying Bullish Indicators 👍
The positive long-term outlook is reinforced by several strong technical signals on higher timeframes:
- Sustained Volume: The average trading volume has been increasing , indicating growing and sustained interest in the stock.
- Long-Term Momentum: Short-term Exponential Moving Averages (EMAs) are in a bullish crossover state on both the monthly and weekly charts.
- Confirmed Strength: The Relative Strength Index (RSI) is also rising on both the monthly and weekly timeframes, confirming strong underlying momentum.
Outlook and Key Price Levels
The price action in the coming weeks will be crucial to determine the next move out of this consolidation.
- Short-Term Range: In the immediate term, the stock could fluctuate between a potential upside target of ₹780 and a downside support level of ₹570 .
- Long-Term Potential 📈: If the bullish momentum resumes and the stock breaks out of the current consolidation, a longer-term price target of ₹1,000 could be achievable.
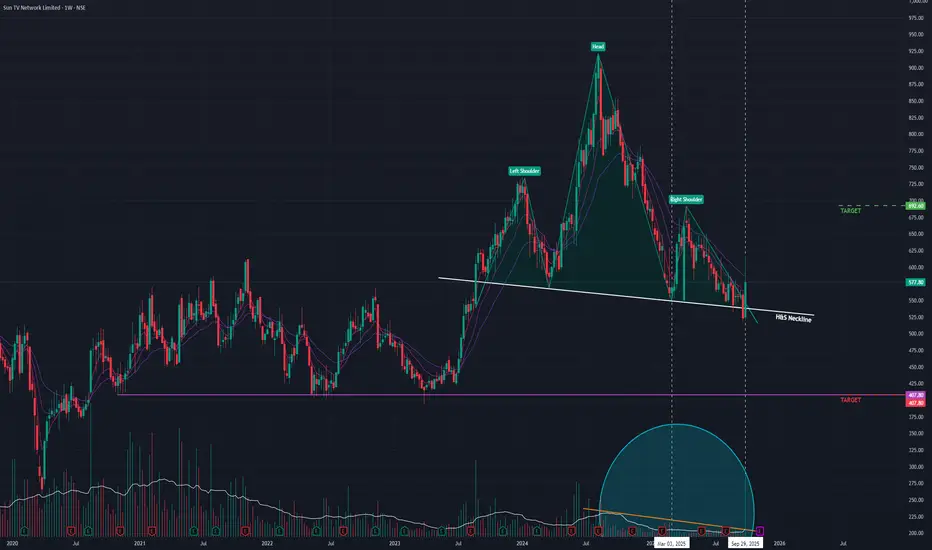
Sun TV (W) - Forms a Bearish Head & Shoulders PatternSun TV has formed a classic Head and Shoulders pattern , a well-known technical formation that typically signals a bearish trend reversal. The stock is currently trading near the critical "neckline" support of this pattern. A decisive break below this level would confirm the pattern and could signal the start of a significant downtrend.
Supporting Bearish Indicators 📉
The bearish outlook is further supported by volume trends:
- Declining Volume: The average trading volume has been decreasing, which generally indicates a lack of buying interest and conviction in the current price levels. While there have been occasional volume spikes, the overall trend is weak.
Outlook and Key Levels
The price action in the coming weeks will be crucial. The key event to watch for is a breakdown below the pattern's neckline.
- Bearish Case: A confirmed breakdown below the neckline would validate the Head and Shoulders pattern. In this scenario, the stock could enter a bearish phase with a potential downside price target near the ₹407 level.
- Bullish Reversal: Conversely, if the neckline holds as strong support and the stock reverses its current trajectory, a move back towards the ₹692 resistance level could be possible.
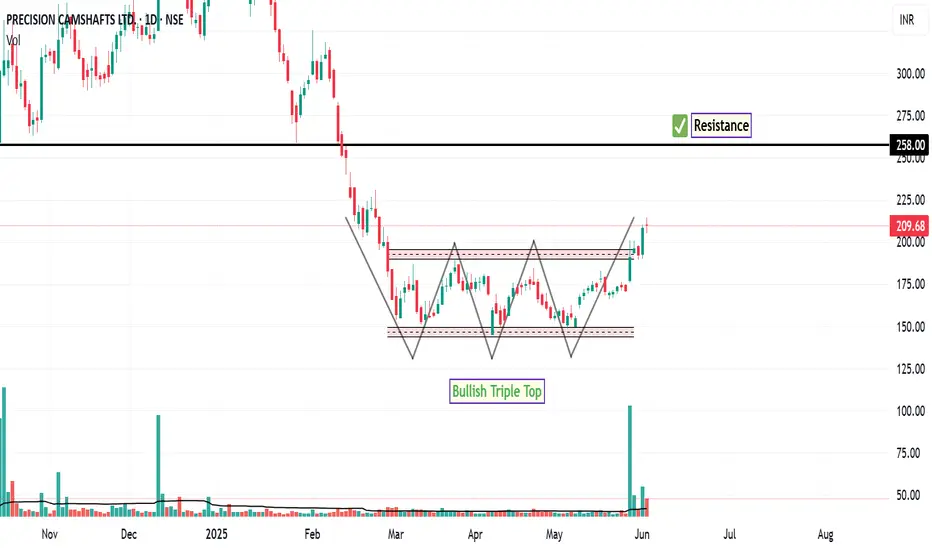
PRECAM: Next Level InsightThe daily chart of PRECAM is currently displaying a technically constructive setup. Notably, the price structure resembles a bullish triple top formation, which, in this context, appears to be acting as a continuation pattern rather than a reversal. This is further supported by a breakout above the recent consolidation range.
Importantly, this breakout has been accompanied by a noticeable increase in trading volume over the past five sessions, which may suggest growing market participation and interest in the stock at current levels.
Key technical indicators are aligned with this bullish momentum:
RSI is trading above the 70 mark , indicating strong upward momentum.
MACD is positioned above the zero line , with the signal line maintaining a positive crossover.
MACD Histogram remains in positive territory, reinforcing the prevailing bullish sentiment.
Based on this setup, the next potential area of price interest or resistance could emerge near the ₹258 level. On the downside, the immediate support lies just below the prior consolidation zone near ₹145 . A sustained move below this level could act as a technical invalidation point for short-term bullish setups and may prompt risk management actions.
Disclaimer:
This analysis is intended solely for informational and educational purposes. It does not constitute investment advice, a recommendation, or an offer to buy or sell any financial instrument. All investments carry risk, and past performance is not indicative of future results. Individuals should conduct their own due diligence or consult with a qualified financial advisor before making any investment decisions.
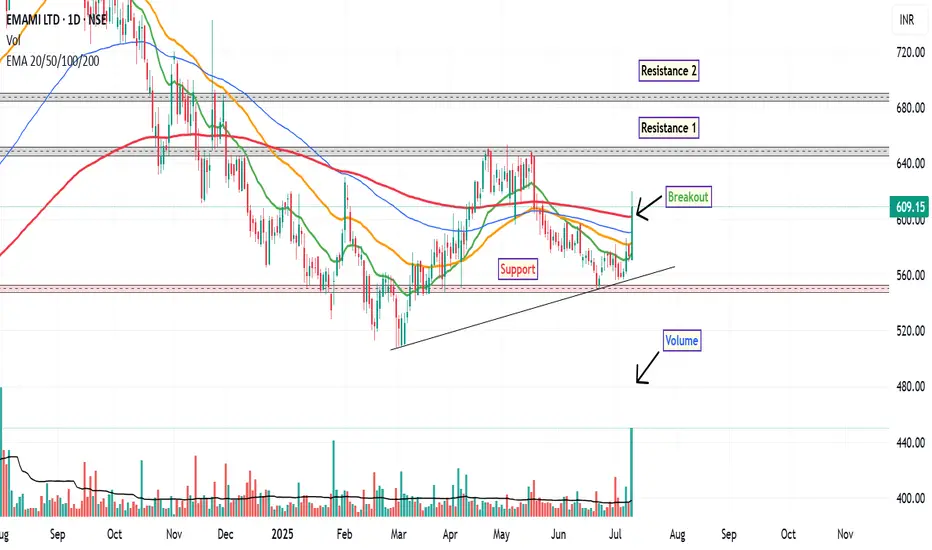
EMAMI: Technical Outlook UpdateFollowing a prolonged downtrend that began in September 2024, EMAMI Ltd. has recently exhibited signs of a potential short-term trend reversal on the daily chart. The stock has demonstrated a notable uptick in momentum, marked by several key technical developments.
The stock has decisively moved above its 200-day EMA, a level often regarded as a long-term trend indicator. This breakout was accompanied by a significant increase in trading volume—approximately 5 times the average volume of the 50-day moving average, suggesting heightened market participation. The RSI has crossed above the 60 level, indicating strengthening bullish momentum, though it is approaching the overbought zone.
A bullish crossover in the MACD was observed, further supporting the case for near-term strength.
Around ₹600, where the stock is currently consolidating post-breakout. First resistance near ₹650, Second resistance around ₹690. A technical stop-loss could be considered below ₹548, aligning with recent swing lows and support levels.
Disclaimer: This analysis is intended solely for educational and informational purposes. It does not constitute investment advice or a recommendation to buy or sell any financial instrument. Market participants are encouraged to conduct their own research or consult with a qualified financial advisor before making any trading decisions.