SBI (Weekly) - Breakout of sideways trendState Bank of India (SBI) has shown a significant bullish development this week, decisively breaking out of a key angular resistance trendline that has been in place since July 2024. This breakout, which follows a prolonged consolidation phase after its All-Time High in June 2024, was confirmed by a strong +4.71% price increase on the back of massive trading volume.
Confirmation from Multiple Indicators 👍
The positive outlook is strongly supported by several technical signals, suggesting a high degree of conviction in the recent move:
- Volume Surge: The breakout was accompanied by exceptionally high volume , indicating significant buying interest. The general trend of rising volume further validates the move.
- Momentum Indicators: Both the short-term Exponential Moving Averages (EMAs) and the Relative Strength Index (RSI) have entered a state of positive crossover, providing dual confirmation of building bullish momentum.
Outlook
Given the strength of the breakout and the confluence of bullish indicators, the path of least resistance appears to be upward. However, monitoring the price action in the upcoming week will be crucial to confirm that this breakout is sustained and not a false move.
Volume

InoxGreen (Weekly) - Major Breakout, Potential New UptrendInox Green Energy has shown significant bullish strength, breaking out of a key long-term horizontal resistance trendline last week. This crucial move was powered by a substantial +13.61% price surge and supported by decent trading volume, signaling a potential continuation of its upward trajectory.
This breakout follows a period of sideways consolidation that began in May 2025. The prior resistance had capped the stock's progress after its trend reversed in April 2025, following a downtrend from its All-Time High in September 2024.
Bullish Confirmation Signals 👍
The positive outlook is reinforced by key technical developments:
- Breakout Volume: The price surge was accompanied by **healthy volume**, indicating conviction behind the move.
- Momentum: Short-term Exponential Moving Averages (EMAs) also completed a positive crossover this week, a strong indicator of building upward momentum.
Future Outlook and Key Levels
The price action in the coming week will be critical for confirming the breakout's sustainability.
- Bullish Case 📈: If the upward momentum continues with strong volume, the stock could be on track to reach the next potential resistance level at ₹224 .
- Bearish Case 📉: However, if the stock fails to sustain the breakout momentum, it could pull back to find support near the ₹149 level.

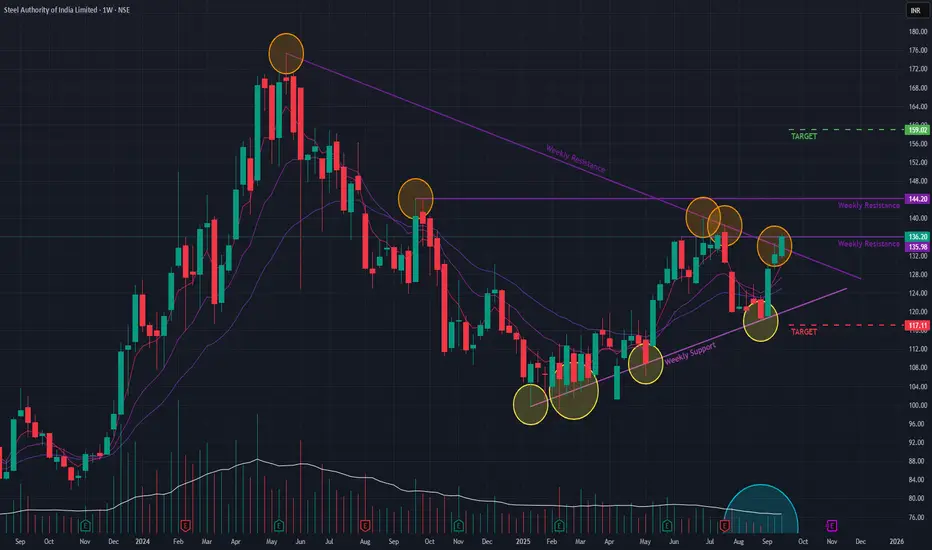
SAIL (Weekly) - Can it SAIL past the resistances ?SAIL is showing signs of a potential turnaround after a prolonged downtrend that began in May 2024. This week, the stock executed a significant breakout from a long-term angular resistance trendline , a move accompanied by a healthy increase in volume and a price surge of +2.98% .
This bullish development follows a period of consolidation that began after the downtrend reversed in January 2025. The stock is now testing a key short-term resistance level.
Bullish Indicators to Note 👍
The positive outlook is supported by the following technical signals:
- Breakout Confirmation: The move through the long-term trendline was validated by a notable increase in trading volume , indicating strong buyer participation.
- Momentum: Short-term Exponential Moving Averages (EMAs) are in a positive crossover , signaling building upward momentum.
Immediate Hurdles Ahead 🚧
Despite the positive momentum, a sustained rally depends on the stock's ability to overcome two significant upcoming resistance levels . The price action in the upcoming week will be crucial to watch for confirmation of the breakout's strength.
Future Outlook and Key Levels
- Bullish Case 📈: If the stock successfully breaks through the immediate resistances and the upward momentum continues, the next potential price target is ₹159 .
- Bearish Case 📉: However, if the stock fails to clear these hurdles and momentum wanes, a pullback towards the support level of ₹117 is possible.
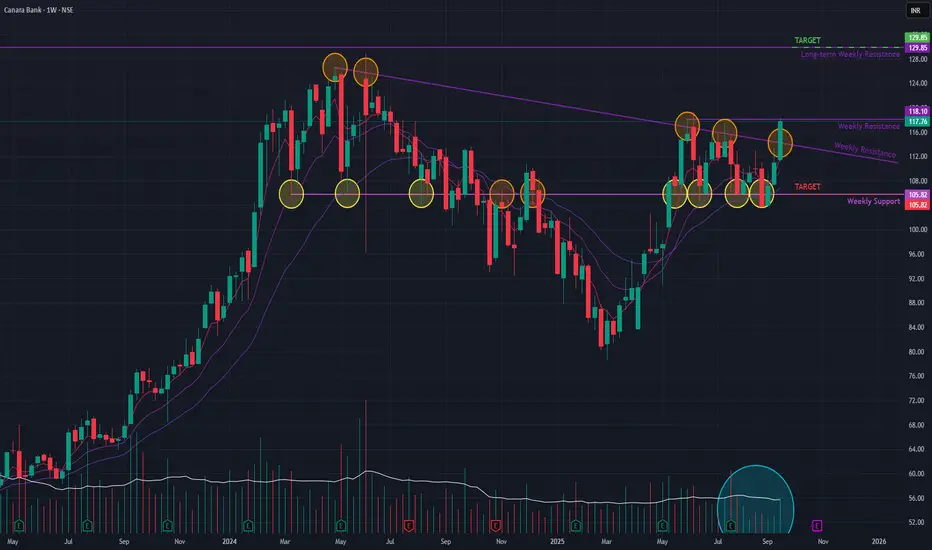
Canara Bank (Weekly) - Will it BreakOut of sideways trend??Canara Bank has demonstrated a significant bullish development this week, breaking out of a key angular resistance trendline . This move was validated by a strong increase in trading volume and a notable +6.13% price surge , signaling renewed buyer interest.
This breakout occurs after a period of sideways consolidation that has been in place since May 2025. This consolidation phase followed a corrective downtrend that lasted from June 2024 to March 2025, which itself came after a multi-year rally that began in October 2020.
Bullish Indicators Supporting the Move 👍
Several technical factors support a positive outlook:
- Volume Confirmation: The breakout was accompanied by a healthy surge in trading volume , indicating strong conviction behind the move.
- Momentum: Short-term Exponential Moving Averages (EMAs) have entered a positive crossover , a classic signal of building upward momentum.
The Immediate Hurdle Ahead 🚧
Despite the positive signs, the stock is currently trading just below a short-term resistance level . A decisive move above this immediate barrier is required to confirm the continuation of the uptrend.
Future Outlook and Key Levels
The price action in the upcoming week will be crucial. Two primary scenarios exist:
- Bullish Case 📈: If the stock successfully breaks and holds above the current short-term resistance, the path could be clear for a rally towards the next major resistance zone at ₹129 .
- Bearish Case 📉: If the upward momentum fails and the stock is rejected at this resistance, it could pull back towards the support level of ₹105 .
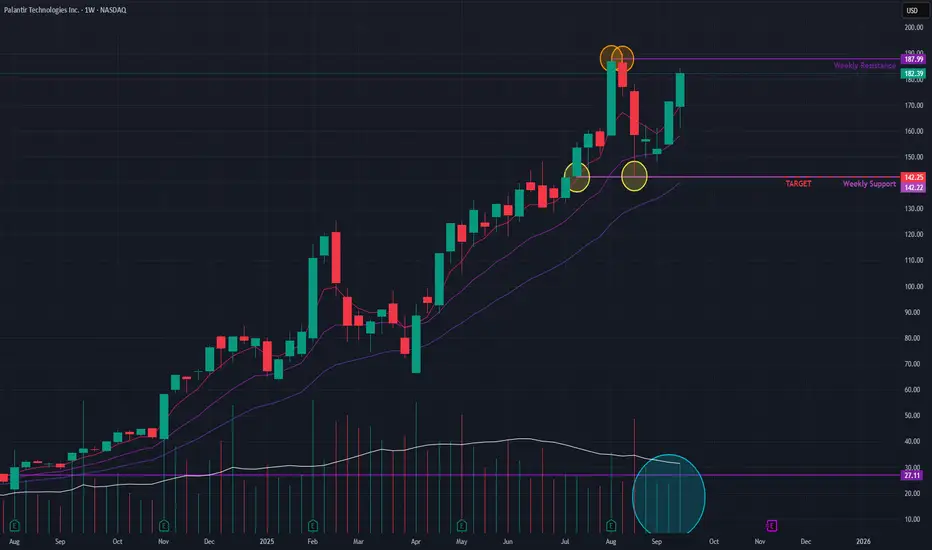
Palantir (Weekly) - Consolidation Near All-Time HighAfter reaching a new All-Time High (ATH) in recent weeks, Palantir has entered a period of consolidation. The stock has since been trading in a sideways range, struggling to break past the newly established resistance level.
Emerging Bullish Signals 👍
Despite the sideways movement, several indicators suggest that buyers are showing renewed interest:
- Momentum: Short-term Exponential Moving Averages (EMAs) have formed a positive crossover , a technical signal indicating that upward momentum is building.
- Volume: Trading volume has been noticeably increasing , which suggests growing accumulation and buyer interest at the current price levels.
Future Outlook and Key Price Levels
The stock is currently positioned for a potential move, with two clear scenarios:
- Bullish Case 📈: A decisive breakout above the short-term horizontal resistance would signal a continuation of the uptrend. If this occurs, the next potential price target could be USD 234 .
- Bearish Case 📉: If the stock fails to overcome the resistance and momentum fades, it may decline to the lower boundary of its consolidation range, with a potential support level near USD 142 .
Watchout for the next moves !!
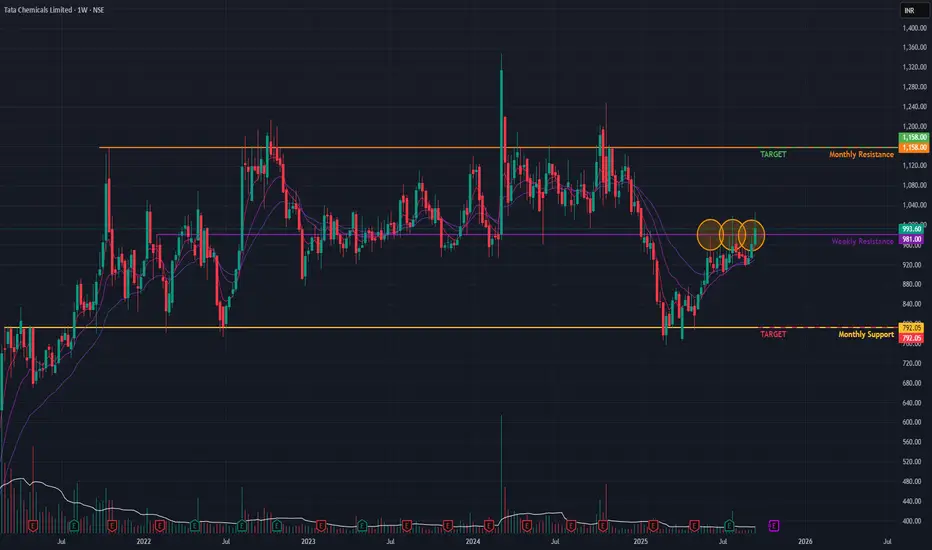
TATA Chemicals (Weekly) - Can it Breakout ??TATA Chemicals has been in a prolonged period of consolidation , trading within a well-defined range since August 2021. The stock has made several attempts to break out of this zone but has so far been unsuccessful.
The Key Battleground: A Major Resistance Level 🚧
The primary hurdle for the stock is a long-term horizontal resistance line that has been in effect since January 2022. This level has been repeatedly tested, and each breakout attempt has failed, confirming it as a significant barrier.
Conflicting Technical Signals 📊
The technical indicators across different timeframes present a mixed picture:
- Weekly Chart: Short-term Exponential Moving Averages (EMAs) are in a positive crossover state , suggesting building upward momentum. However, a confirming SMA Golden Crossover has not yet occurred.
- Monthly Chart: On the higher timeframe, a long-term SMA Golden Crossover remains active , providing a bullish backdrop for the bigger picture.
Future Outlook and Potential Scenarios
- Bullish Case 📈 : A decisive breakout above the resistance zone , supported by high volume, would be a strong bullish signal. If this upward momentum is sustained, the stock could rally towards the ₹1,158 level.
- Bearish Case 📉: If the stock fails to breach the resistance again, it is likely to fall back towards the lower end of its trading range, with a potential downside target near the ₹792 support level.
Let's watchout for next week's price-action
JSWSTEEL TRENDLINE BREAKOUTJSWsteel breaking trendline resistance weekly basis
good volume last few weeks
bullish RSI above 60
trading at al time high
can reach to target 1250 soon
NO BUY/SELL RECOMENDATION

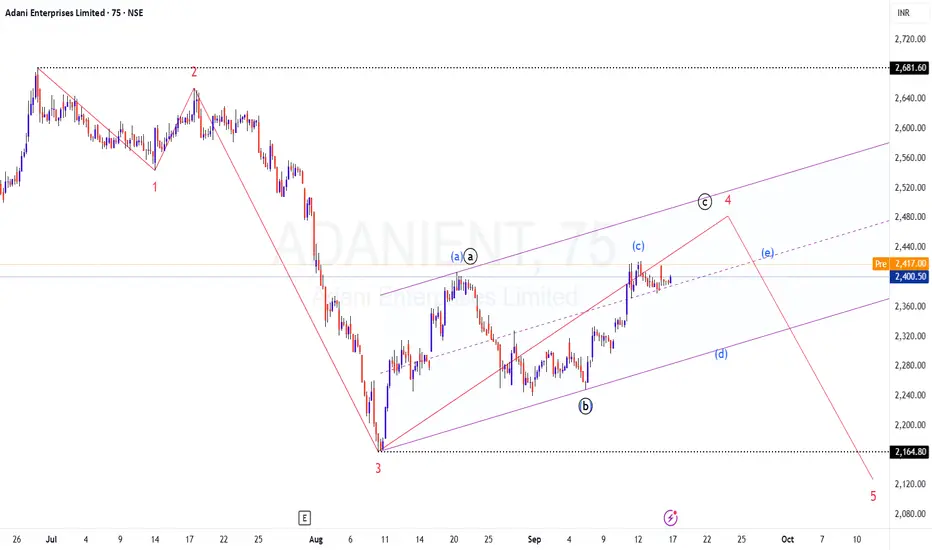
ADANIENT - One more Leg down is due?
TF: 75 Minutes
CMP: 2400
The counts are from the recent swings 2681 to 2165
Observation: It is a 5 wave decline and the 3rd wave has ended at 2165..
The price is now following a corrective rise.
The corrective rise can take any form.. Here, I have marked 2 possibilities.
ABC or triangle (abcde)
If this is an ABC correction, then, we have completed A and B, the Final C is play targeting 2490 (100% fib extension (AB=BC). Since the price is also staying above the midpoint of the channel, I am inclined towards this view as my primary count.
If this is a triangle, then, we are looking at sideways consolidation again ranging between 2300 to 2400 to complete the set up
Since I am expecting a final leg down for the 5th, I am not participating in this current corrective rise..
Will wait for clear direction/swing points first.
In the volume Profile chart
We are trading inside the heave volume zone of last week and the week of 18th Aug. The important zones are marked for easy inference. For now, strong base is at 2270-2300
Disclaimer: I am not a SEBI registered Analyst and this is not a trading advise. Views are personal and for educational purpose only. Please consult your Financial Advisor for any investment decisions. Please consider my views only to get a different perspective (FOR or AGAINST your views). Please don't trade FNO based on my views. If you like my analysis and learnt something from it, please give a BOOST. Feel free to express your thoughts and questions in the comments section.
Heritage Foods (Daily) - Will the Bullish momentum continue ?Heritage Foods executed a powerful bullish move today, surging by +8.08% on the back of exceptionally high trading volume. The stock successfully breached two critical resistance levels, signaling a potential shift in trend.
The most significant of these was the breakout from a long-term horizontal resistance trendline , a barrier that has been in place for a considerable period. Additionally, it cleared a more recent short-term horizontal resistance .
Confirmation Signals 👍
The bullish outlook is supported by key technical indicators:
- Massive Volume: The breakout was accompanied by a huge surge in trading volume , indicating strong conviction from buyers and validating the move.
- Positive Momentum: Short-term Exponential Moving Averages (EMAs) are in a positive crossover state , which further confirms the building upward momentum.
Future Outlook and Scenarios
- Upside Potential 📈: If the breakout is sustained and the bullish momentum continues, the stock could be headed towards the next price target of ₹593 .
- Downside Risk 📉: Conversely, if the breakout fails to hold and the momentum reverses, the stock may pull back to find support near the ₹457 level.
Keep an eye on the price-action !!

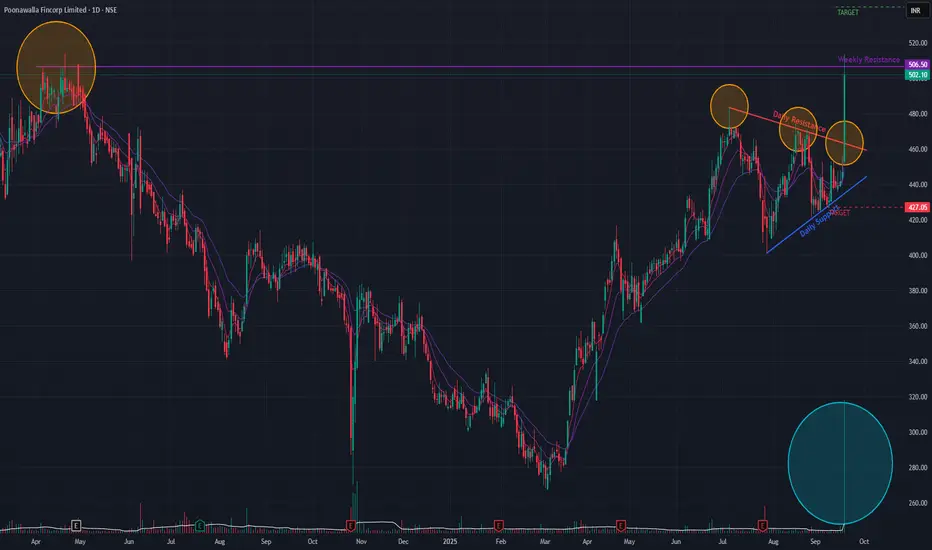
Poonawalla Fincorp (Daily) - Potential ATH ?Poonawalla Fincorp has shown a significant bullish development, decisively breaking out of a Triangle continuation pattern today. This breakout was marked by a substantial 12.30% surge in price , backed by exceptionally high trading volume.
This move signals a potential continuation of the bullish run that began in March 2025, which itself was a reversal of a downtrend initiated by a Double-Top bearish pattern in April 2024.
Bullish Confirmation Signals 👍
The positive outlook is supported by several key indicators:
- Breakout Volume: The price surge was accompanied by a massive spike in volume , indicating strong conviction and participation from buyers.
- Momentum: Short-term Exponential Moving Averages (EMAs) have formed a positive crossover , confirming the renewed bullish momentum in the immediate term.
Immediate Hurdle Ahead 🚧
Despite the strong breakout, the stock is now trading at a crucial long-term resistance level . Overcoming this barrier is essential for the upward trend to continue.
Future Outlook and Scenarios
- Bullish Case 📈: If the upward momentum is sustained and the stock successfully breaks through the current long-term resistance, it could clear the path to test its all-time high . An initial price target in this scenario would be the ₹539 level.
- Bearish Case 📉: Conversely, if the stock fails to breach this resistance, the momentum could fade, potentially leading to a price correction towards the ₹427 support level.
Watchout for the price-action in the next few sessions !!
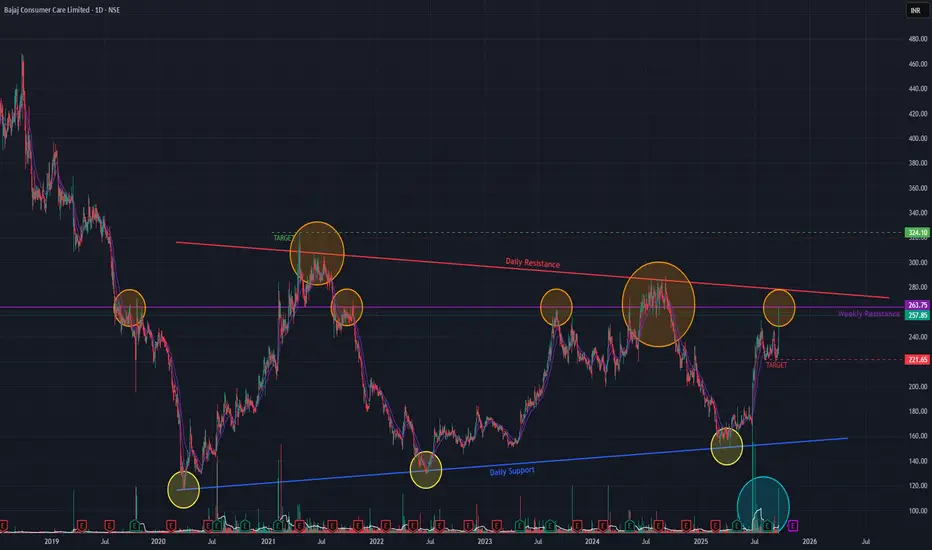
Bajaj Consumer (Daily) - Potential BreakoutBajaj Consumer Care is at a critical juncture following a prolonged downtrend from its January 2018 all-time high and a subsequent sideways consolidation period since March 2020. The stock recently demonstrated significant buying interest with an 8.59% surge on a high-volume spike.
Bullish Indicators 👍
Several technical signals support a positive outlook:
- Momentum: Short-term Exponential Moving Averages (EMAs) are in a positive crossover state, indicating strong upward momentum.
- Volume: Trading volume has been consistently above average for several months, suggesting sustained accumulation by buyers.
- Long-Term Trend: The weekly timeframe now shows a Simple Moving Average (SMA) Golden Crossover, reinforcing the potential for a long-term trend reversal.
Key Resistance Levels 🚧
Despite the bullish signals, the stock faces two significant hurdles:
1. A major horizontal resistance line that has been in place since January 2013.
2. A more recent descending resistance trendline formed since April 2021.
Future Outlook and Scenarios
- Bullish Case 📈: A decisive breakout above both the horizontal and angular resistance levels would be a strong confirmation of bullish momentum. This could propel the stock towards a potential price target of ₹324.
- Bearish Case 📉: If the stock fails to sustain its upward momentum and break these key resistance levels, it may retrace back towards the ₹221 support level.
Keep monitoring !!
Supreme Ind (Daily) - Approaching Critical Res ConfluenceAfter a significant uptrend that concluded in June 2024, Supreme Industries entered a corrective downtrend lasting until April 2025. Since then, the stock has shown signs of a bullish reversal by establishing a pattern of higher lows , indicating that buyers are stepping in at progressively higher prices.
The Resistance Zone
Currently, the stock is approaching a major technical hurdle: a confluence of resistance . This is created by the intersection of a long-term downward-sloping (angular) trendline and a key horizontal resistance level. Multiple recent attempts to breach this zone, though unsuccessful, signal persistent buying interest and a buildup of pressure.
Indicator Analysis
Positive Signs: Trading volume has been healthy in recent sessions. Furthermore, the short-term Exponential Moving Averages (EMAs) have registered a bullish crossover , confirming positive short-term momentum.
Cautionary Signs: A long-term Golden Crossover (50-day SMA crossing above the 200-day SMA) has not yet occurred. This more significant signal would be needed to confirm a durable, long-term trend reversal.
Future Outlook & Key Levels
The future direction depends on the stock's ability to resolve the battle at the current resistance confluence.
Bullish Scenario: A decisive breakout and close above both trendlines would be a strong bullish signal. If this occurs, the stock could rally towards the next target of ₹5,060.
Bearish Scenario: If the resistance holds and the upward momentum fades, the stock could pull back to test its support level near ₹4,251.
Keep monitoring !!

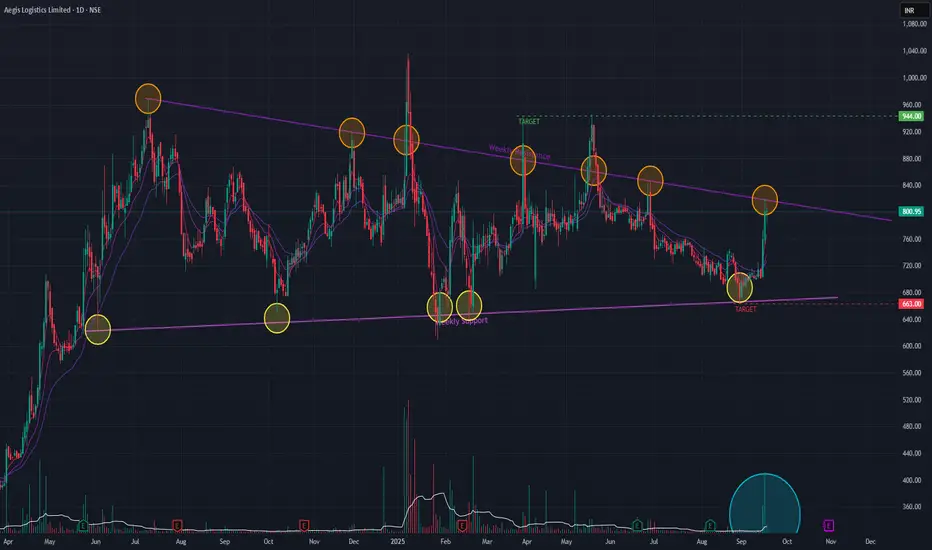
Aegis Logistics (Daily Timeframe) - Potential Breakout ??Following a strong uptrend that peaked in July 2024, Aegis Logistics entered a multi-month consolidation phase. Despite marking a new all-time high in January 2025, the stock lacked sustained upward momentum and has since formed a clear Symmetrical Triangle pattern . This pattern typically acts as a continuation signal, suggesting the prior uptrend is likely to resume.
Recent Bullish Momentum
This week, the stock has shown a significant surge in buying interest, rallying +14.05% on the back of very high trading volume. This powerful move towards the triangle's upper boundary indicates strengthening bullish sentiment and a potential impending breakout.
Indicator Analysis
On the daily chart, short-term Exponential Moving Averages (EMAs) have already registered a bullish crossover , confirming the immediate positive momentum. While the weekly EMAs are yet to confirm a similar crossover, they are aligning positively, suggesting a longer-term bullish signal may be forming.
Future Outlook & Key Levels
The direction of the next major move hinges on the resolution of this triangle pattern.
Bullish Scenario: A decisive breakout and close above the triangle's upper trendline would confirm the pattern's continuation. The primary upside target in this case is ₹944 .
Bearish Scenario: If the stock fails to break out and instead breaches the lower trendline of the triangle, the bullish thesis would be invalidated. The key support level to watch on the downside would be ₹663 .
Watchout for the Price-action !!
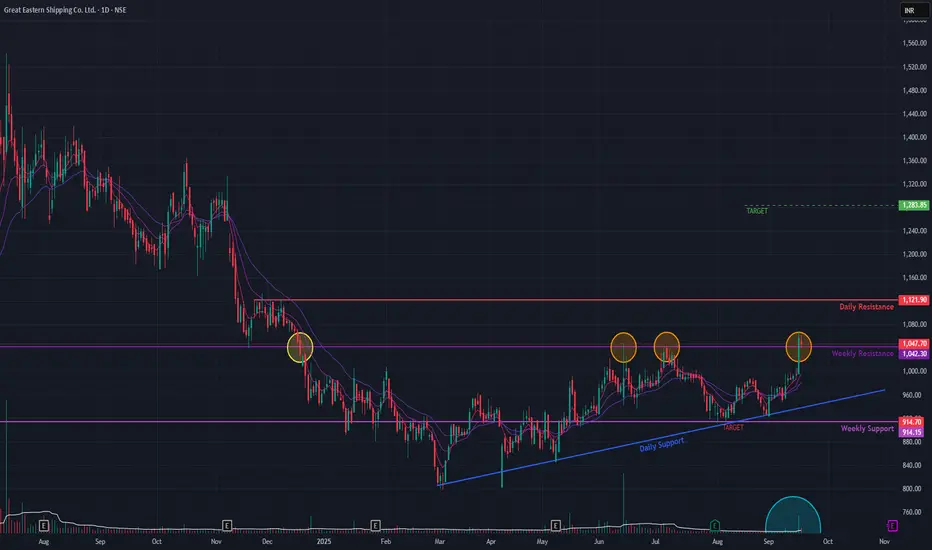
GE Shipping (Daily Timeframe) - Potential Breakout ??GE Shipping has broken out from a critical, long-term resistance level originating from December 2023. The stock is showing strong bullish momentum, confirmed by multiple technical signals.
Key Observations:
Pattern: A double-bottom in April 2025 ended the prior downtrend, leading to a period of consolidation.
Breakout: On Sep 16, 2025, the stock decisively broke above the resistance on high volume.
Confirmation: The breakout was confirmed on Sep 17, as the old resistance successfully held as new support.
Indicators: Bullish EMA crossovers and sustained above-average volume support the move.
Price Outlook :
Upside Target: ₹1283 if the price remains above the breakout level.
Downside Risk: A failure to hold this new support could lead to a decline towards the ₹914 level.
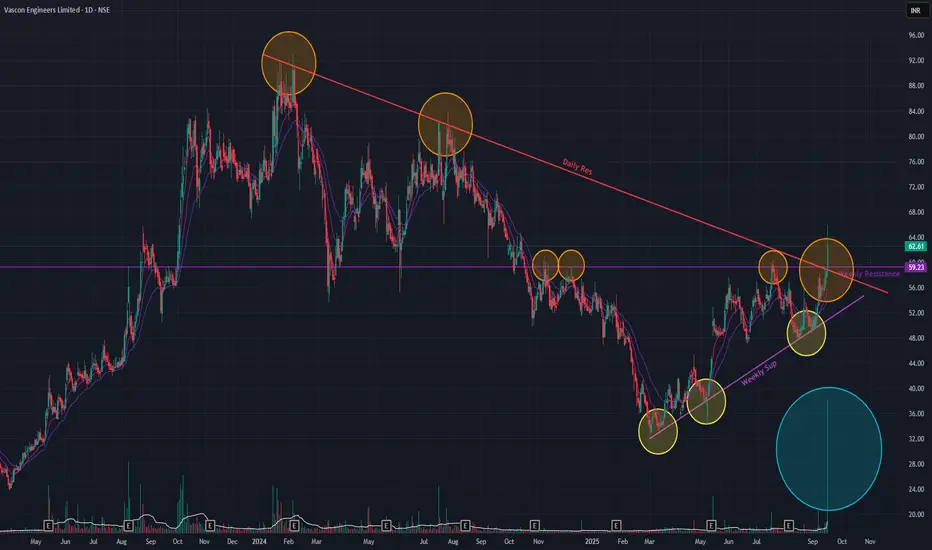
Vascon Eng (Daily Timeframe) - Is this the trend reversal ?Vascon is showing strong indications of a major trend reversal. After forming a series of higher lows since March 2025, the stock has now broken out of a clear Inverted Head & Shoulder pattern on the weekly timeframe.
The breakout is particularly significant as it occurred at a confluence of two major resistance zones: a long-term horizontal trendline dating back to February 2012 and the more recent descending trendline from January 2024. This bullish move was accompanied by a +7.06% surge on high volume and is supported by a positive crossover in the short-term EMAs.
If the bullish momentum continues, the next potential target is the 86 level . Conversely, a failure to sustain the breakout could see the price retrace to support around the 46 level .
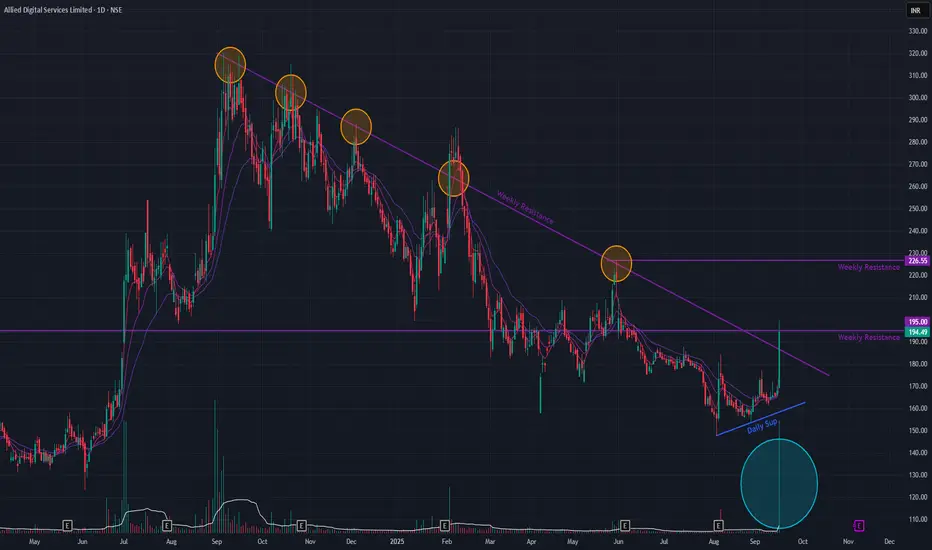
ADSL (Daily Timeframe) - Potential BreakOut / Reversal ?After a sustained downtrend since September 2024, ADSL is exhibiting significant bullish activity that requires careful monitoring.
Today's Action: The stock gained +15.73% on massive volume, challenging its primary descending trendline.
Bullish Indicators: Short-term Exponential Moving Averages (EMAs) have formed a positive crossover, signaling a potential shift in momentum.
Confirmation Required:
Historical Precedent: Similar breakout attempts have failed in the past, raising the possibility of a "false breakout."
Key Levels: To confirm the reversal, ADSL must hold above the trendline (a successful re-test) and decisively break the horizontal resistance established in January 2024.
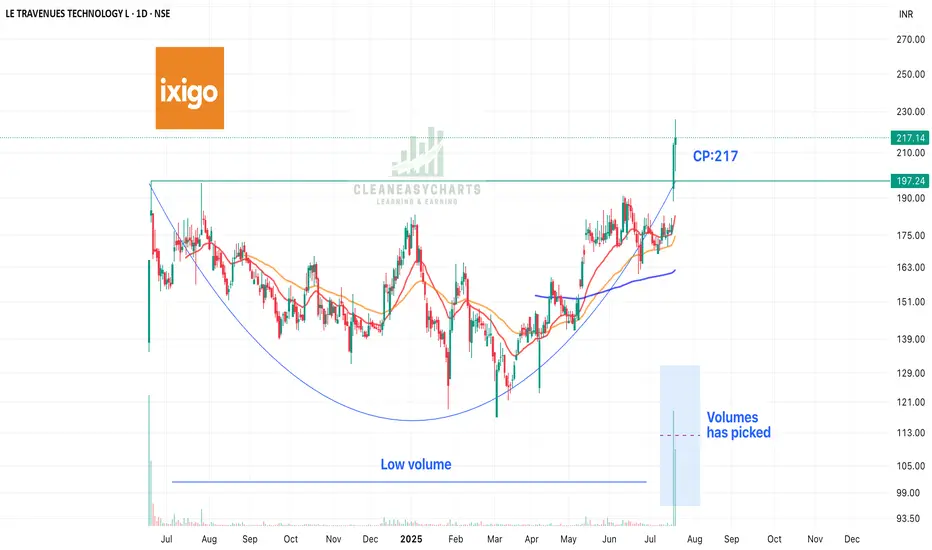
ixigo - Rounding Bottom Patter; IPO StrategyIXigo is a online travel aggregator and is the fastest gorwing Co. in this sector. This stock is looking great on account of following:
1. Fit into the criterion of IPO Strategy - crossed high of its listing price with big volumes
2. Rounding Bottom Patter
3. Best Q1 2025 results
4. Number 2 in OTA sector
This stock should be in your watching list for a good big returns.
Keep following @Cleaneasycharts as we provide Right Stocks in Right Time at Right Price!!.
Cheers!!
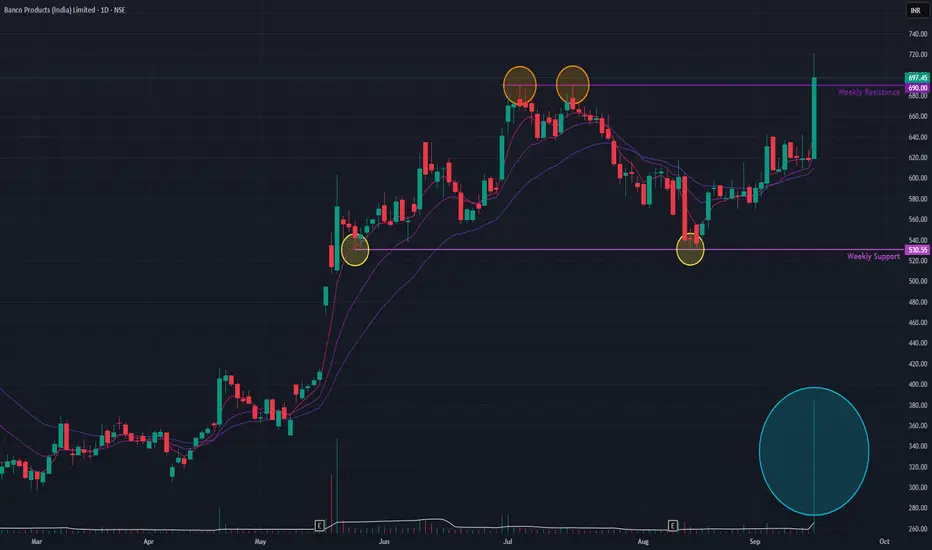
BANCOINDIA - Breakout with Volume SurgeBanco Products India has shown a breakout with volumes soaring to about 11 lakh shares in recent sessions, significantly higher than its 20-day average volume of around 8.4 lakh shares.
The stock price surged to ₹697 on September 15, 2025, up from about ₹619 just a few days earlier, reflecting strong buying interest and accumulation.

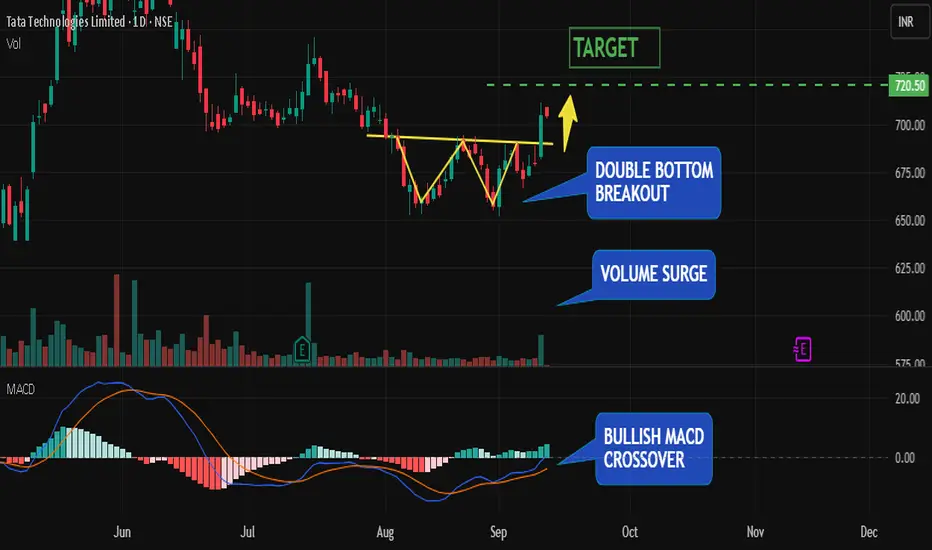
Tata Technologies Double-Bottom Breakout | Target ₹720The stock has recently completed a double-bottom reversal pattern . A double bottom is one of the most reliable bullish reversal setups, often described as a “W-shaped” formation. It occurs when price tests the same support level twice, with sellers unable to push lower both times. This repeated defense by buyers signals demand at those levels and exhaustion of selling pressure.
Once price broke above the neckline (the midpoint of the “W”), the pattern was confirmed, suggesting that buyers are regaining control and an uptrend may be unfolding.
But what makes this breakout even stronger is the confluence of technical signals:
Bullish MACD Crossover : The MACD line has crossed above the signal line, shifting momentum to the upside. This indicates that bullish momentum is not only present but accelerating.
Volume Surge : Breakouts accompanied by rising volume are considered stronger and more reliable. In this case, the surge in volume confirms that institutions and larger players are participating in the move, adding credibility to the breakout.
Together, these signals create a powerful alignment of pattern, momentum, and participation.
Trade Plan :
Entry : On breakout above neckline or on a healthy retest of the neckline as support.
Target : ₹720, calculated as the measured move objective from the double bottom formation.
Risk Management : Always size positions carefully. Risking only 1–2% of capital per trade ensures you can survive a string of losses and stay in the game long-term.
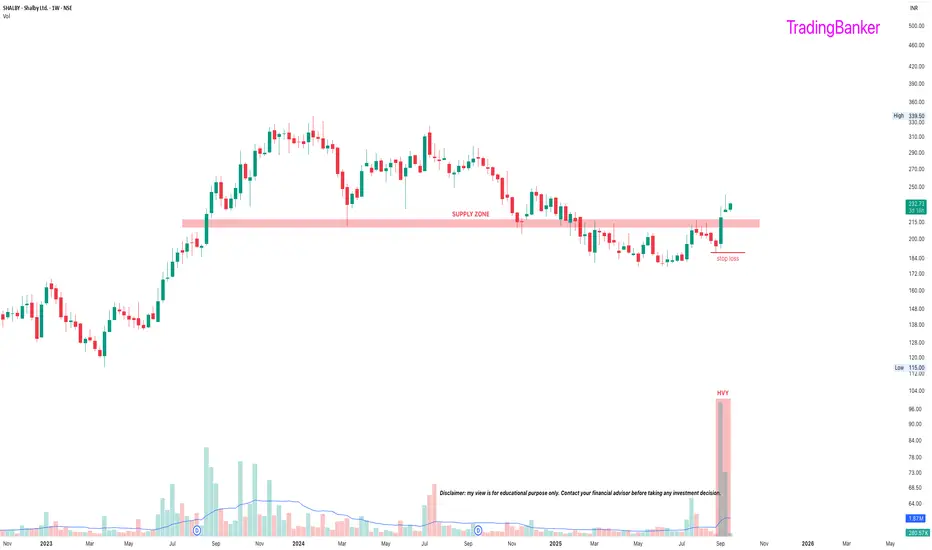
SHALBY: a probable longPros
-hospitals are a money minting machine attracting institutions (FII stake ⬆️)
-ARPOB (average revenue per occupied bed, one of the core metrics in hospitals)⬆️
-positive management commentary. for eg, aiming to improve profitability by reducing low margin schemes and focusssing on profitable schemes
-highest ever sales
-expanding through acquisitions, would eventually bring in the highest ever profits
-highest volumes of the year (week)
Cons
-SL needs risk management
-receivables > 6M = 20% of quarterly turnover (although some are from the government, they are still overdue)
Disc: Invested
Banco India (Daily Timeframe) - Potential ATH ??Banco India remains in a dominant long-term uptrend that started in June 2020. After a brief corrective downtrend from November 2024 to April 2025, the stock entered a sideways consolidation phase.
Today, the stock decisively broke out of this consolidation range with a surge of +12.84% on significant volume , signaling strong buyer commitment & a new All Time High (ATH) . This bullish move is further supported by short-term Exponential Moving Averages (EMAs), which are in a positive crossover state.
If this upward momentum is sustained, the next potential price target is the ₹850 level. Conversely, a failure to hold the breakout could see the price retrace to support near the ₹530 level.
Price-action is what matters !!
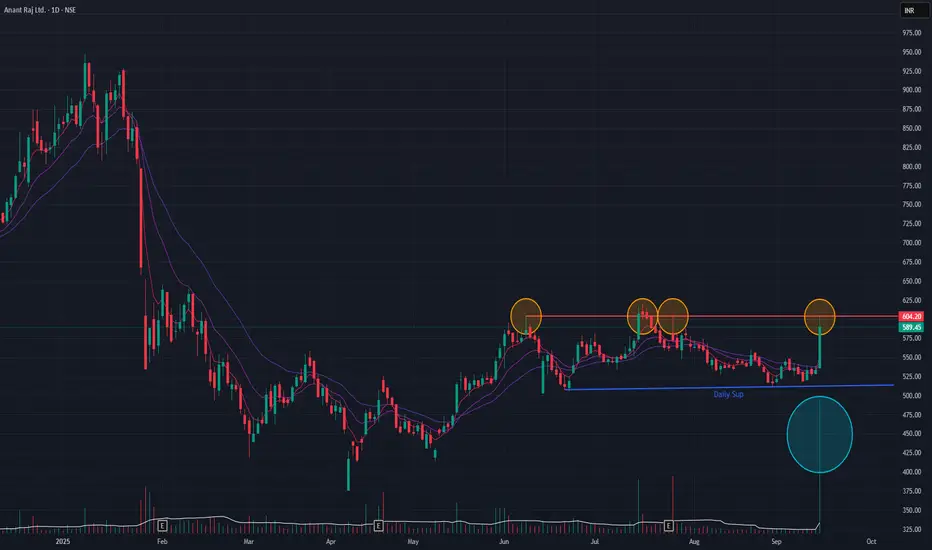
Anant Raj (Daily Timeframe) - Potential BreakOut candidate ??Following a downtrend that began in January 2025, Anant Raj has been in a sideways consolidation phase since May 2025. After several failed breakout attempts from this range, the stock demonstrated significant buying interest today, surging +10.53% on substantial volume.
While this move is positive, a cautious approach is recommended as the short-term Exponential Moving Averages (EMAs) have not yet registered a bullish positive crossover. The price action in the coming sessions will be critical for confirmation.
A sustained breakout above the consolidation channel could pave the way for further upside, with a potential short-term target of ₹667.
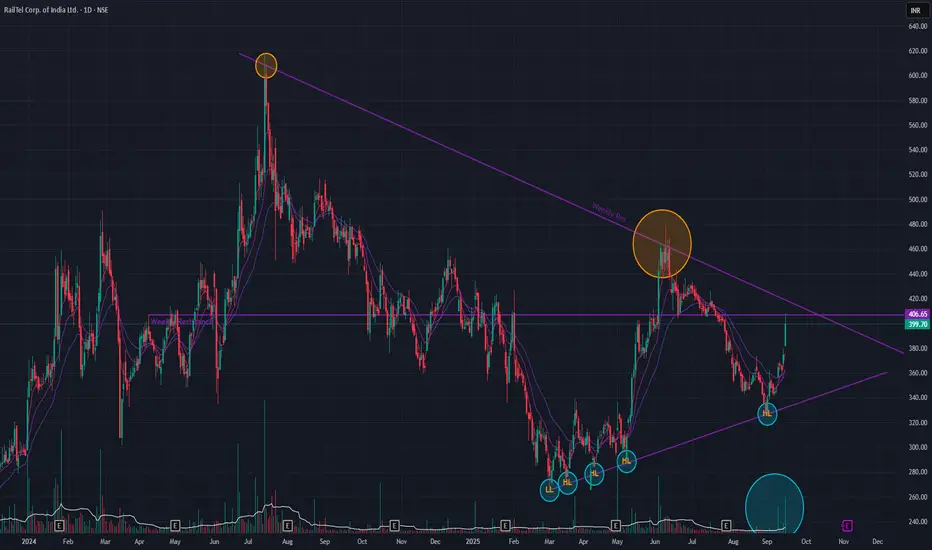
Railtel (Weekly Timeframes) - Is the trend reversing?After a sustained downtrend since July 2024, Railtel is showing signs of a potential trend reversal , evidenced by the formation of higher lows since March 2025.
Today, the stock exhibited significant bullish momentum, opening with a gap-up and closing with a 6.70% gain on substantial volume . This move is supported by short-term Exponential Moving Averages (EMAs) which are in a bullish positive crossover state.
The price is now at a critical juncture, testing a long-term horizontal resistance line. A decisive breakout above this level is essential for further upside. If successful, the next major obstacle will be the descending trendline that rejected a breakout attempt in June.
Keep a watch on this one !!