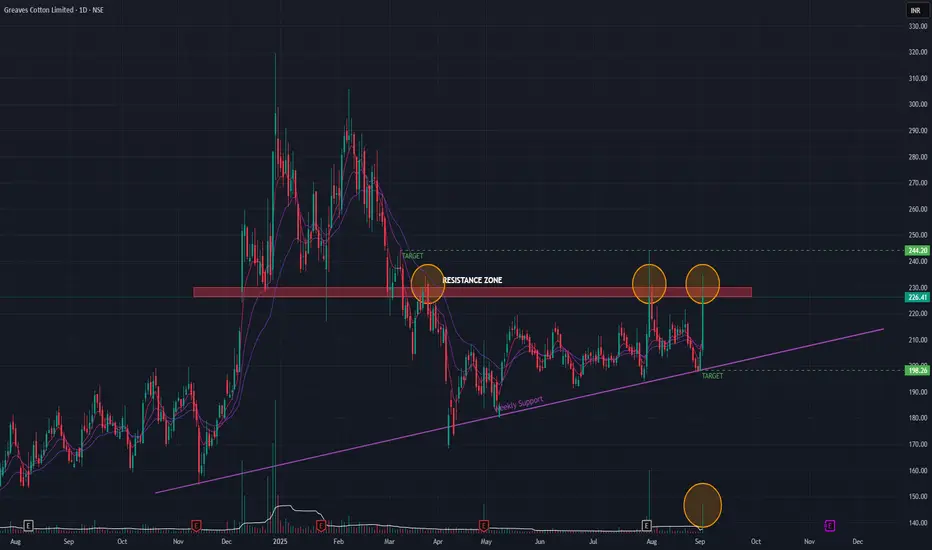
Greaves Cotton (Daily Timeframe) - Will it BreakOut or Not?Greaves Cotton since it's Double-Top formation has been in a downtrend. A key support level has become a resistance zone, which it's been trying to BreakOut few times. The stock has been forming Higher Lows for a while now. Few attempts to BreakOut has been futile. The recent BreakOut attempts been with huge volume spikes. Short-term EMAs are in positive cross-over state.
If it's able to BreakOut then the possible upside target is around 244. If not, we can expect the stock to go down to 198 levels.
Keep monitoring.
Volume
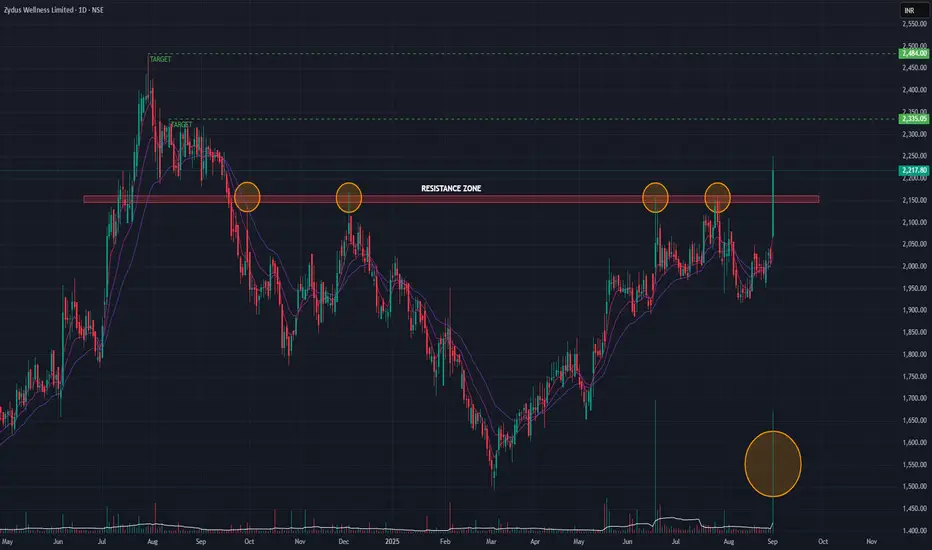
Zydus Wellness (Daily Timeframe) - Will it make new ATH?Zydus Wellness, ever since it made the All Time High, the stock was in a downtrend and then sideways for more than a year. Though it tried to breakout a key resistance level (as marked) multiple times, it could not breach the resistance zone. Today, it brokeout of the resistance zone with huge volume burst. The next few days of the stock moves in a positive direction, then it may reach 2335 levels which could be the first target.
Checking the weekly timeframe, we can see an inverted H&S pattern and without today's breakout, the stock has broken out of the H&S neckline. If we consider H&S pattern breakout, then the stock may reach new ATHs.
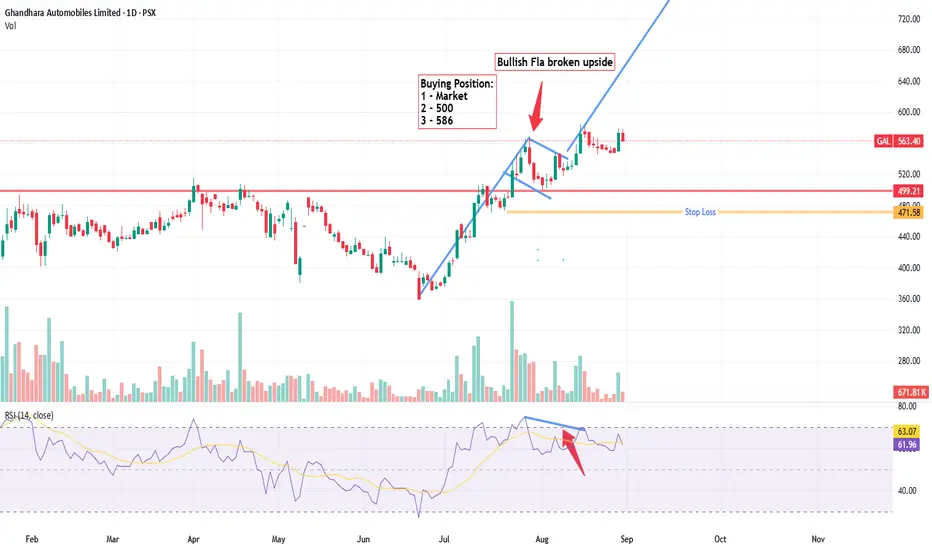
30% buy on each level GAL - PSXI am going to purchase 30% of my portfolio in this stock. What about You?
Let me explain why I am buying so i can keep it as record. I will visit this setup again and review my analysis again.
In all of the fundamental analysis of around 200 PSX companies of PSX, this company comes at No. 1. Here is the reason.
Revenue CAGR of 49.39% second to Sazgar in Automobile Sector.
Net Income / Profit after Tax CAGR for 5 years is as huge as 72%, second to sazgar in Auto Sector.
Net Margin of 14% while sazgar has 15 %
The largest inventory makes the difference amongst automobile sector.
Negative Fundamental
ROICE 7% lowest amongst auto sector.
Technical chart:.
With good fundamentals and upcoming Rekodeq project, I am bullish on my technical bias. I will make interval buying as per the mentioned levels.
1st Buy
On Market Buy around @563 because it already broken the Bullish Flag. I will at 30% of my portfolio to my first Buy.
2nd Buy (30% more):
Because the price has a bearish divergence, I therefore will wait if the price is breaking the previous lower low at support level @492, if not then 2nd Buy triggers.
3rd Buy (40% More):
The price needs to goes up and breaks 586 area then more buying and then wait for the price to touch my target.
Negative aspect of Bullish Bias.
The Bearish divergence needs to be dilluted Well, its a question mark and I will wait for the breakout of the current top to disrespect this obvious divergence.
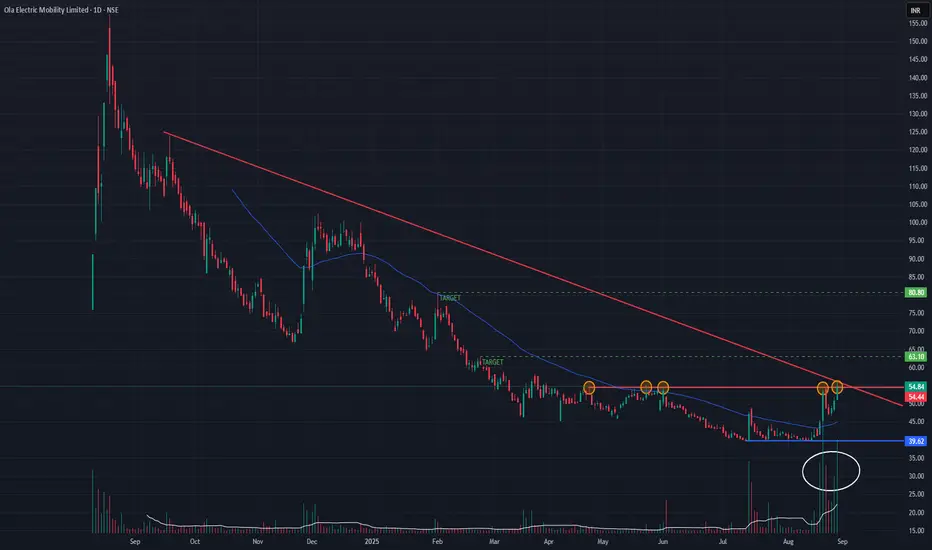
OLA Electric (Daily Timeframe) - Potential Bullish BreakoutOLA has been on a downtrend ever since it's IPO and recently it has shown signs of a reversal . Past few days, the stock has been attempting to Break-Out a major resistance multiple times, as indicated. Today it was able to breach the resistance with huge volume. The next few trading sessions will indicate the stock's trend.
Possible targets are, 62 & 80 if the stock sustains the uptrend.
To be monitored !!!
NG : A FALLING WEDGE BREAKOUT WITH 1:7.5 RR• NG was in downtrend and in a falling wedge for last 2 months
• Today It successfully retest the upper trend line of the wedge and confirming the BO
• A trade with 1:7.5 RR
• SL and the T1 and T2 mentioned in chart.
• Educational purpose only. Happy trading.

Good Support Spotted In Lux Industries LtdLux Industries Ltd is trading near Long-Term Support and Law Of Polarity (LOP). It can undergo any pattern in coming time say triangle, double bottom, wedge or v shape recovery.
Highest volume activity near this zone, RSI is around a small support.
One can have a first mover advantage investing around current level. Stock might see max downside till 1150 in case of market volatility or on some bad news.

high potential breakout on chart new life high possible Clear breakout new life high in making on chart making pattern which will make a huge fundamental and technical move
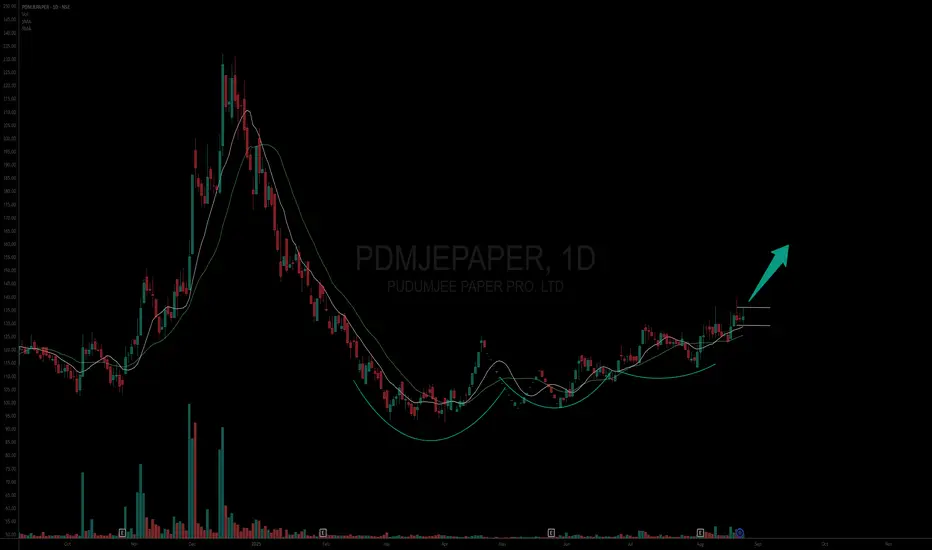
#PDMJEPAPERAsset: Pudumjee Paper Products Ltd (PDMJEPAPER)
Breakout Level: 137
Potential Target: 205
Stop Loss: 128 (~6%)
Timeframe: Short to Low Medium term
Risk to Reward ratio : 1:9
Rationale:
Fundamentals -
Fundamentally decent stock with the following attributes:
* ROCE - 22.4%
* ROE - 16.7%
* Debt to Equity - 0.02
* Stock PE 12.0 / Industry PE - 16.1 || Stock PBV 2.16 / Industry PBV 0.82 - Company is slightly underpriced
* EPS / Revenue - Increasing
Technicals -
⦁ The price has moved above the 200 DMA and started consolidating
⦁ Low volume accumulation indicating a possibility to move up quickly from here
⦁ 10 DMA has moved above the 20 DMA indicating short term strength is aligning itself properly with medium term (monthly) outlook
⦁ RS / ADR and Momentum lines are beginning to look ready to blast
⦁ Weekly and Monthly structures look good
Market analysis
* Promoters are holding steady
Cons
* Limited institutional activity so a cautious entry should be fine.
This analysis is for educational purposes only and should not be considered as financial advice. Trading and investing in financial markets involve significant risk, and past performance is not indicative of future results. You should conduct your own research and consult with a qualified financial advisor before making any trading or investment decisions. The author is not responsible for any financial losses or damages that may result from the use of this information.
#SIGNPOSTAsset: Signpost India Ltd (SIGNPOST)
Breakout Level: 288
Potential Target: 357
Stop Loss: 264 (~7%)
Timeframe: Short to Low Medium term
Risk to Reward ratio : 1:2.5
Rationale:
Fundamentals -
Fundamentally decent stock with the following attributes:
* ROCE - 15.2%
* ROE - 16.5%
* Debt to Equity - 0.79
* Stock PE 40.1 / Industry PE - 38.7 || Stock PBV 6.9 / Industry PBV 4.61 - Company is slightly underpriced
* EPS / Revenue - Increasing
Technicals -
* The stock has moved above its 200 DMA with a large green candle and volume
* Price is consolidating after that while the 10 DMA and 20 DMA are moving up
* 50 DMA and 100 DMA are below the 200 DMA however they are beginning to fall in sequence
* The 200 DMA line is giving a positive expectancy
* RS is positive and sloping up
* Momentum and ADR line is also sloping up
* ADR is 6.4%
* Low volume pull back
Market analysis
* Promoters are holding steady
Cons
* Limited institutional activity so a cautious entry should be fine.
This analysis is for educational purposes only and should not be considered as financial advice. Trading and investing in financial markets involve significant risk, and past performance is not indicative of future results. You should conduct your own research and consult with a qualified financial advisor before making any trading or investment decisions. The author is not responsible for any financial losses or damages that may result from the use of this information.

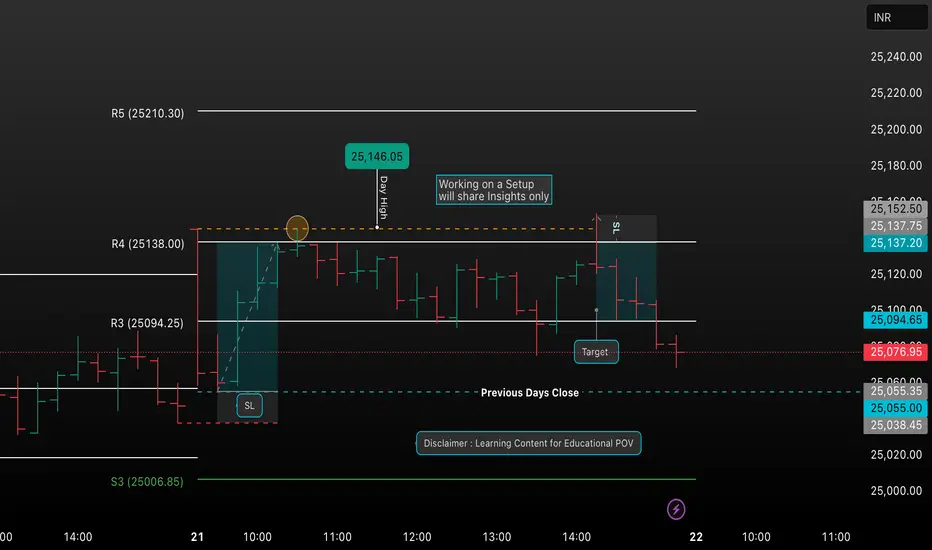
Learn & Trade: Nifty StrategiesDaily Nifty chart setups, insights, and detailed trade ideas. Follow for real-time analysis and educational tips—ideal for new and experienced traders looking to learn disciplined market strategies.”
2. “Sharing structured Nifty setups, key trading zones, and transparent trade planning. Join in for actionable analysis, risk management techniques, and a supportive learning environment for all traders.”
3. “A platform dedicated to simplifying technical analysis and real-world trading. Expect clear charts, honest reviews of trades, and an open community to discuss and improve each other’s strategies.”
You can use or adapt any of these as your TradingView chart post description or as a community introduction. This combination emphasizes your focus on actionable setups, ongoing learning, and engaging with fellow traders.
DMART BREAKINGLONG TERM RESISTANCE WEEKLYDMART breaking long time resistance on weekly chart
huge volume, bullish RSI above 60
trading above 20 ema
GST Reform effect
target1 4900 target2 5400
sl 3900 use ur own sl
NO BUY/SELL RECOMENDATION

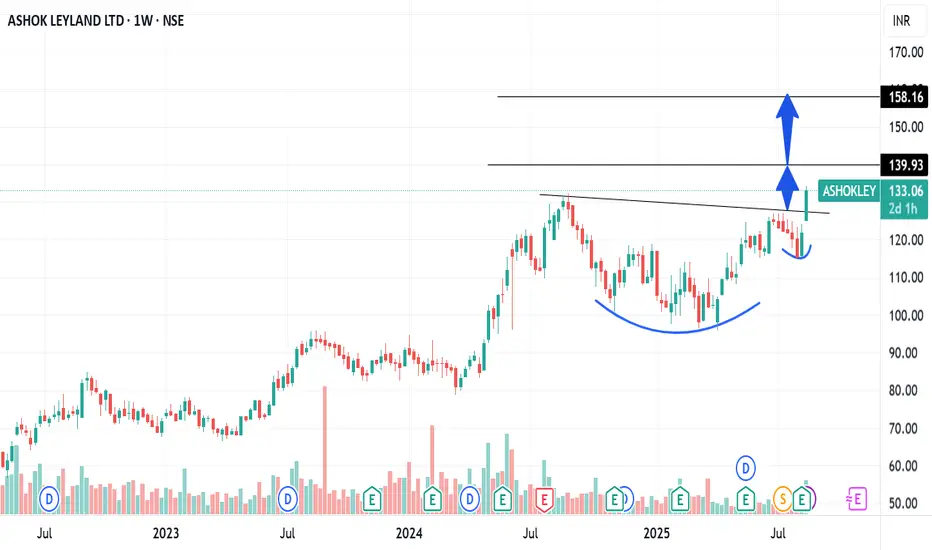
ASHOKLEYLAND C&H PATTERN BREAKOUTAshokleyland breaking C&H pattern weekly basis
with huge volume this week
bullish RSI above 60
trading above 20 ema
#target1-140, #target2- 158
sl- 115 auto sector in focus
NO BUY/SELL RECOMENDATION
L&T Finance Ltd.(LTF) This chart shows the daily price movement of L&T Finance Ltd. (NSE) from early 2024 to August 2025.
The stock is currently trading at ₹217.03, up +3.13% on the day with a volume of 9.45M.
The recent rally has pushed the price above a key resistance zone around ₹214–215, now acting as support (dotted green line).
A bullish breakout pattern is visible, with the drawn projection (blue arrow) suggesting possible continuation towards the ₹225–230 range in the near term.
The broader trend since March 2025 shows higher highs and higher lows, indicating strong upward momentum after a prolonged consolidation phase in 2024.
**** Not a BUY/ SELL Recommendation. Only for education purpose.

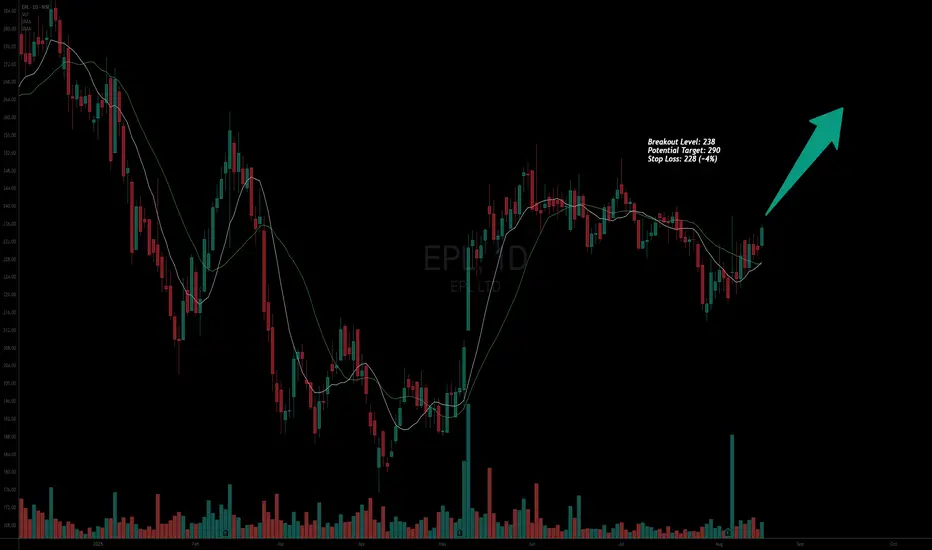
#EPLAsset: EPL Ltd (EPL)
Breakout Level: 238
Potential Target: 290
Stop Loss: 228 (~4%)
Timeframe: Short to Low Medium term
Risk to Reward ratio : 1:5
Rationale:
Fundamentals -
Fundamentally decent stock with the following attributes:
* ROCE - 17.5%
* ROE - 16.3%
* Debt to Equity - 0.34
* Stock PE 18.9 / Industry PE - 22 || Stock PBV 3.19 / Industry PBV 2.32 - Company is slightly underpriced
* EPS / Revenue - Increasing
Technicals -
* Structure of the stock is showing potential to move up
* Price went above the 200 DMA although 200 DMA is sloping down
* The 10 DMA is above the 20 DMA although these are below the 200 DMA still
* Price is surfing the moving averages
* 50 DMA is sloping up
* Pull backs are on low volumes whereas the up moves are on higher volumes relatively
* ADR / RS / Momentum all seem ready to pick up
*
Market analysis
* Forecast to move up by ~42%
* FIIs are increasingly picking up this stock
*
Cons
* Promoter holding has dropped from 51% to 26% in one quarter
* Retail has picked up the stock to the tune of ~46%
This analysis is for educational purposes only and should not be considered as financial advice. Trading and investing in financial markets involve significant risk, and past performance is not indicative of future results. You should conduct your own research and consult with a qualified financial advisor before making any trading or investment decisions. The author is not responsible for any financial losses or damages that may result from the use of this information.
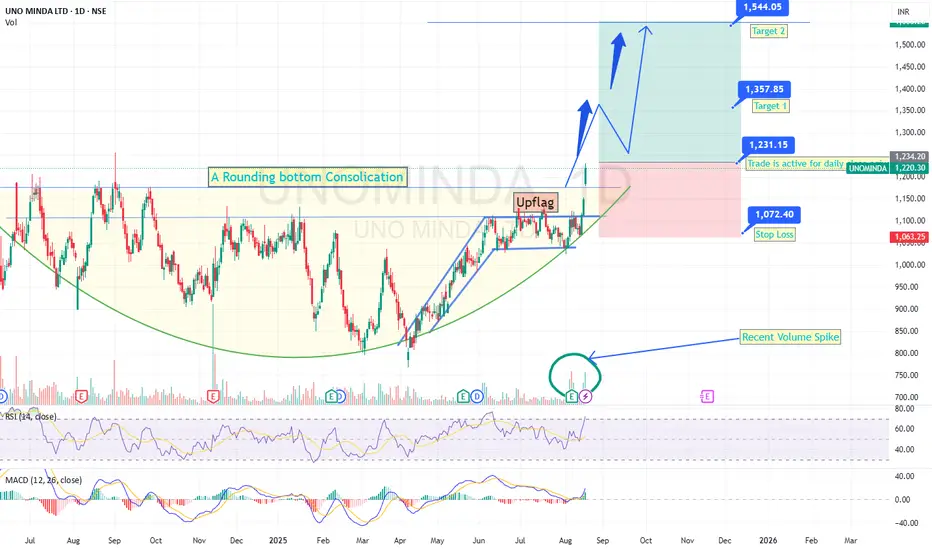
An Upflag Inside an Round bottom consolidation with Gap up B/OUno Minda was consolidating between the 1180-800 price range for past 1.2 years,under a daily time frame.
This is a very good price consolidation with respect to time.
With the recent expectation that the Goverment might slash the GST rate slabs for Automobile Industry, this auto parts maker stock has given a breakout of the rounding bottom consolidation, with an inside upflag break out confirmation too.
Though the breakout has happened with gap up, it is a better candidate for going long, considering the recent surge in volumes with RSI and MACD providing double confirmation.
3 Criteria to consider:
1. Rounding bottrom Breakout
2. Inside upflag breakout
3. News that GST rate migh be slashed for auto industry.
Hence it is better to consider under below levels:
1. Jump in - Daily close >1260
2. Stop Loss - Daily close <1060
3. Target 1 - 1357-1360 range
4. Target 2 - 1548-1550 range.(Takes time, with retest to rounding base and pull back).
The ideas shared here are purely for educational purpose only.
#KRISHANAAsset: Krishana Phoschem Ltd (KRISHANA)
Breakout Level: 552
Potential Target: 685
Stop Loss: 524 (~4%)
Timeframe: Short to Medium term
Risk to Reward ratio : 1:5.5
Rationale:
Fundamentals -
Fundamentally decent stock with the following attributes:
* ROCE - 21.8%
* ROE - 25.3%
* Debt to Equity - 0.98
* Stock PE 32.7 / Industry PE - 27.3 || Stock PBV 8.59 / Industry PBV 3.02 - Company is overpriced
* EPS / Revenue - Increasing
Technicals -
* Structure of the stock is showing strength
* VCP pattern observed
* Price is surfing the 10 & 20 DMA
* Rising 200 DMA and 10 DMA is above the 20 DMA and hinting towards a continued up move
* RS is strong and increasing
* Pull back has been on low volumes
* Observing more green candles with higher volumes compared to red candles suggesting some continued accumulation
* ADR 5.2%
* Launchpad is getting formed with low risk potential
Market analysis
* Fertilizer sector has seen ~4.3% increase last month although last week was negative
* Promoter holding has been high at ~71%
* Retail holding is reducing
* FIIs picked up the stock for the first time this quarter
Cons
* MFs and DIIs are not involved
This analysis is for educational purposes only and should not be considered as financial advice. Trading and investing in financial markets involve significant risk, and past performance is not indicative of future results. You should conduct your own research and consult with a qualified financial advisor before making any trading or investment decisions. The author is not responsible for any financial losses or damages that may result from the use of this information.

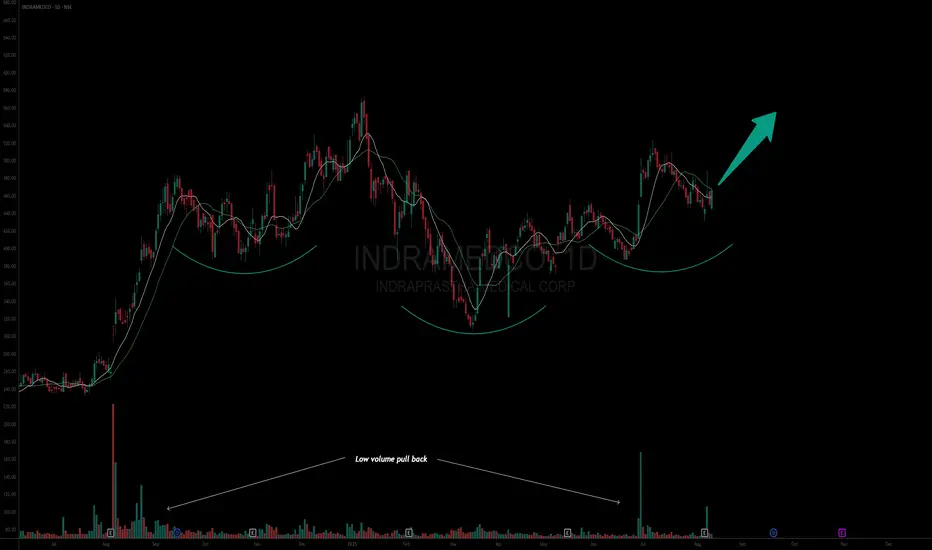
#INDRAMEDCOAsset: Indraprastha Medical Corporation Ltd (INDRAMEDCO)
Entry Level: 475
Potential Target: 575 (1st target)
Stop Loss: 435 (~8% risk)
Timeframe: Short to Medium term
Risk to Reward ratio : 1:2.f
Rationale:
Fundamentals -
Fundamentally decent stock with the following attributes:
* ROCE - 39%
* ROE - 30%
* Debt to Equity - 0.05
* Stock PE 25.5 / Industry PE - 65.4 || Stock PBV 7.16 / Industry PBV 6.78 - Company is underpriced
* EPS / Revenue - Has been increasing for the last 6 months
* ADR is 3.9% (Fair but not that high)
* Fundamentally good company
* Hospitals / Health Care provider sector is holding strong
Technical -
* Overall structure - Stock is showing resiliency in times of failing market breadth.
* 200 DMA is sloping up / 50 and 100 DMA is sloping up
* 10 DMA is above 20 DMA but it needs to improve its structure
* Relative Strength is beginning to pick up.
* Multiple timeframe analysis - Weekly structure is indicating towards a potential reverse head and shoulder provided the trend continues.
* Low volume pullback and increasing volume when price makes long range Green candles
Market analysis
* Promoter holding has remained flat / MF and DII has remained flat / Retail holding is high which is not that great.
Cons
* Momentum and ADR is low indicating slow movement potential
* Holding pattern can improve
This analysis is for educational purposes only and should not be considered as financial advice. Trading and investing in financial markets involve significant risk, and past performance is not indicative of future results. You should conduct your own research and consult with a qualified financial advisor before making any trading or investment decisions. The author is not responsible for any financial losses or damages that may result from the use of this information.
#ETERNAL* Mutual Funds and DIIs are buying
* FIIs are selling
* Rounding base / Spike up followed by pull back and consolidation
* Upside forecast of 33%
* Price has regained its 200 DMA
* Price has a tendency to bounce off of the 100 DMA
* One can expect a potential pull back further to 100 DMA and then continuation
* RS / ADR / Momentum indicate a continuation towards the upside
* Last candle formed is a Doji and inside day, so one can take a low risk early entry
This analysis is for educational purposes only and should not be considered as financial advice. Trading and investing in financial markets involve significant risk, and past performance is not indicative of future results. You should conduct your own research and consult with a qualified financial advisor before making any trading or investment decisions. The author is not responsible for any financial losses or damages that may result from the use of this information.

#DEEPINDS* Rounding base
* Price has regained its 200 DMA
* Relative strength / ADR / Momentum is indicating continuation of up move
* Fundamentally not that great a stock i.e., ROCE and ROE are 11.7% and 8.2% respectively
* As the price is consolidating, one can take an early entry and then scale
This analysis is for educational purposes only and should not be considered as financial advice. Trading and investing in financial markets involve significant risk, and past performance is not indicative of future results. You should conduct your own research and consult with a qualified financial advisor before making any trading or investment decisions. The author is not responsible for any financial losses or damages that may result from the use of this information.

#MEDANTA* Rounding base
* Breakout from channel as well as pendant structure
* High volume follow through
* Good earnings
* Good ROE / ROCE
* EPS increasing
* Holding pattern is OK / though its not that ideal i.e., promoter holding is just 33% / FIIs are holding only 11% and declined this quarter
* Relative strength is ok as price is showing strength in low market breadth situation
* Price has shot up so expect a pull back and then continuation
* Please track the stock and take position and manage risk based on your appetite
This analysis is for educational purposes only and should not be considered as financial advice. Trading and investing in financial markets involve significant risk, and past performance is not indicative of future results. You should conduct your own research and consult with a qualified financial advisor before making any trading or investment decisions. The author is not responsible for any financial losses or damages that may result from the use of this information.

#DMCC* Large rounding base getting formed
* Low volume pullback as the base was in its lowest
* Price is surfing the moving average
* Moving averages are correcting
* Relative strength is good / price has shown resilience in face of declining market breadth
* Highest volume ever and price moved by 12.79% in one day
* Expect a pull back, consolidation followed by continuation of the stock towards the upside
* Track the stock and enter at the right time by keeping in mind your risk profile
* Position size as per your context
This analysis is for educational purposes only and should not be considered as financial advice. Trading and investing in financial markets involve significant risk, and past performance is not indicative of future results. You should conduct your own research and consult with a qualified financial advisor before making any trading or investment decisions. The author is not responsible for any financial losses or damages that may result from the use of this information.

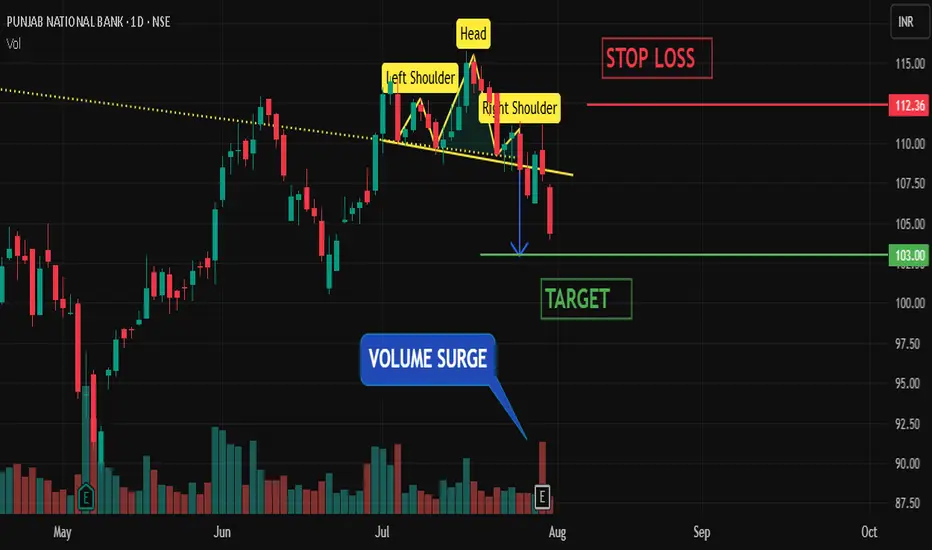
PNB Breakdown Alert: Further Downside Likely📊 TECHNICAL INDICATOR ANALYSIS – PNB BEARISH OUTLOOK
🔻 1. HEAD & SHOULDERS PATTERN FORMATION
PNB has formed a CLASSIC HEAD AND SHOULDERS PATTERN, a strong bearish reversal signal. The breakdown below the neckline confirms the end of the previous uptrend and suggests a shift in sentiment toward the downside.
📉 2. VOLUME SURGE ON BREAKDOWN :
A SIGNIFICANT SPIKE IN VOLUME was observed during the breakdown, reinforcing the bearish pattern. Volume confirmation is crucial, and in this case, it shows that sellers are aggressively stepping in to drive the price lower.
📉 3. BEARISH MACD CROSSOVER :
The MACD LINE HAS CROSSED BELOW THE SIGNAL LINE, a key momentum-based sell signal. This bearish crossover aligns with the breakdown and volume, indicating that downside momentum is likely to accelerate.
🎯 TRADE SETUP :
✅ TARGET: ₹103
❌ STOP LOSS: ₹112.5
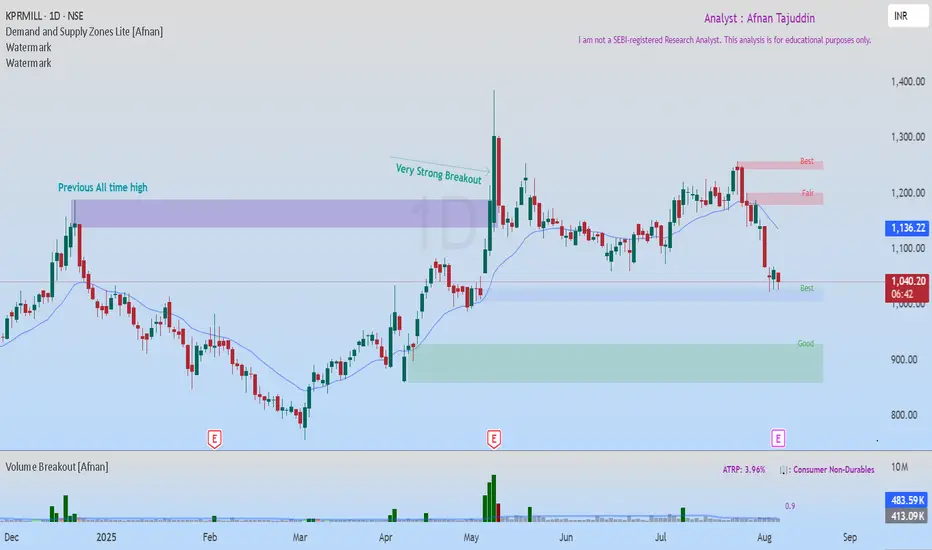
Smart Money Reloading? KPRMILL Approaches a controlling zoneKPRMILL is currently testing a textbook Rally-Base-Rally demand zone that appears to be not just any zone—but a “controlling” demand zone . What makes it special? Let’s break it down in simple terms.
Broke a Major Barrier: This zone didn’t just form anywhere—it marked the base right before price broke past its previous all-time high . That’s a major institutional fingerprint.
Strong Imbalance Post-Zone: What followed was a powerful directional move , with large-bodied green candles that screamed conviction. When price moves that decisively, it’s rarely retail.
Weekly Timeframe Alignment: The same demand zone appears on the weekly chart —which isn’t just coincidence. It reinforces its significance and increases its weight.
Zone Already Holding Its Ground: Interestingly, this zone already stalled a recent sell-off , showing that demand is still alive here.
Tight Structure = Attractive R:R: It’s a compact zone , meaning your stop-loss doesn’t need to be wide. That naturally boosts your risk-reward ratio.
📊 Volume Analysis:
Volume Doesn't Lie: Check the volume on the breakout—it surged. That kind of volume, paired with a clean breakout, almost always hints at institutional participation .
Quiet Pullback = Opportunity? Price is now pulling back into the zone on declining volume . That drop-off in participation from sellers can often precede a reversal.
There could be a meaningful bounce opportunity. The most logical target? That would be the opposite supply zone .
“The market speaks loudest through imbalance—learn to listen.” Always remember, not all demand zones are tradable . Focus only on high-quality zones
📌 This analysis is shared purely for educational purposes. I am not a SEBI-registered research analyst, and this is not trading or investment advice.
🚀 Stay sharp, stay selective—the market rewards precision. ⚡