ZYDUS Lifesciences - An Interesting ChartA good accumulation Range
A "SPRING" and a good up move
Relative strength positive
Money flow positive
Increased Buying Pressure
Good quarterly results
Now, A break out of the Accumulatio zone on increased volume. Also going past an old supply area of the BC bar.
Looks poised for a move to stage 2. Could also test the previous supply before further up move. Next couple of sessions would throw more light.
VSA

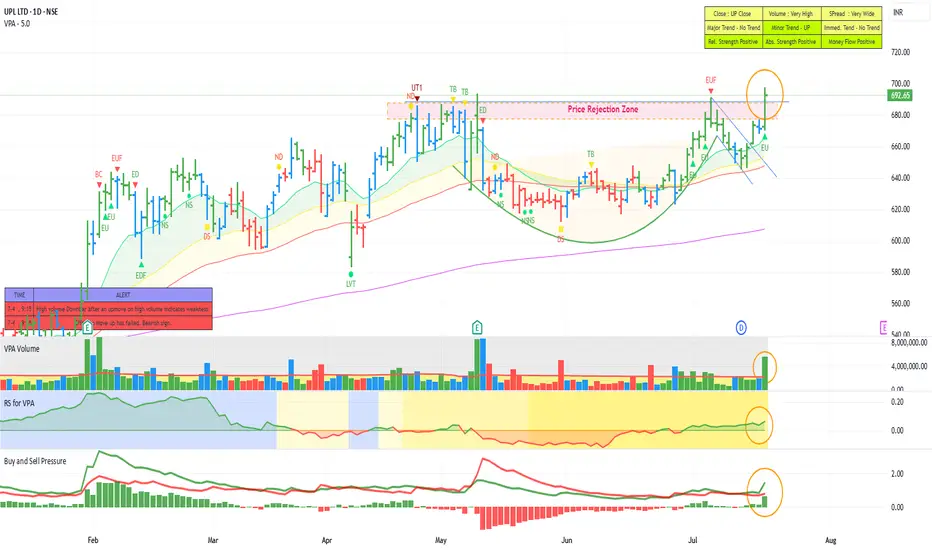
UPL - Ready to move to the next OrbitA good picture is worth a Thousand... well at least 50... words :). We can see very good delivery volumes coming in as well. However We need to wait for the confirmation in the next couple of Bars.
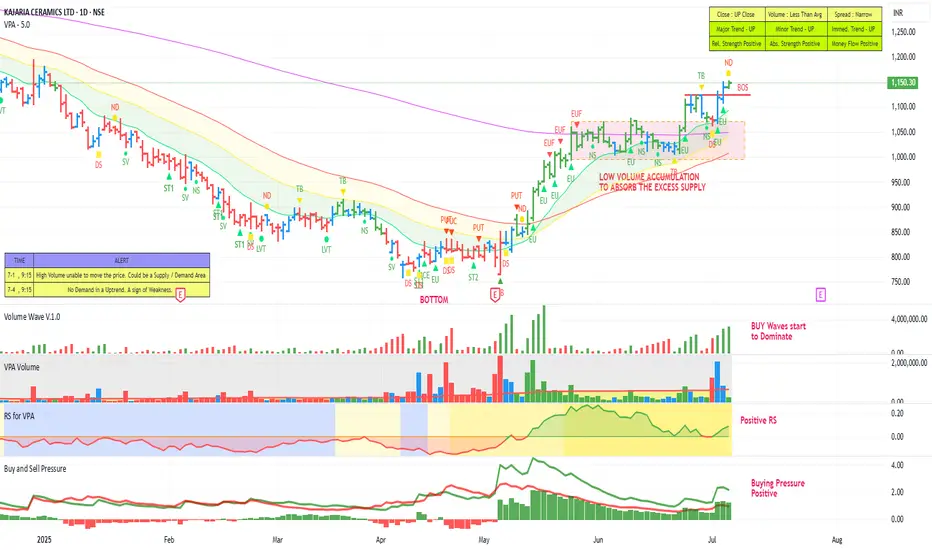
KAJARIA CERAMICSThe stock dropped 50% from the peak. Then it formed a bottom and tried to move up. It moved above the short-term moving averages. But every push upward was met with supply. Then we saw a small range to absorb the excess supply. Then the stock moved past the 200 DMA. Now it is making Higher High and Higher low. The Relative strength, Buying Pressure and Moneyflow are positive. The buy waves have started to dominate. The stock looks poised to move up further.
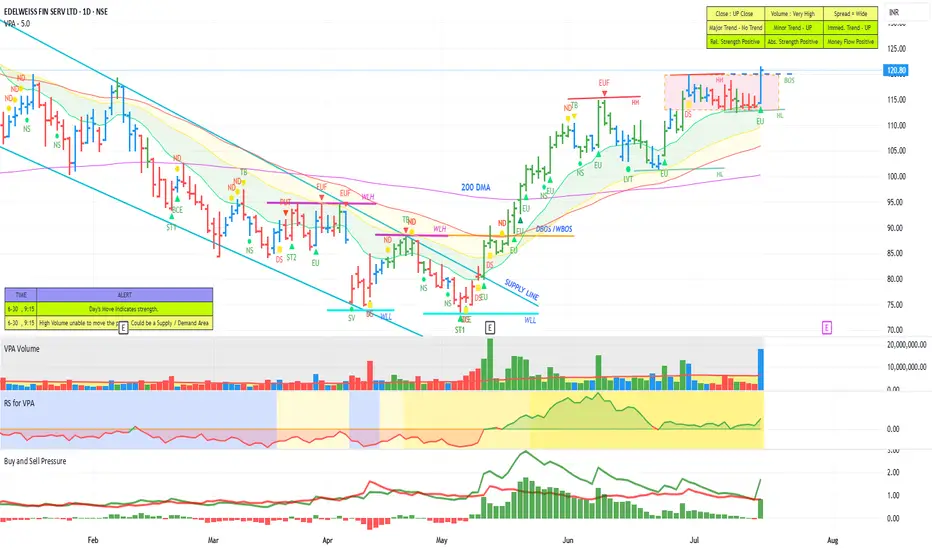
EDELWEISS - Moving to the Next Orbit?Stock continue to making Higher high and Higher Lows. A small consolidation and then a Break of structure with a high volume Bullish wide spread up bar. Relative strength, Money Flow and Buying pressure lending support. The stock seems poised to move in to the next orbit.
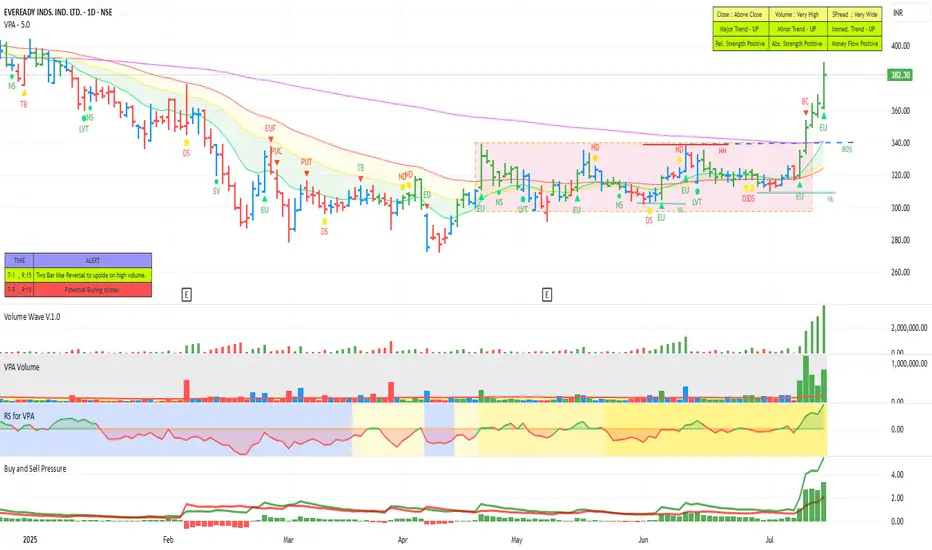
EVEREADY - POISED FOR A UPMOVEThe stock fell about 45% form it's last Peak. Then an attempt to move up and more than two months of consolidation . Now making Higher Highs and Higher lows and moving past the short term moving averages and the 200 DMA. We can see strong momentum and bullish volume and increasing Relative strength. Money Flow is positive. The stock looks poised for a good up move.
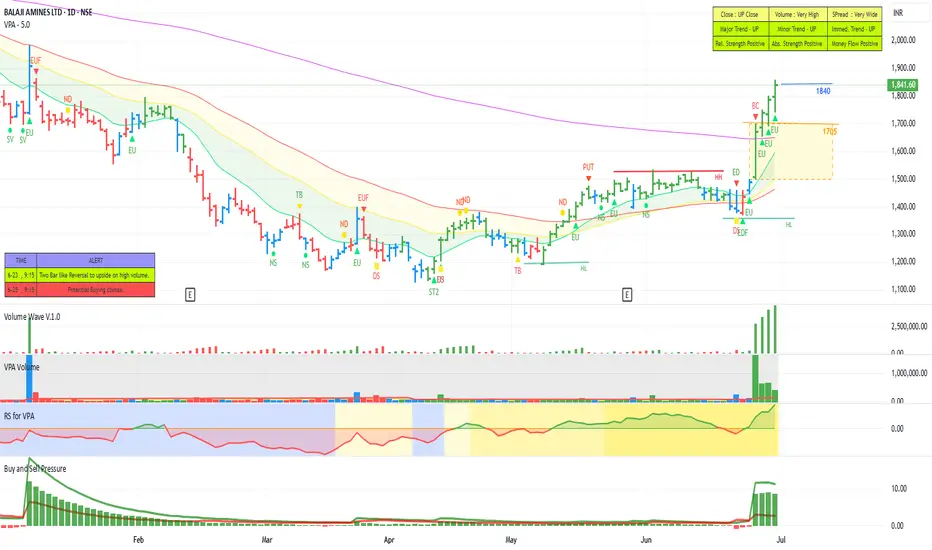
BALAJI AMINES - STEPPING INTO STAGE 2 ?The leading amine manufacturing company stocks had seen a huge down move of 50 to 60 percent. Of late many of these stocks have seen smart recovering. Leading stocks like alkyl amine, Vinati organics etc. crossed above the short-term moving averages. 200 DMA and moving up. Another stock in the group Balaji Amines has also started moving up now. After making a bottom it is now started making higher highs and Higher Lows. It also crossed above the short-term moving averages. The last few sessions we saw a huge momentum coming in with a huge Buy Wave pushing the stock above the 200 DMA. We can see that the relative strength and the absolute strength are also positive with the money also flowing into the stock. Now it is safely out above the 200 DMA with all other parameters looking positive. There is also good committed buying seen looking at the delivery volumes. The current momentum is likely to push up the stock further along in line with the other main amine manufacturing stocks.
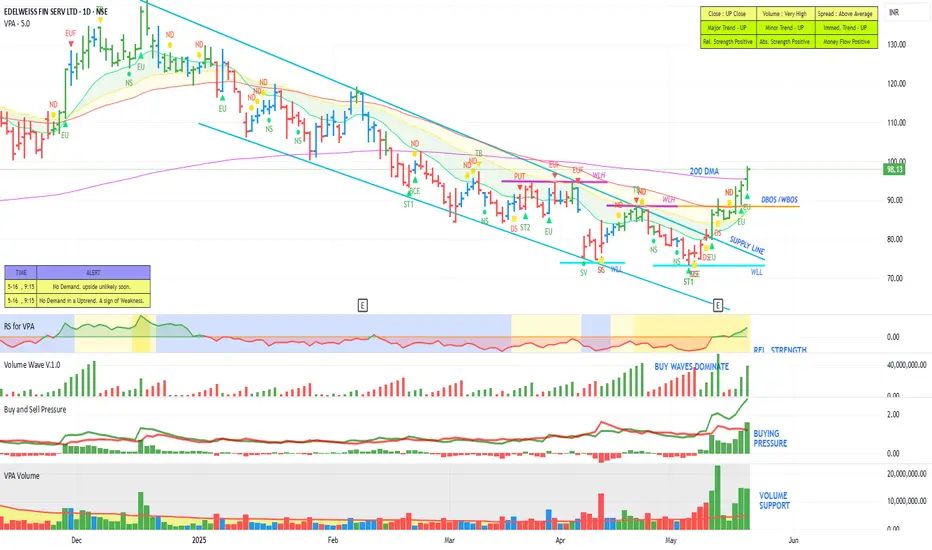
EDELWEISS - Setting up for a good up move?One more interesting chart for study. This stock was pushed down from the top by almost 50%. As you can see, as the stock was dropping, the buy waves were getting stronger and stronger and they started dominating. As you can see, now it seems to be on the recovery path. It has gone above the supply line and moved past the short-term moving averages and also the 200 DMA. We can see marked increase in the buying pressure. Also, there is a very good volume support coming here. The Relative Strength and Money Flow are positive. Now we can see that there is a break of structure in both daily and weekly as well. The stock seems to be getting ready for a good up move and could see 140 levels as a minimum. But at this juncture, we could see a retest of the 200 DMA levels before moving up further.
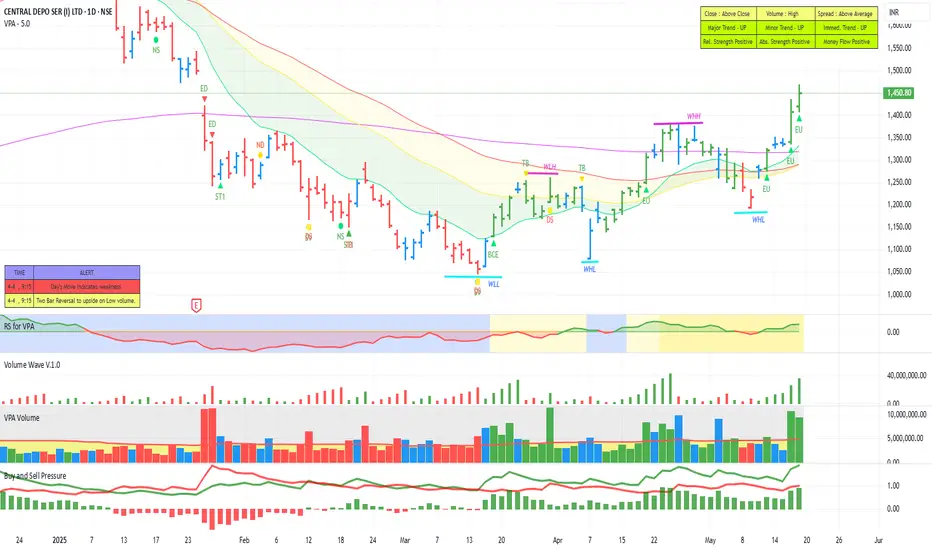
CDSL - Poised for good up Move ?CDSL, another interesting chart for our study. The stock was pushed down almost 48 percent from the its high to below 200 DMA levels and also the short-term moving averages. Then it started recovering. Now it is making higher highs and higher lows on the weekly chart as well. It has gone above the short-term moving averages and the 200 DMA as well. We can see the buying waves are getting much stronger. Also, the buying pressure has been quite positive for some time. Right now, the relative strength and the money flow also have turned positive. Now it seems the stock is setting up for a much bigger move and could see 1900 levels. A pull back to the 20 SMA will be the ideal opportunity for entry.
Disclaimer: This is only for learning purpose and not a recommendation to buy and sell.
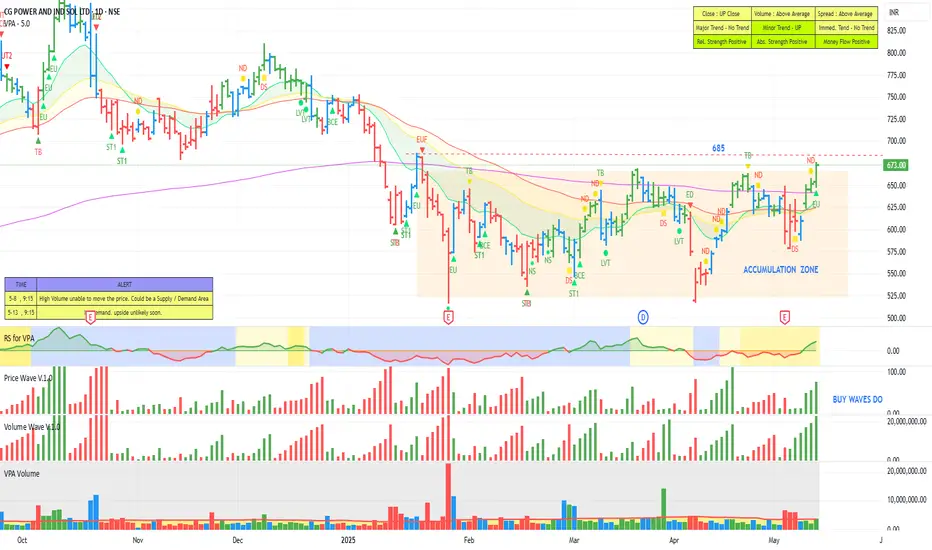
CG POWER - A stock for your WatchlistHere is another stock for your watch list, this is CG power which has been consolidating for nearly 3 months in a typical Wyckoffian accumulation zone. Now it looks ready to move out of the zone and move up further. As you can see the buy waves are getting stronger and the relative strength and the money flow are all positive. However, we need to see more volumes coming in to fuel the up move and this has to cross above the important pivot of 685, then we could see at least another 20% up move.
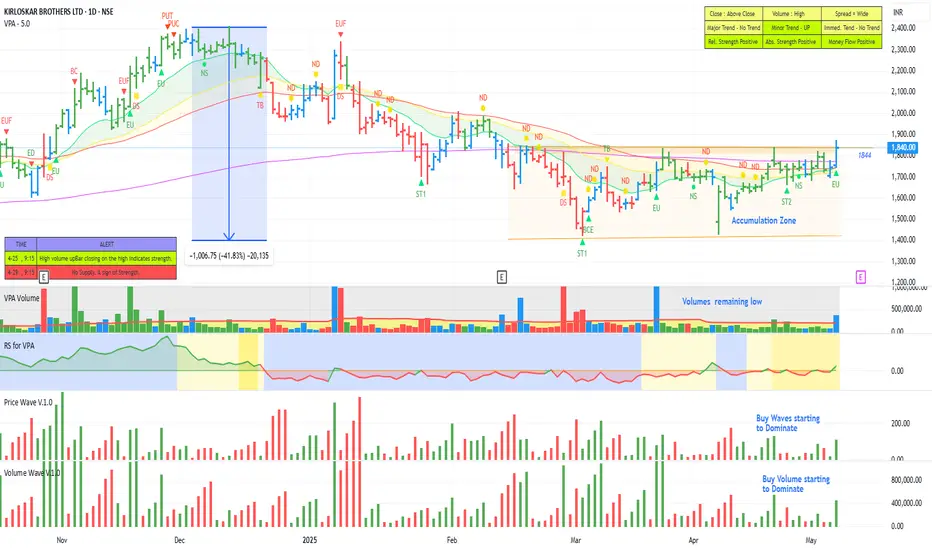
Kiroloskar Brothers - An Interesting ChartSharing an interesting Chart here. As you can see the stock had a massive drop of nearly 40 percent from its high and it was pushed below the 200 DMA. Then we saw some strength coming in and it started consolidating for the last two months and it was moving in a range. Now we can see that the buy waves have started to dominate. Also, the volume remained low during the consolidation or the accumulation phase. Now it has started to increase now. The stock is at the edge of the accumulation zone and we can see the relative strength, absolute strength and money flow are positive. However, the stock has not started trending up, it has to break above the consolidation zone. Now it has moved past the short-term moving averages and the 200 DMA as well. The stock is very interestingly poised. If it breaks out of this consolidation zone, then it could see 2400 levels. However, as we all know this may not be the right time given the current circumstances and also we are expecting the results next week. In fact, Q3 results were quite robust and the same robust results could continue pushing the stock up. But we need to wait for the current situation to resolve and also it may be a better idea to wait till the results are out.
IOC - Poised for good up Move?After a big drop of nearly 40 percent from the top, the stock started consolidating and moving up, making a nice rounding bottom type of pattern. It started making higher highs and higher lows and moving past the short-term moving averages. Now, it has also gone past the 200 DMA and also crossing above an important pivot. We can see all the parameters like the relative strength, money flow, absolute strength are all positive. Also, it has come out with very good results for the fourth quarter with a good jump of nearly 58 percent in net profit. We can see the volume is also increasing along with the buying pressure. Now it is setting up nicely for a big up move. So this is a stop we should be watching.

Bull movement to come immediately in IDFCStock selected in daily TF
Sector support - positive
Stock recovered immediately from support zone which confirms it as significant support zone and now weak pullback at minor resistance.
VSA principles
Despite increasing volumes in pullback , price is displaying strength
August 26 Bar showing strength since it is a down close bar with same spread as last two bars but volume higher than many bars of past.
This shows smart money buying in pullback at low prices and retail traders exiting which curbs unnecessary supply in higher prices at higher levels. This is a clear signal of strength
Today’s candle confirms that yesterday signal and gives every opportunity.
Lower time frames in four hours and seventy five minutes, volume built up is observed only on lowest prices indicating clear smart money support.
Last bar in four hour timeframe and 75 min time frame of today is narrow spread with ultra high volume with price close at lows .
Target can be 120-124 with minor resistance zones at 116 and 118

TATA communications - retest at demand zoneboth major and minor pitchforks showing the least resistance path of price is to go up.
1880 to 1900 appears to be a minor resistance
bullish price action is valid even if bars go along lower line of minor pitch fork.
but expecting a good bullish bar soon towards minor resistance
price closing below the lower line of minor pitch fork - SL can be taken

A bull move awaiting hereAbbott India formed a good flag and pole - with all factors necessary to anticipate bullish move.
Present price can be used for call option buying and even intraday cash trade can be taken.
Sector supports too, but as over all market is negative, be quick to book the profits

ELECTCAST LONGLets analyse a stock with wyckoffian 3rd law ..... ..........Volume is the EFFORT and Spread (Price) is the RESULT ............. someone just looking at only price and ignoring ........VOLUME ............ HALF the data thats available for analysis
Wyckoffian 3rd Law also gives importance to HARMONY ( small spread and small volume) .................. ANAMOLY ( small spread with large volume or large spread with small volume ) ...... both are important when we analyse the chart and activity of the COMPOSITE MAN
candle 1 and 5 is harmony and candle 2,3 ,4 are ANAMOLY
candle 1 ... large volume high range candle with breakout , candle 2 was low range but high volume ....... price had a pause for few days ... , candle 3 high range and low volume candle ... manipulation by composite man to shake out weak hands candle 4 ..... high range candle with low volume ....candle 5 ..... again the smart money checking the easy of movement and could get a high range candle with less volume(Less EFFORT ) compared to the breakout volume ....... stock is ready to be marked up
once we understand this Target 1 reached .. calculated by fibonacci extension tool
target 2 can also be calculated


ALANKIT (NSE) STOCK FOR WATCH keep this stock in watchlist looks like forming vcp pattern it will fly good if breakout come with extraordinary volumes

BANCO for swingsAfter absorbing the monthly supply, BANCO is moving up following a VCP(Volume Contraction Pattern). Good to buy every time it retests the newfound demand zone. Keep an eye for the price to not break below demand and form a rollover structure.


Suntv - Double BottomSuntv broken neckline of double bottom with volume and rsi above 60 on daily TF. Targets on chart...

MCDOWELL_N - Round Bottom/Cup and handleMcdowell_N gave trendline breakout with volume and looks like cup and handle pattern too, Targets on chart.
