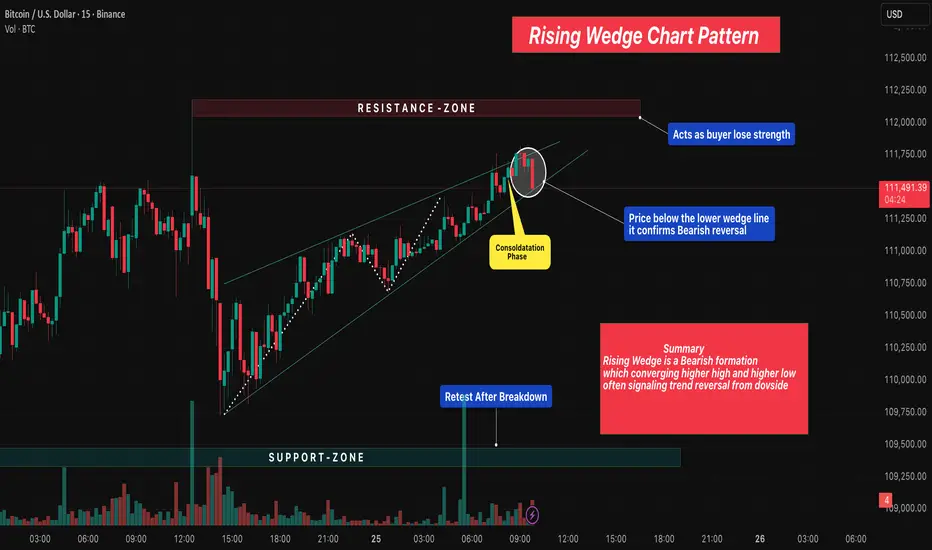
Rising Wedge Chart Pattern 🔎 Overview
The Rising Wedge Pattern is a bearish reversal setup that forms when price moves within a narrowing upward channel — creating higher highs and higher lows that converge toward the top.
It often appears after an uptrend, signaling that bullish momentum is weakening and sellers may soon take control.
As price rises inside the wedge, volume usually decreases, showing fading buyer strength before a potential breakdown .
____________________________________________________________
📔 Concept
• The pattern develops between two converging trendlines sloping upward.
• Each new swing high becomes smaller, showing exhaustion in buyers.
• A break below the lower wedge line confirms the bearish reversal.
• The expected move often equals the height of the wedge projected downward.
____________________________________________________________
📊 Chart Explanation
• Pattern Name → Rising Wedge Chart Pattern
• Resistance Zone → Acts as seller territory where buyers begin losing strength.
• Support Zone → Serves as the final defense; breakdown confirms bearish trend reversal.
• Consolidation Phase → Price compresses within the wedge before breakdown, showing indecision.
• Breakdown Confirmation → When price closes below the lower wedge line, it confirms bearish reversal.
• Retest After Breakdown → Price often retests the wedge from below before continuing downward.
• Summary → Rising Wedge is a bearish pattern of converging higher highs & higher lows, often signaling trend reversal from the upside.
____________________________________________________________
👀 Observation
The Rising Wedge shows weakening bullish pressure as the market climbs with smaller candles and lower volume.
Breakout traders monitor this setup for early reversal opportunities.
The most reliable setups occur near resistance zones or after extended rallies.
____________________________________________________________
💡 Conclusion
A confirmed breakdown below the wedge structure indicates sellers gaining control.
Using proper stop-loss, target projection, and volume confirmation can improve accuracy when trading this reversal formation.
____________________________________________________________
⚠️ Disclaimer
📘 For educational purposes only.
🙅 Not SEBI registered.
❌ Not a buy/sell recommendation.
🧠 Purely a learning resource.
📊 Not Financial Advice.
W-patterns
BRITANNIA INDUSTRIES LTD. – TECHNICAL INSIGHT________________________________________________________________________________
📊 BRITANNIA INDUSTRIES LTD. – TECHNICAL INSIGHT
📆 Date: July 8, 2025 | 🕒 Daily Chart
📍 Symbol: NSE: BRITANNIA
💡 Educational Breakdown – For Study & Learning Only
________________________________________________________________________________
🔹 Price Action Overview:
Britannia closed at ₹5,884.00, up by +1.95%, forming an “Above the Stomach” bullish continuation pattern just below a key resistance zone.
________________________________________________________________________________
🔴 Top Range (Resistance): ₹5,899.50
📉 Bear Strength: 53
The price has approached a previous supply zone where sellers have shown resistance. Watch this level closely for either a breakout or rejection.
________________________________________________________________________________
🟢 Bottom Range (Support): ₹4,506
📈 Bull Strength: 77
This zone acted as a strong demand base in the past, initiating a rally with a sharp volume spike.
________________________________________________________________________________
🔍 Pattern Focus: Above the Stomach
A bullish candle has opened above the midpoint of the previous red candle, suggesting buyer strength. This often signals momentum continuation, especially near breakout levels.
________________________________________________________________________________
🎯 What to Watch For:
✅ Breakout Confirmation Zone:
If price closes decisively above ₹5,900 with volume expansion, it may indicate strength and fresh upside continuation.
________________________________________________________________________________
🚫 Failure Zone:
If price faces rejection near ₹5,900–₹5,920 and forms a bearish engulfing or strong upper wick, short-term profit booking could occur.
________________________________________________________________________________
📌 Risk Management Tip:
Traders typically look for entry above breakout candle high with a stop below recent swing low or candle low. Volume confirmation is essential before considering directional bias.
________________________________________________________________________________
🔍 Contextual Takeaway:
This is a textbook example of price consolidating just below a resistance after a strong trend and forming a bullish candle setup. A breakout or failure here can define the next leg of the move.
________________________________________________________________________________
📚 Stay objective, wait for confirmation, and let the price lead.
________________________________________________________________________________
Entry Above ₹5,905–₹5,920 (on breakout)
Stop Loss ₹5,765
Risk Reward 1:1 | 1:2 +
________________________________________________________________________________
⚠️ Disclaimer:
This analysis is for educational purposes only.
STWP is not a SEBI-registered advisor.
No buy/sell recommendations are made.
Please consult your financial advisor before trading.
STWP is not responsible for trading decisions based on this post.
________________________________________________________________________________
What’s your view on BRITANNIA ? Comment below ⬇️
🔁 Share this if you're tracking the stock
✅ Follow STWP for clean Price Action + Candlestick patterns
🚀 Be Self-Reliant | Trade with Patience | Learn with Logic
________________________________________________________________________________

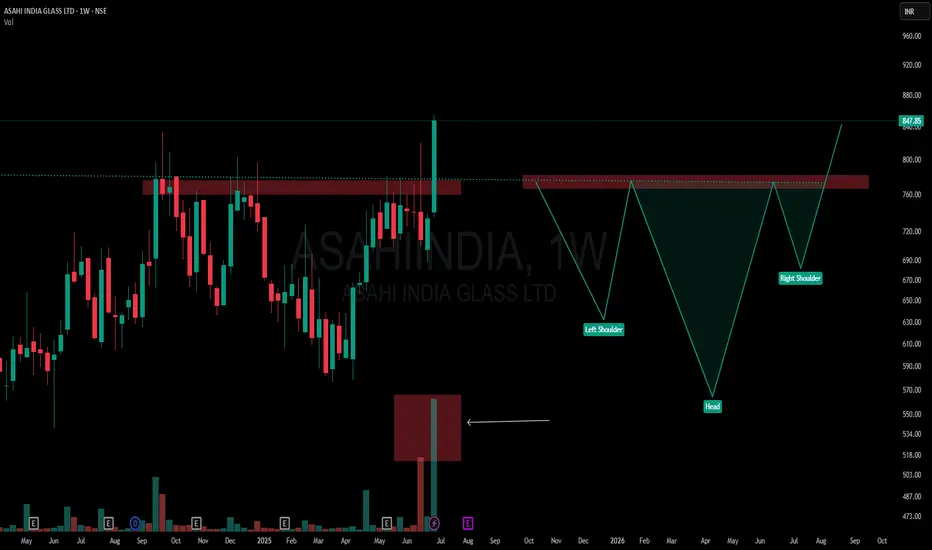
When Textbook Meets Extremes: Perfect Inverted Head and Shoulder📌 ASAHI INDIA GLASS | Weekly Timeframe
🧩 Pattern Breakdown (from a textbook lens):
-Left Shoulder: Formed after the Sept–Nov 2024 rejection
-Head: Created around Feb–May 2025 with a deeper dip
-Right Shoulder: Built through June 2025
-Neckline: ₹750–₹760 zone, tested multiple times
-Breakout Candle: High conviction — wide-bodied, strong close, with 17.61M volume
📘 According to classical technical analysis, Inverted Head & Shoulders patterns often signal a trend reversal. What's notable here is the context — the structure has developed after a sustained move upward, not from a bear phase.
🎯 The candle breaks above a long-standing supply zone with size, volume, and conviction — yet its location at the top makes it structurally interesting and unusual when viewed through traditional pattern psychology.
🚫 This is not a tip, call, or directional bias — just a visual log of structure and volume behavior.
💬 Chart interpretations welcome in comments.
XAU/USD Analysis: Bearish Pullback Towards $3,000 SupportXAU/USD (Gold Spot vs. U.S. Dollar) Technical Analysis - 1H Chart
1. Price Action & Trend Analysis
The market has been in a strong uptrend, characterized by higher highs and higher lows.
Recently, the price faced resistance near the $3,040 level, leading to a rejection.
A pullback is currently in progress, suggesting a possible retracement to a demand zone.
2. Key Levels
Resistance Zone (Supply Zone): Around $3,040 - $3,045 where price has been rejected multiple times.
Support Zone (Demand Zone): Around $3,000 - $3,005, a previous accumulation area.
Current Price: $3,023.695
3. Market Structure & Expected Move
The price tested the resistance zone, failed to break above, and is now reacting downward.
A bearish projection (as shown in the chart) suggests a potential move toward the $3,000 - $3,005 support zone.
If the price reaches this level and finds buying pressure, we could see a reversal or continuation of the uptrend.
4. Indicators & Confluence Factors
Support-Resistance Flip: The previous support at $3,000 could act as a strong support again.
Bearish Momentum: Short-term price action suggests sellers are gaining control after rejection at resistance.
Liquidity Zones: The highlighted purple zones represent institutional order blocks where significant buy/sell orders exist.
5. Trading Plan & Strategy
Bearish Scenario: If price breaks below $3,000, we could see further downside pressure.
Bullish Scenario: A bounce from $3,000 could provide buying opportunities for another attempt at breaking $3,040.
6. Conclusion
The market is currently retracing from resistance, and a short-term bearish move is expected toward $3,000.
Traders should watch for price reaction at $3,000 to determine if it holds as support or breaks for further downside.

Gold On Monday💡Gold could breach $3,000 level soon, analyst says
💡Trumpdeclinedto predict if U.S. could face a recession
💡U.S. CPI data on Wednesday, PPI data on Thursday
15-Minute Chart Analysis
Key Zones:
Order Block (OB) at $2,895 - $2,900 – Strong demand zone
Order Block (OB) at $2,925 - $2,930 – Strong supply zone
Fair Value Gap (FVG) at $2,918 - $2,922 – Potential retracement area
📊Price Behavior:
Price is currently consolidating below the FVG area, which often acts as a magnet for price action.
📊 Conclusion: A potential bullish move may occur if price reclaims the FVG zone, targeting the OB at $2,925. Conversely, a break below $2,895 may trigger further downside pressure.
🔍1-Hour Chart Analysis
Key Resistance Levels:
$2,924 – Immediate resistance zone
$2,942 – Strong resistance with previous rejection
Key Support Levels:
$2,879 – Key support zone
$2,863 – Critical support below
Price Behavior: The market is moving in a consolidation phase, with multiple rejections from the resistance at $2,924.
Conclusion: The market is currently indecisive, consolidating between $2,900 and $2,924. A breakout in either direction may signal the next move.
🔍 4-Hour Chart Analysis
Key Resistance Levels:
$2,954 – Significant resistance zone
Key Support Levels:
$2,880 – Intermediate support
$2,846 – Major support zone
Market Condition: The market is clearly in a ranging phase between $2,880 and $2,925. This suggests indecision and a potential breakout on either side.
Conclusion: The range-bound structure favors breakout strategies. Monitoring volume and price action near these levels is crucial.
Trading Strategy Considerations
📌 Bullish Scenario
✅Wait for a breakout above $2,924 with strong volume confirmation.
📍Target: $2,942 or higher.
❌Stop Loss: Below $2,911 to manage risk.
📌 Bearish Scenario
✅Watch for a rejection at $2,924 or a breakdown below $2,900.
📍Target: $2,880 or lower.
❌Stop Loss: Above $2,924 for protection.
👉 Always follow TP/SL to protect your capital and maximize profits!
Stay tuned for updates once the confirmations are in place!
Please support me with your likes and comments to motivate me to share more analysis with you and share your opinion about the possible trend of this chart with me !
📢Best Regards , Silver Wolf Traders Community
Disclaimer: This is for educational purposes only.
Always trade responsibly and manage your risk effectively

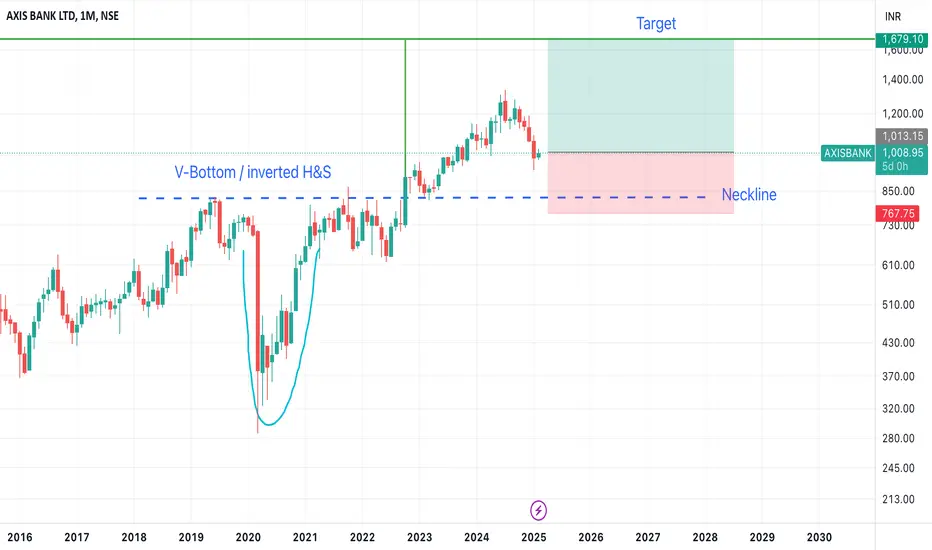
Long term: V bottom / Inverted H&SLong term: V bottom / Inverted H&S
- Stock didn't have strong momentum and had a channel resistance
- Pattern target is yet to reach
- Long term position (3-5 years)
PNB, Intraday View for 7-JuneThe price is rejected by the LTMA band.
The probability of a red candle is high, more than 60% on the probability scale.
The level of 120.75 is important to consider for tomorrow's intraday trade.
Disclaimer : This is my pre market analysis and my trading journal. Not a suggestion to buy or sell.

GENCON - DAILY CHART DOUBLE PATTERNA "Double Bottom" is a technical analysis chart pattern frequently observed in financial markets, such as stocks, commodities, and forex. This pattern is considered a bullish reversal pattern, indicating that an ongoing downtrend might be coming to an end and a new uptrend could be emerging.
The Double Bottom pattern consists of two distinct downward price movements followed by a reversal. Here's how it typically forms:
Initial Downtrend: The price of the asset is in a downward trend, indicating a bearish sentiment. This phase represents the first leg down.
First Low: The price reaches a low point and then experiences a minor upward correction. This forms the first low point of the pattern.
Second Downtrend: After the first upward correction, the price resumes its downward movement, usually not reaching the previous low. This second decline is typically on lighter volume compared to the initial downtrend.
Second Low: The price finds support at a level close to the previous low but doesn't break below it. This forms the second low point of the pattern. At this stage, buyers are stepping in to prevent the price from falling further.
Reversal Confirmation: Once the price starts moving upwards from the second low and breaks through a certain resistance level (often a "neckline" drawn through the highs between the two lows), it confirms the pattern's completion. This breakout is seen as a bullish signal, suggesting a potential trend reversal.
Traders and analysts often use the depth between the lowest point of the pattern and the neckline to estimate a potential price target for the subsequent uptrend.
However, it's important to note that not all double bottom patterns result in successful reversals. Like any technical analysis pattern, false signals can occur, and it's advisable to use additional indicators and analysis to confirm the pattern's validity.
As with any trading or investment strategy, it's crucial to combine technical analysis with fundamental analysis and risk management to make well-informed decisions.
Note:
This chart analysis is only for reference purpose.
This is not buying or selling recommendations.
I am not SEBI registered.
Please consult your financial advisor before taking any trade.

LAURUS LABSDisclaimer: Iam not sebi registered, trade at your own risk take your financial advisor for buy sell recommendation, this is ony for educational purpose.

Is something Big Brewing Next Week ? Nifty has given a breakout from inverted H&S and also forming a cup and handle.
Inverted H&S target : 20050
Cup and Handle Breakout - 19840 level
Target : 20300++

BTCUSD | D TF | ANALYSIS elliott wave.Time for a retracement? in this snapshot, btc completed 5th impulsive wave now its time for corrective wave. am expecting 25k.
Elliott Wave Theory: What It Is and How to Use It
What Is the Elliott Wave Theory?
The Elliott Wave Theory in technical analysis describes price movements in the financial market. Developed by Ralph Nelson Elliott, it observes recurring fractal wave patterns identified in stock price movements and consumer behaviour. Investors who profit from a market trend are described as riding a wave.
How Elliott Waves Work,
Some technical analysts profit from wave patterns in the stock market using the Elliott Wave Theory. The theory assumes that stock price movements can be predicted because they move in repeating up-and-down patterns called waves created by investor psychology or sentiment.
The theory is subjective and identifies two different types of waves: motive or impulse waves, and corrective waves. Wave analysis does not equate to a template to follow instructions. Wave analysis offers insights into trend dynamics and helps investors understand price movements.
Impulse and corrective waves are nested in a self-similar fractal to create larger patterns. For example, a one-year chart may be in the midst of a corrective wave, but a 30-day chart may show a developing impulse wave. A trader with this Elliott wave interpretation may have a long-term bearish outlook with a short-term bullish view.
Impulse Waves
Impulse waves consist of five sub-waves that make net movement in the same direction as the trend of the next-largest degree. This pattern is the most common motive wave and the easiest to spot in a market. It consists of five sub-waves, three of which are motive waves. Two are corrective waves.
Elliott Wave Theory
Image by Julie Bang © Investopedia 2020
Labelled as a 5-3-5-3-5 structure:
Wave 2 cannot retrace more than 100% of the first wave
The third wave can never be the shortest of waves 1, 3, and 5
Wave 4 can't go beyond the third wave at any time
If one rule is violated, the structure is not an impulse wave. The trader would need to re-label the suspected impulse wave.
Corrective Waves
Corrective waves, called diagonal waves, consist of three, or a combination of three sub-waves that make net movement in the direction opposite to the trend of the next-largest degree. Its goal is to move the market in the direction of the trend.
The corrective wave consists of 5 sub-waves.
The diagonal looks like either an expanding or contracting wedge.
The sub-waves of the diagonal may not have a count of five, depending on what type of diagonal is being observed.
Each sub-wave of the diagonal never fully retraces the previous sub-wave, and sub-wave 3 of the diagonal may not be the shortest wave.
Elliot Wave Theory vs. Other Indicators
Elliott recognized that the Fibonacci sequence denotes the number of waves in impulses and corrections. Wave relationships in price and time also commonly exhibit Fibonacci ratios, such as 38% and 62%. For example, a corrective wave may have a retrace of 38% of the preceding impulse.
1
Elliott Wave Oscillator Chart
Elliott Wave Oscillator Chart.
Other analysts have developed indicators inspired by the Elliott Wave principle, including the Elliott Wave Oscillator Chart. The oscillator provides a computerized method of predicting future price direction based on the difference between a five-period and a 34-period moving average. Elliott Wave International’s artificial intelligence system, EWAVES, applies all Elliott wave rules and guidelines to data to generate automated Elliott wave analysis.
2
What Is the Elliott Wave Theory?
In technical analysis, the Elliott Wave theory looks at long-term trends in price patterns and how they correspond with investor psychology. These price patterns or ‘waves’ depend on rules developed by Ralph Nelson Elliott in the 1930s. They identify and predict wave patterns within stock markets and help predict future movement.
1
How Do Elliott Waves Work?
There are different waves, or price formations, from which investors can glean insight. Impulse waves include an upward or downward trend that carries five sub-waves that may last hours or even decades. They possess three rules: the second wave cannot retrace more than 100% of the first wave; the third wave can never be the shortest of waves one, three, and five; wave four cannot ever surpass the third wave. There are also corrective waves, which fall in patterns of three.
How Do You Trade Using Elliott Wave Theory?
If a trader sees a stock moving on an upward trend on an impulse wave, they may go long on the stock until it completes its fifth wave. Anticipating a reversal, the trader may then go short on the stock. Underlying this trading theory is the idea that fractal patterns recur in financial markets. In mathematics, fractal patterns repeat themselves on an infinite scale.
The Bottom Line
The Elliott Wave Theory was developed by Ralph Nelson Elliott. It provides a technical analysis of price patterns related to changes in investor sentiment and psychology. The theory identifies impulse waves that establish a pattern and corrective waves that oppose the larger trend. It assumes that stock price movements can be predicted because they move in repeating up-and-down patterns.
Correction—May 5, 2023: This article has been amended to state that the third impulse wave can never be the shortest of waves one, three, and five.

Long- Nifty Infra Broadening Wedge FormationNifty Infra:
The Index was consolidating from April' 09 - Feb' 21 within a channel of 2164-3729 as upper and lower bounds respectively. After Feb'21 the index broke out from it's 12 year consolidation and had a steep surge to 5381 levels as 42.54% gain within a year on monthly charts.
Since January 2022, the index has been forming a Broadening Wedge Pattern in an uptrend and is near its crucial resistance of 5173 where it has faced some supply pressure.
The readings from indicators and Trendline support and resistance levels shows that index may breakout from from the upper bound of 5100 on trendline where it has faced selling pressures since 8 months now and the rally may take this index to 6046 levels within a year with a 20+% gain. The trend looks strong but keeping in mind any headwinds if supply side pressure continues in next month the index will again return to it's movement in the broadening wedge with 4200-5100 as upper and lower bounds respectively.
//For Research and Educational Purpose only

1 Support and 1 Breakout trade idea for 26 July Markets I daily make educational content videos for swing / positional trading

1 Good swing trading idea for 27 june markets I daily make educational content videos for swing / positional trading

2 Amazing weekly time frame breakouts for 19 June marketsI daily make educational content videos for swing / positional trade ideas

Heg weekly and monthly time frame analysis I daily make educational content videos for swing / positional trading

INDIA CEMENTSPossible bottom formation in the stock INDIA CEMENTS , with chart making a higher low cleary showing new buyers coming inthe stock looks good to be bought above the resistance levels of 190-195 for targets of 215/230 in coming days . PS : Price has to breakout above and sustain above the resistance , view changes if breakout fails

Pcbl breakout trade idea for swing trading I daily make educational content videos for swing trading

DOW JONES INDUSTRIAL AVERAGE GO SHORT.Simple explanation of Huge rally would be sufficed with big drop or at least some downward momentum.

As 'Above' so 'Below' - the harmony of natureIn this real world, there is various philosophy that tries to explain the "As above, so below" harmony is the great law of nature but none can prove this law hence it's still a hypothesis.
The law of nature works on everything and the stock market is not untouched by nature.
I am not here to give a lecture on this law of nature but to prove how this harmony of nature is preserved in the stock market and to share my research work on 'Stock-et' science which is equally difficult as 'Rocket' science.
Many of you have heard of these famous patterns:-
'Head and Shoulder'
'Cup and Handle'
'Rounding Top/Bottom'
'Flag/Pennant'
'Double Top/Bottom'
Do you all observe some correlation among them?
They all are candlestick patterns that either decide reversal or continuation, if this was your observation then probably you are correct but I wasn't indicating this.
Let me explain to you what kind of relationship I was talking about.
How do we estimate the target of these patterns? To the target level, we first measure the depth of the pattern i.e. how deep it's below the breakout level.
As its depth is below so will the height above.
Now, I think you all can draw how this law of nature is respected here in the candlestick pattern or more precisely in the stock market.
Let’s have an example to be more sound:-
The above chart describes how the CUP pattern works following this law of nature.
The stock after the breakout rallied non-stop to attain the e height of +94% which was the depth of the cup pattern.
After attaining the target or say 'equilibrium' stock witnessed a jerk, not before that.
This proves how the market preserves "As above, so below" harmony, the great law of nature.
Still not convinced then look to another example,
This is the vice-versa of the previously explained example, here stock attains the depth of -17% i.e. ' equilibrium' after forming a Head and Shoulder pattern with a height of shoulder +17%.
This proves how the market preserves "As below, so above" harmony, the great law of nature.
Now let's look at this concept with different dimensions i.e. dimensions of mathematics, physics, and chemistry.
Don’t be afraid I'm not going to talk about 'rocket' science but 'stock-et' science.
[list [
In math, we all have read negative and positive cancels out i.e. (-3+3=0) same in candlestick patterns if the stock has a pattern depth of then the pattern target would be +30% to attain '0' or say 'equilibrium'.
In physics, we all have read that negative charges neutralize the positive charge to attain 'equilibrium' same in the stock market.
In chemistry, we all have read that all chemical changes occur in nature to attain 'equilibrium' i.e. two elements share their electrons to attain 'stability' (H2O, here two hydrogen molecules share their 1 electron with 6 electrons of oxygen to attain equilibrium) this same happens in markets all market movements occur to attain 'stability'.
Generally, people have fantasies about 'Rocket' science but we traders have fantasies about 'Stock-et' science.
Please drop comments on whether you have a fantasy for any of the above science.
Also, let me know how many of you believe that the stock market doesn't work on speculation but has its science
let's call it 'Stock-et' science.

2 Amazing pattern based swing trades for 9 Feb I daily make educatioanl content videos for financial markets on swing trading

Elliotical Approach to US30 Short.Hello Traders!
1. The US30 market is on the verge of completing its 2nd wave of Wave C of the complex correction as originally published in a prior idea (link attached).
2. We see an ending diagonal forming in the 1hr tf at the moment.
3. Also, wave 4 often divides an impulse into harmonic ratios. There can be that possibility with the division of 61.8% and 38.2% (total 100%). We take this possibility into picture because we also have the retracement level of 78.6% of wave 1 at almost the same level.
4. What is an invalidation level ? It is the level at which are analysis will have been wronged. So, in this case, if US30 market goes above 34950, our analysis will be wronged and we will have to look for a new picture. That's how accurate Elliot Wave Theory is!
5. Clearer targets will be available when we have a clear impulse down.
Do use proper risk management.
Happy Trading!
Profits,
Market's Mechanic.

My Approach to USDJPY Long.Hello Traders!
1. I see a potential head and shoulder on the USDJPY chart.
2. It's still a pattern in the making and hence makes it a bit of a risky trade but definitely worth a shot as the market stands on a major support on the daily TF and has been consolidating in the region for quite some time now.
3. Also, as per my trade, we are entering at the very low of the zone, thus reducing our risk significantly .
Do use proper risk management.
Happy Trading!
Profits,
Market's Mechanic.
