Indian Trading Market Reports: Trends and PerformanceStructure of the Indian Trading Market
India’s trading market is primarily driven by its two major stock exchanges: the National Stock Exchange (NSE) and the Bombay Stock Exchange (BSE). These exchanges facilitate trading in equities, derivatives, currencies, and commodities. Equity markets form the backbone of trading activity, while derivatives such as futures and options contribute significantly to daily volumes, particularly in indices like NIFTY 50 and BANK NIFTY.
Market reports usually begin by outlining index performance. Benchmark indices such as the NIFTY 50, Sensex, NIFTY Bank, and sectoral indices are closely monitored to gauge overall market sentiment. A rising index typically reflects optimism and economic strength, while a declining index may signal caution, uncertainty, or external pressures.
Role of Market Reports in Trading
Indian trading market reports act as a bridge between raw market data and actionable insights. They consolidate vast amounts of information—price movements, volumes, volatility, and technical indicators—into a structured narrative. These reports help traders identify trends, key support and resistance levels, momentum shifts, and potential breakout or breakdown zones.
For investors, market reports provide a broader view of economic health, corporate earnings, and policy developments. Long-term participants rely on these reports to assess valuation levels, sector rotation, and growth opportunities. In essence, trading market reports transform complex market behavior into understandable analysis.
Market Trends and Sentiment Analysis
A major component of Indian trading market reports is trend analysis. Trends can be short-term (intraday or weekly), medium-term (monthly), or long-term (yearly). Reports often highlight whether the market is in an uptrend, downtrend, or consolidation phase.
Sentiment analysis is equally important. Indian markets are influenced by both domestic and global cues. Positive sentiment may arise from strong GDP growth, declining inflation, stable interest rates, or robust corporate earnings. Negative sentiment can be triggered by geopolitical tensions, global market sell-offs, rising crude oil prices, or currency volatility.
Market reports frequently classify sentiment as bullish, bearish, or neutral, helping traders align their strategies accordingly.
Sectoral Performance Insights
Indian trading market reports place strong emphasis on sectoral analysis. Sectors such as banking, information technology, pharmaceuticals, metals, energy, FMCG, and infrastructure are tracked individually. Sectoral indices reveal where money is flowing and which areas are under pressure.
For example, strong performance in banking and financial stocks often indicates confidence in economic growth and credit expansion. A rally in IT stocks may be driven by currency depreciation or strong global demand. Conversely, weakness in metal stocks could reflect declining global commodity prices or reduced industrial demand.
By studying sectoral trends, traders can identify leadership sectors and laggards, enabling better capital allocation and risk management.
Derivatives and F&O Market Overview
Derivatives play a significant role in Indian trading, and market reports dedicate special sections to futures and options (F&O) data. Open interest, option chain analysis, put-call ratios, and rollover data are commonly analyzed.
These indicators help traders understand institutional positioning and market expectations. High call open interest at a particular strike price may indicate resistance, while high put open interest can suggest support. Changes in open interest along with price movements reveal whether positions are being built or unwound.
F&O insights are especially valuable for short-term traders who rely on volatility and momentum.
Influence of Macroeconomic Factors
Indian trading market reports closely track macroeconomic variables such as inflation, interest rates, fiscal deficit, industrial production, and trade data. Announcements by the Reserve Bank of India (RBI), Union Budget, and government policy reforms have immediate and sometimes long-lasting impacts on the market.
Global factors also play a vital role. Movements in US markets, Federal Reserve decisions, crude oil prices, and global risk sentiment significantly influence Indian markets. Market reports integrate these factors to explain sudden spikes or declines in prices.
Technical and Fundamental Perspectives
A comprehensive Indian trading market report balances both technical and fundamental analysis. Technical analysis focuses on charts, indicators, patterns, and price action to forecast short-term movements. Fundamental analysis evaluates company earnings, balance sheets, management quality, and growth prospects to assess intrinsic value.
By combining both approaches, reports cater to a wide range of market participants—from day traders to long-term investors.
Risk Factors and Volatility
Volatility is an inherent part of trading, and Indian market reports emphasize risk awareness. Sudden news events, policy changes, or global shocks can increase volatility sharply. Reports often include volatility index (India VIX) analysis to indicate expected market fluctuations.
Understanding risk factors helps traders position themselves prudently, use stop-loss strategies, and avoid emotional decision-making.
Future Outlook and Conclusion
Indian trading market reports usually conclude with a forward-looking outlook. This section highlights key levels to watch, upcoming economic events, earnings schedules, and potential risk triggers. While no report can predict the market with certainty, a well-structured outlook prepares traders for multiple scenarios.
In conclusion, Indian trading market reports are indispensable tools in today’s fast-moving financial environment. They provide clarity, structure, and perspective amid market noise. By analyzing trends, sectors, derivatives, and macroeconomic factors, these reports empower market participants to make informed, disciplined, and strategic trading decisions.
Wave Analysis
Smart Money SecretsHow Institutional Investors Really Win in Financial Markets
In financial markets, the term “smart money” refers to capital controlled by institutions, professional traders, hedge funds, banks, and experienced investors who possess deep knowledge, superior resources, and disciplined strategies. Unlike retail traders, smart money does not chase headlines or react emotionally to short-term price fluctuations. Instead, it moves markets quietly, strategically, and with a long-term perspective. Understanding smart money secrets can help individual traders and investors align themselves with market strength rather than fight against it.
Understanding Who Smart Money Is
Smart money represents participants with access to advanced research, large capital, insider-level understanding of market mechanics, and professional risk management systems. These include mutual funds, pension funds, insurance companies, proprietary trading desks, and seasoned investors. Their decisions are not impulsive; they are based on data, probability, and macro-to-micro analysis. While retail traders often focus on indicators alone, smart money focuses on price behavior, liquidity, and market structure.
Smart Money Thinks in Probabilities, Not Predictions
One of the biggest secrets of smart money is that it never tries to predict the market with certainty. Instead, it operates on probabilities. Every trade is viewed as a calculated risk where losses are controlled and profits are allowed to grow. Smart money accepts losses as part of the game and avoids emotional attachment to any single position. This mindset allows institutions to survive long-term, even through volatile market conditions.
Liquidity Is the Real Target
Smart money does not enter or exit trades randomly. It seeks liquidity—areas in the market where many orders are placed, such as stop-loss zones above resistance or below support. These zones provide enough volume for large players to enter or exit positions without causing extreme price disruption. Many sudden price spikes or sharp reversals occur because smart money is collecting liquidity from retail traders who place predictable stop losses.
Market Structure Over Indicators
Retail traders often overload charts with indicators, while smart money primarily studies market structure—higher highs, lower lows, break of structure (BOS), and change of character (CHOCH). Institutions analyze how price moves from one liquidity zone to another. Indicators may lag, but structure reveals the true intent of price movement. Smart money enters trades during consolidation phases and exits during expansion phases, when retail traders are just entering.
Accumulation and Distribution Phases
A key smart money secret lies in understanding accumulation and distribution. During accumulation, institutions quietly build positions while price moves sideways and volatility remains low. Retail traders often get bored and exit during this phase. Once accumulation is complete, price expands rapidly, attracting retail participation. At the top, smart money distributes its holdings while retail traders buy aggressively, believing the trend will continue forever.
Time Is a Strategic Weapon
Smart money is patient. It can wait weeks, months, or even years for the right opportunity. Retail traders, on the other hand, often feel pressure to trade daily. Institutions understand that not trading is also a position. They focus on high-quality setups aligned with broader trends rather than constant activity. This patience allows smart money to enter at optimal prices and avoid unnecessary losses.
Risk Management Is Non-Negotiable
Another powerful secret is strict risk management. Smart money never risks a large percentage of capital on a single trade. Position sizing is calculated precisely, ensuring survival even during losing streaks. Institutions focus more on capital preservation than on making quick profits. This approach allows compounding to work over time, which is the true source of long-term wealth in markets.
Emotions Are Removed From Decisions
Smart money operates through systems, rules, and predefined strategies. Emotional trading—driven by fear, greed, or revenge—is eliminated as much as possible. Decisions are made before entering a trade, including entry, stop-loss, and exit points. Retail traders often react emotionally to market noise, while institutions remain calm and disciplined.
News Is Used, Not Followed
While retail traders often react to news events, smart money prepares in advance. Institutions understand that markets often price in news before it becomes public. By the time headlines appear, smart money may already be exiting positions. News is used as a liquidity event rather than a signal to enter blindly. This is why markets sometimes move opposite to expectations after major announcements.
Following Smart Money Instead of Fighting It
The most valuable lesson for retail traders is not to compete with smart money, but to align with it. This means trading with the trend, respecting key levels, understanding volume and price behavior, and avoiding overtrading. Observing how price reacts at support and resistance, how breakouts behave, and where false moves occur can offer clues to smart money activity.
Conclusion: Turning Knowledge Into Advantage
Smart money secrets are not about hidden tricks or insider information; they are about discipline, patience, structure, and risk control. Institutions win because they think differently, manage risk professionally, and understand how markets truly function. Retail traders who adopt these principles—focusing on probability, liquidity, market structure, and emotional control—can dramatically improve their performance.
Ultimately, the goal is not to outsmart smart money, but to trade alongside it. When you stop chasing the market and start understanding how and why price moves, you shift from being liquidity for smart money to becoming a more informed and strategic market participant.

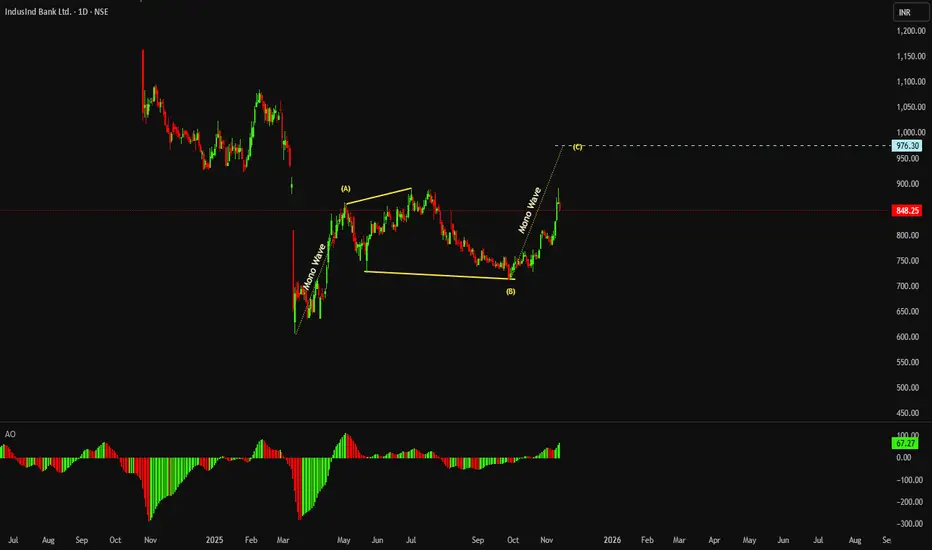
Mono Wave In This Chart Pattern Example I have Visually Represented Mono Wave identification
Friends its Important to note the behavior of Price along the side of its movement is
important , as a single strong move on daily suggest the movement is Mono Wave or Representation of fast displacement of price
Now its also important to note which part of the move is not having the character of Mono wave
That part should be considered as time consuming pattern or ideally know as correction in between the momentum
They also represent the expansion making new high with evidence of weak price move
suggesting its an weak move before the required time bond correction complete
This is education content
I hope you like it if you do then please hit the like button stay tuned subscribe to get more such content
Good luck
Elliott Wave Structure - classic 5-wave impulse cycleWave 1
2016 → 2017 move (up to ~19k)
Wave 2
2018 crash (~3k)
Wave 3
2018 → 2021 rally (~69k)
Wave 4
2021 → 2022 bear market (~15.5k)
Wave 5 (current)
2023 → now (~115k+ structure)
Everything inside Wave 5 = lower timeframe waves, not new major waves.
Based on this count + Fibonacci relationships:
Conservative:
Wave 5 = Wave 1 → ~125k–135k
Moderate:
Wave 5 = 0.618 of (1–3) → ~145k–165k
Aggressive blow-off:
Extension → 180k–210k zone
✔ Wave 1 → first impulsive breakout (2016–2017)
✔ Wave 2 → deep 2018 correction
✔ Wave 3 → strongest expansion into 2021 top
✔ Wave 4 → complex sideways 2022 correction
✔ Wave 5 → current impulsive leg from 2023 onward
Inside Wave 5:
5(i) impulsive leg to ~45k
5(ii) deep retrace to ~25k
5(iii) strong rally to ~110k
5(iv) current correction near ~90–95k
5(v) still pending → projected higher high
Using conservative fib extensions:
If Wave 1–3 range ≈ 150 → 69,000
Projecting Wave 5 from 15,500 low:
Extension Target
0.618 ~$108,000 (already touched)
1.0 ~$135,000
1.272 ~$158,000
1.618 ~$190,000–$210,000
📌 High-probability Wave 5 top zone:
$135k – $190k
Elliott law is strict:
After 5-wave impulse → ABC correction comes
Which historically means:
60–85% retracement
That would imply:
If top is $160k → bear market back to $50k–$70k zone later
Not immediately, but after euphoria phase.
🧠 Psychology Check (matches Elliott perfectly)
Phase Public Emotion
Wave 3 "Bitcoin is the future"
Wave 4 "Crypto is dead"
Wave 5 "BTC to $1 million" (media hype, influencers explode)
After Crash + depression
We are entering early mass hype phase of Wave 5, not the final blow-off yet.

Elliott Wave Analysis XAUUSD – January 16, 2025
Momentum
Daily (D1)
– Daily momentum is currently showing signs of weakening and turning lower.
– Yesterday’s daily candle has not yet confirmed this reversal; therefore, we still need to wait for today’s daily close.
– If the D1 momentum reversal is confirmed, a bearish trend lasting at least several daily candles is expected.
H4
– H4 momentum is currently declining; therefore, the bearish bias on the H4 timeframe remains valid.
– Price is likely to continue moving lower until H4 momentum reaches the oversold zone.
H1
– H1 momentum is preparing to reverse to the upside.
– As a result, a short-term technical rebound on the H1 timeframe can be expected.
Wave Structure
Daily (D1) Wave Structure
– On the D1 timeframe, a complete 5-wave impulse structure (1–2–3–4–5, marked in blue) is visible, with price currently trading within wave 5 (blue).
– The length of wave 5 (blue) is currently positioned between the 0.5 and 0.618 Fibonacci retracement of wave 1–3 (blue).
– At the same time, wave 5 is approximately equal in length to wave 1 (blue).
– Combined with the weakening and potential reversal of D1 momentum, this confluence suggests that the top of wave 5 is likely forming.
– After wave 5 completes, price is expected to decline in line with the D1 momentum reversal.
H4 Wave Structure
– The D1 wave 5 (blue) is subdivided into a smaller 5-wave structure (1–2–3–4–5, marked in yellow) on the H4 timeframe.
– Price is currently trading within wave 5 (yellow).
– Wave 5 (yellow) shows signs of extension, with its length approximately equal to wave 1–3 (yellow), and price has already reached the upper boundary of the ascending channel.
– In addition, the price structure near the top suggests that a Head and Shoulders pattern is forming.
– H4 momentum has already reversed to the downside, and once H4 momentum moves into the oversold zone, price is expected to break below the neckline drawn on the H4 chart.
H1 Wave Structure
– On the H1 timeframe, price is currently moving sideways for an extended period, creating a noisy and corrective structure.
– Based on the Volume Profile, price is trading within a liquidity zone between 4581 and 4640.
– At the moment, price is concentrated in the 4581 – 4621 liquidity area and is trading below the green POC line, indicating that sellers are temporarily in control.
– The current H1 momentum rebound is very important.
– If H1 momentum moves into the overbought zone but price fails to break above 4621, this area will be considered a valid sell opportunity.
Trading Plan
– Sell Zone: 4611 – 4613
– Stop Loss: 4631
– Take Profit 1: 4520
– Take Profit 2: 4473
– Take Profit 3: 4317
– The main downside target is the D1 wave 4 (blue) area around 4317, which is typically the level price retraces to following a completed 5-wave impulse.

What is the Best Location / Area to Take a trade in the Markets I make educational content videos for trading
In this video I am sharing my experience on which areas are the best to trade with simple Price action using older than 3 months charts

Part 4 Learn Institutional TradingRisk in Option Trading
1. For Buyers
Time decay
Sudden volatility drop
Wrong direction → total premium loss
2. For Sellers
Unlimited loss on naked selling
Requires high margin
Needs strict risk management

Part 3 Learn Institutional TradingOptions vs Futures
Feature Options Futures
Obligation No (buyer), Yes (seller) Yes
Risk Buyer limited Unlimited
Capital Low Higher
Strategies Very flexible Limited

Part 2 Ride The Big Moves Option Trading Psychology
Avoid emotions
Don’t overtrade
Keep strict stop-loss
Avoid averaging when wrong
Follow market structure
Learn volume profile & volatility patterns
Success in options comes from discipline, not luck.

Part 2 Technical Analysis vs. Institutional Option TradingPut Options (PE) – Explained
A Put Option gives the buyer the right to sell the underlying asset at the strike price.
Why Buy a Put Option?
You buy a put when you expect the price to fall.
Example:
BANKNIFTY is at 49,000
You buy 49,000 PE @ ₹120
If BANKNIFTY falls to 48,500:
Intrinsic value = 49,000 – 48,500 = 500
Profit = 500 – 120 = ₹380 x lot size
If BANKNIFTY stays above 49,000:
Put expires worthless
Loss = ₹120 premium
Why Sell a Put Option?
You sell a put when you expect market to stay above strike.
Put Seller View:
Market will rise OR stay sideways
Premium will decay with time

XAUUSD H1 – Range Bound MarketSideways Consolidation, Waiting for a Range Break
Gold on the H1 timeframe is currently trading inside a clear sideways range near the ATH, showing signs of balance after the recent impulsive move. At this stage, the market is not trending — it is building liquidity and waiting for a breakout.
MARKET STRUCTURE
Price is consolidating inside a wide sideways box after failing to continue higher from the ATH.
Multiple rejections on both sides of the range confirm that neither buyers nor sellers have full control yet.
This behaviour typically appears before a volatility expansion.
KEY ZONES & LIQUIDITY
Upper range – Resistance / Breakout trigger:
~4620 – 4640
Acceptance above this zone would signal renewed bullish strength and open the path toward new highs.
Mid-range equilibrium:
Current price is hovering around the balance area, where false signals are common. Patience is required here.
Lower range – High liquidity support:
~4580 – 4590
This zone has absorbed selling pressure multiple times. A clean reaction here could support a bounce back into the range.
Deeper liquidity support:
~4515 – 4520
If the range breaks to the downside, this is where strong demand and liquidity are likely to sit.
SCENARIOS TO WATCH
Bullish breakout scenario:
Price holds above the lower range and breaks cleanly above 4620–4640.
Acceptance above the range confirms continuation toward new ATH levels.
Bearish liquidity sweep scenario:
Price sweeps below 4580–4590, tapping deeper liquidity.
A failure to reclaim the range would shift short-term bias to the downside.
SUMMARY
Current state: Sideways / consolidation
Market is compressing and building liquidity
Best trades come after the range breaks, not inside it
Let price show direction before committing
In this environment, discipline matters more than activity — wait for the breakout, and trade the reaction, not the noise.

The next multibagger in the making - WAAREE RENEWABLE TECHConsider only for long term investment , given the current financial and technical position of this company right now , its about to gain traction in the coming months. Let's see how it performs in the years to come! , looks good for long term investors.

XAUUSD No breakout today, only liquidity and structure🟡 XAUUSD – Intraday Smart Money Plan
📈 Market Context
Gold remains structurally bullish on the higher timeframe (HTF), but intraday price action is currently transitioning into a controlled corrective phase after buy-side liquidity has already been delivered.
With ongoing USD volatility, U.S. yield fluctuations, and Fed rate-cut speculation, Smart Money is not pushing aggressive continuation today. Instead, price is being engineered around premium and discount liquidity zones.
Ahead of U.S. macro events, Gold is behaving typically near extremes:
inducement → liquidity sweep → mean reversion, rather than impulsive trend extension.
🔎 Technical Framework – Smart Money Structure (H1–M15)
Current Phase:
HTF bullish bias remains intact, while intraday structure shows rotation and consolidation following the completion of buy-side liquidity grabs.
Key Idea:
• Look for short opportunities from premium supply
• Or long re-entries from discount demand aligned with the higher-timeframe trend
Structural Notes:
• HTF BOS confirms bullish dominance
• Buy-side liquidity already taken
• Price is rotating, not expanding impulsively
• Internal FVG acting as a downside magnet
• Discount demand aligns with prior order block (OB) support
💧 Liquidity Zones & Trade Ideas
🔴 SELL GOLD 4618 – 4620 | SL 4628
🟢 BUY GOLD 4578 – 4576 | SL 4568
🧠 Institutional Flow Expectation
Liquidity sweep → MSS / CHoCH → BOS → displacement → OB/FVG retest → expansion
🎯 Execution Rules
🔴 SELL GOLD 4618 – 4620 | SL 4628
Entry Conditions:
✔ Price taps premium supply
✔ Buy-side liquidity taken above recent highs
✔ Bearish MSS / CHoCH on M5–M15
✔ Clear downside BOS
✔ Entry via bearish FVG or supply OB
Targets:
• 4595 — internal reaction
• 4578 — liquidity pool
• Trail aggressively (distribution setup)
🟢 BUY GOLD 4578 – 4576 | SL 4568
Entry Conditions:
✔ Liquidity sweep into discount demand
✔ Confluence with OB + FVG
✔ Bullish MSS / CHoCH on M5–M15
✔ Strong upside BOS with displacement
✔ Entry via refined bullish order block
Targets:
• 4618 – 4620 — first reaction
• 4670 — internal liquidity
• 4700+ — continuation if expansion resumes
⚠️ Risk Notes
• Premium zones are liquidity traps
• Expect fake breaks during news volatility
• No entry without MSS + BOS confirmation
• Reduce position size near extremes
📍 Summary
Gold remains bullish by structure, but today is about execution, not prediction:
• 4618 – 4620 may offer a Smart Money distribution short
• 4578 – 4576 is the key discount zone for long reloads

TATACAP 1 Hour Time Frame 📊 Current Price (approx, delayed)
₹355 – ₹358 range today (intraday high ~361.65 & low ~354.00).
📈 Intraday / 1‑Hour Key Levels (Indicative)
🧠 Pivot & Resistance Levels
These are useful for short term/1‑hour chart bias:
Level Price (₹ approx) Role
R3 368.4 Extended upside resistance
R2 363.2 Secondary resistance
R1 359.0 – 359.1 First resistance zone — breakout confirmation above boosts
bullish bias
Pivot (PP) 353.8 – 354.0 Central pivot — above = bullish, below = bearish
Source: ICICI Direct / Kotak Securities pivot data
📉 Support Levels
Level Price (₹ approx) Role
S1 349.7 Immediate support
S2 344.5 Next downside support
S3 340.3 – 340.4 Deeper support zone
Source: ICICI Direct / Kotak pivot data
📌 How To Use These Levels (1‑Hour Context)
Bullish Scenario
Above Pivot (~354) → bulls in control.
Break above R1 (~359) → stronger upside probability toward R2 (363) and R3 (368).
Bearish Scenario
Below Pivot (~354) → bias turns neutral → bearish if it closes below S1 (~349.7).
A close below S2 (~344) opens swing toward S3 (~340).
Intraday Strategy Tips
In fast moves, use R1/S1 on the 1‑hour chart as your initial entry/exit reference.
Confirm move with volume + RSI/MACD (positive signals add confidence).

TMCV 1 Day Time Frame 📊 Current Price (approx): ₹430-440 range on 15-16 Jan 2026 trading sessions.
📈 Key Daily Levels
These levels are often used by traders for intraday and short-term setups:
Pivot & Nearby Levels (Daily):
Daily Pivot: ~₹435
Immediate Support 1 (S1): ~₹424
Support 2 (S2): ~₹417
Support 3 (S3): ~₹407
Resistance 1 (R1): ~₹442
Resistance 2 (R2): ~₹453
Resistance 3 (R3): ~₹460
(Pivot and S/R levels typically act as intraday reaction zones — price often oscillates around these levels before deciding direction.)
📊 Interpretation of Levels
📍 Support Levels
✔ ₹424–₹417 range — initial demand zone; a break below this could open the way to ₹407 or lower.
✔ ₹407 support — stronger base below which further short-term weakness might accelerate.
Usage:
If price approaches these zones and shows bullish candlesticks or volume pickup → possible intraday bounce.
A decisive break below these suggests short-term bearish continuation.
📍 Resistance Levels
🚩 ₹442–₹453 zone is the first upside hurdle — a breakout and close above this can invite short-term buyers.
🚩 ₹460+ — additional resistance for aggressive upside targets.
Usage:
Price held below these levels indicates sellers remain in control.
Sustained breakout above these with volume could signal short-term bullish momentum.
🧠 Trading Tips (1-day frame)
Bullish (Upside) bias if:
Price breaks above ₹442–₹453 with good volume.
Holds above daily pivot ~₹435 throughout the session.
Bearish (Downside) bias if:
Price closes below ₹424 on a daily basis.
Momentum accelerates below ₹407 (next support).

ABLBL: Falling Channel Study — Reversal Base + Swing Opportunity1️⃣ Primary Trend: Falling Channel (Bearish to Neutral)
Price has been moving inside a well-defined descending channel (lower highs & lower lows).
This indicates controlled selling, not panic — which is important for future reversals.
The stock is currently near the lower band of the channel, a typical area where:
Short covering starts
Value buyers enter
2️⃣ Support Zone & Reversal Signs
Strong demand zone: ₹114 – ₹118
Multiple rejections from this area
Long lower wicks indicate buying interest
This zone has acted as a base, increasing probability of a pullback move.
Breakout Levels to Watch (Very Important)
Immediate resistance: ₹133 – ₹134
Horizontal resistance + mid-channel zone
First sign of strength if crossed with volume
Major trend change confirmation: ₹150 – ₹152
Break & sustain above this = channel breakout
Can shift structure from downtrend → trend reversal
Swing Trading Perspective
Inside-channel swing opportunity:
Bounce from lower channel → mid / upper channel
Upside swing zones:
Target 1: ₹133–135
Target 2: ₹145
Target 3 (only if breakout): ₹150–155
🧠 What This Chart Is Saying (Simple Words)
Selling pressure is slowing down.
The stock is building a base near support.
A short swing bounce is likely first.
A trend reversal only happens above ₹150.
⚠️ Important Note
This analysis is for educational & learning purposes only.
Not a buy or sell recommendation.

Understanding the Power of Volume in Financial MarketsWhat Is Volume in Trading?
Volume represents the total number of shares, contracts, or lots traded in a security or market during a specific period. In stocks, it is the number of shares exchanged; in futures and options, it is the number of contracts traded. Volume is typically displayed as vertical bars below price charts, giving traders a visual sense of market activity.
High volume indicates strong interest and participation from traders and investors, while low volume suggests weak interest or indecision. Importantly, volume does not predict direction on its own, but when combined with price action, it provides powerful confirmation.
Why Volume Is Important in Trading
Volume is often called the “heartbeat of the market” because it reflects real commitment behind price movements. Price can move up or down on low volume, but such moves are often unreliable and prone to failure. When price movement is accompanied by high volume, it shows conviction and increases the probability that the move will continue.
Key reasons volume is crucial:
Confirms trends – Strong trends are supported by rising volume.
Validates breakouts – Breakouts with high volume are more likely to succeed.
Signals reversals – Sudden volume spikes can indicate a change in trend.
Shows institutional activity – Large players usually leave volume footprints.
Volume and Trend Confirmation
One of the most common uses of volume is to confirm trends. In an uptrend, volume should generally increase during upward price movements and decrease during pullbacks. This pattern shows that buyers are aggressive and sellers are weak. Conversely, in a downtrend, volume tends to increase during price declines and decrease during rallies, confirming seller dominance.
If prices are rising but volume is falling, it creates a bearish divergence, warning that the uptrend may be losing strength. Similarly, falling prices on declining volume may indicate that selling pressure is weakening and a reversal could be near.
Trading Breakouts with Volume
Breakouts occur when price moves beyond a key support or resistance level. Many false breakouts happen in low-volume environments. Volume helps traders filter out these traps.
High-volume breakout: Indicates strong participation and higher chances of continuation.
Low-volume breakout: Often lacks conviction and may result in a pullback or false move.
Professional traders wait for volume expansion during a breakout to confirm that the market agrees with the price move.
Volume Spikes and Market Reversals
Sudden, unusually high volume—known as a volume spike—often appears near market tops or bottoms. These spikes may represent panic selling, aggressive buying, or institutional accumulation/distribution.
For example:
After a long downtrend, a sharp fall with extremely high volume followed by price stabilization may signal capitulation, often leading to a reversal.
Near market tops, high volume combined with slow price progress may suggest distribution, where smart money is selling to late buyers.
Understanding these volume clues helps traders anticipate turning points.
Popular Volume-Based Indicators
Traders often enhance raw volume analysis with technical indicators, such as:
Volume Moving Average: Smooths volume data to identify unusual activity.
On-Balance Volume (OBV): Measures cumulative buying and selling pressure.
Volume Weighted Average Price (VWAP): Shows the average price weighted by volume, widely used by institutions.
Accumulation/Distribution Line: Identifies whether money is flowing into or out of a stock.
These tools help traders align price action with underlying market participation.
Volume in Different Market Conditions
Volume behaves differently depending on market structure:
Trending markets: Volume expands in the direction of the trend.
Range-bound markets: Volume contracts as price oscillates between support and resistance.
News-driven markets: Volume spikes sharply due to sudden influx of orders.
Recognizing these patterns allows traders to adapt strategies to current conditions.
Volume and Risk Management
Trading with volume also improves risk management. Entering trades during high-volume periods ensures better liquidity, tighter spreads, and smoother execution. Low-volume trading environments increase the risk of slippage and erratic price movements.
Volume can also help traders decide when not to trade. If volume is significantly below average, it may be better to stay on the sidelines rather than force trades in uncertain conditions.
Common Mistakes When Using Volume
While volume is powerful, it must be used correctly. Common mistakes include:
Using volume alone without price context
Ignoring volume during key chart patterns
Misinterpreting low volume as always bearish or bullish
Overreacting to single volume spikes without confirmation
Successful traders combine volume with price action, support-resistance levels, and broader market context.
Conclusion
Trading with volume adds depth, clarity, and confidence to market analysis. Volume reveals the strength behind price movements, exposes institutional activity, and helps traders avoid false signals. Whether confirming trends, validating breakouts, or spotting reversals, volume acts as a crucial companion to price action.
In essence, price tells you where the market is going, but volume tells you whether it is worth following. Traders who learn to read volume effectively gain a significant edge, improving both accuracy and consistency in their trading decisions.

Derivatives Explained: Meaning, Types, Uses, and Its ImpactsWhat Are Derivatives?
A derivative is a financial contract between two or more parties that derives its value from the price movement of an underlying asset. The contract itself has no independent value; instead, its worth depends entirely on how the underlying asset performs in the market. For example, a futures contract on crude oil depends on the future price of crude oil, while an options contract on a stock depends on that stock’s price movement.
Derivatives are typically used for three main purposes: hedging risk, speculation, and arbitrage. While they are powerful tools, they can also amplify losses if used without proper understanding or risk management.
Types of Derivatives
There are four major types of derivatives commonly traded in financial markets:
Futures Contracts
Futures are standardized contracts traded on exchanges where two parties agree to buy or sell an underlying asset at a predetermined price on a specific future date. These contracts are legally binding and require margin payments. Futures are widely used in commodities, stock indices, currencies, and interest rates. For example, a farmer may use futures to lock in a price for crops, protecting against price fluctuations.
Forward Contracts
Forwards are similar to futures but are privately negotiated (over-the-counter) contracts rather than exchange-traded. They are customized according to the needs of the parties involved. However, forwards carry higher counterparty risk because they are not regulated or guaranteed by an exchange.
Options Contracts
Options give the buyer the right, but not the obligation, to buy or sell an underlying asset at a specific price within a certain time period. A call option gives the right to buy, while a put option gives the right to sell. Options are widely used for hedging and strategic trading due to their flexibility and limited risk for buyers.
Swaps
Swaps are agreements between two parties to exchange cash flows or financial obligations. The most common types are interest rate swaps and currency swaps. These instruments are mainly used by large institutions to manage interest rate or currency risk.
Role of Derivatives in Risk Management
One of the primary purposes of derivatives is hedging. Hedging involves reducing or eliminating the risk of adverse price movements. For instance, an airline company may use fuel futures to lock in fuel prices and protect itself from rising oil costs. Similarly, exporters and importers use currency derivatives to hedge against exchange rate volatility.
By allowing market participants to transfer risk to those willing to bear it, derivatives contribute to financial stability when used responsibly. They help businesses plan future costs and revenues with greater certainty.
Derivatives as a Tool for Speculation
Speculators use derivatives to profit from expected price movements in underlying assets. Because derivatives often require a relatively small initial investment (margin or premium), they offer high leverage. This means that even small price changes can result in significant profits—or losses.
Speculation adds liquidity to markets, making it easier for hedgers to enter and exit positions. However, excessive speculation without proper risk control can lead to sharp market volatility and financial instability.
Arbitrage and Market Efficiency
Arbitrage involves taking advantage of price differences in different markets to earn risk-free profits. Derivatives enable arbitrage by linking prices across markets and time periods. For example, if a futures price deviates significantly from the spot price, arbitrageurs step in to exploit the difference, helping bring prices back into alignment.
This process improves price discovery and overall market efficiency. As a result, derivatives markets often reflect expectations about future prices, interest rates, and economic conditions.
Advantages of Derivatives
Derivatives offer several benefits to financial markets:
Risk Management: Effective tools for hedging price, interest rate, and currency risks.
Leverage: Allows traders to control large positions with limited capital.
Liquidity: High trading volumes improve market depth and efficiency.
Price Discovery: Futures and options markets provide insights into future price expectations.
Risks Associated with Derivatives
Despite their advantages, derivatives carry significant risks:
Leverage Risk: Small market movements can lead to large losses.
Counterparty Risk: Especially in over-the-counter derivatives like forwards and swaps.
Complexity: Misunderstanding contract terms can result in unexpected outcomes.
Systemic Risk: Excessive or poorly regulated use of derivatives can threaten financial stability, as seen during the 2008 global financial crisis.
Derivatives in the Indian Financial Market
In India, derivatives trading is well-established and regulated by the Securities and Exchange Board of India (SEBI). The National Stock Exchange (NSE) and Bombay Stock Exchange (BSE) offer a wide range of derivative products, including index futures, stock options, and currency derivatives. These instruments have significantly increased market participation, liquidity, and transparency in the Indian financial system.
Conclusion
Derivatives are indispensable instruments in today’s global financial markets. When used correctly, they help manage risk, improve market efficiency, and support economic growth. However, their complexity and leverage require a deep understanding and disciplined risk management. For traders and investors, derivatives should not be seen merely as tools for quick profits, but as strategic instruments that demand knowledge, planning, and responsibility. In essence, derivatives are neither inherently good nor bad—their impact depends on how wisely they are used.

Market Reform FalloutUnderstanding the Ripple Effects on the Economy and Investors:
Market reforms are often introduced with the intention of improving efficiency, transparency, and long-term economic growth. Governments and regulators implement reforms to correct structural weaknesses, modernize outdated systems, attract investment, and align domestic markets with global standards. However, while the long-term objectives of market reforms are usually positive, their immediate and medium-term consequences—commonly referred to as * market reform fallout—can be complex, disruptive, and unevenly distributed across sectors and stakeholders. Understanding this fallout is critical for policymakers, businesses, investors, and traders who must navigate periods of uncertainty and transition.
Short-Term Volatility and Market Uncertainty
One of the most visible consequences of market reforms is short-term volatility. Any major change in regulations, taxation, trade policy, labor laws, or financial market structure introduces uncertainty. Markets are driven not only by fundamentals but also by expectations. When reforms are announced, participants reassess risks, profitability, and future cash flows. This reassessment often leads to sharp price movements, increased volatility, and temporary dislocations in asset prices.
For example, reforms aimed at tightening financial regulations may initially hurt banking and financial stocks due to higher compliance costs or reduced leverage. Similarly, subsidy removal or tax reforms can negatively impact sectors that previously relied on government support. In the short run, this volatility can shake investor confidence, reduce liquidity, and trigger risk-off behavior, especially among foreign institutional investors who are sensitive to policy stability.
Sectoral Winners and Losers
Market reform fallout rarely affects all sectors equally. Reforms tend to create clear winners and losers. Industries that benefit from deregulation, privatization, or increased competition often see long-term gains, while those facing stricter rules, reduced protection, or higher costs may struggle.
For instance, labor market reforms may improve productivity and competitiveness over time but can initially create unrest in labor-intensive industries. Trade liberalization can boost export-oriented sectors while exposing domestic industries to intense global competition. Energy or environmental reforms may hurt traditional fossil-fuel-based businesses while accelerating growth in renewable energy and green technology sectors. This uneven impact often leads to capital rotation across sectors, as investors reallocate funds toward perceived beneficiaries of reform.
Impact on Businesses and Corporate Strategy
From a corporate perspective, market reforms force businesses to adapt their strategies. Companies may need to restructure operations, invest in new technologies, alter supply chains, or revise pricing models. While large corporations with strong balance sheets can absorb these changes, small and medium enterprises (SMEs) often face greater stress due to limited resources.
Compliance costs, changes in licensing norms, or new reporting requirements can increase operational expenses in the short term. Some firms may experience margin pressure or declining profitability before they can adjust. However, reforms can also push businesses toward greater efficiency, innovation, and global competitiveness. Over time, companies that successfully adapt often emerge stronger, while inefficient players exit the market, leading to consolidation.
Investor Sentiment and Capital Flows
Investor reaction plays a central role in shaping the fallout of market reforms. Domestic investors may initially adopt a cautious stance, waiting for clarity on implementation and outcomes. Foreign investors, in particular, closely monitor reform credibility, political stability, and consistency of policy execution. Sudden or poorly communicated reforms can trigger capital outflows, currency depreciation, and pressure on financial markets.
On the other hand, credible and well-structured reforms can attract long-term capital. While short-term investors may exit due to volatility, long-term institutional investors often view reforms as a signal of commitment to economic modernization. This divergence in investor behavior explains why markets sometimes fall sharply immediately after reform announcements but recover strongly once confidence is restored.
Social and Employment Implications
Beyond markets and balance sheets, reform fallout has significant social dimensions. Changes in labor laws, privatization of public sector enterprises, or reduction in subsidies can lead to job losses or wage pressures in the short term. These outcomes may spark public opposition, protests, or political pushback, which in turn adds another layer of uncertainty to markets.
However, if reforms succeed in boosting productivity, attracting investment, and fostering entrepreneurship, they can generate employment opportunities over the long run. The challenge lies in managing the transition—providing safety nets, reskilling programs, and clear communication to minimize social disruption while maintaining reform momentum.
Policy Execution and Credibility Risks
The severity of market reform fallout largely depends on how reforms are implemented. Gradual, well-communicated reforms with clear timelines tend to reduce shock and allow markets to adjust smoothly. In contrast, abrupt changes without adequate consultation or clarity can amplify negative reactions.
Policy credibility is equally important. If investors believe reforms may be rolled back due to political pressure or lack of consensus, uncertainty persists, prolonging market instability. Consistent execution, transparency, and alignment between fiscal, monetary, and regulatory policies help contain fallout and accelerate recovery.
Long-Term Structural Benefits
Despite short-term pain, market reforms are often essential for long-term economic health. They can improve resource allocation, enhance productivity, reduce inefficiencies, and increase global competitiveness. Over time, markets typically reward economies that undertake difficult but necessary reforms.
For investors and traders, understanding reform-driven cycles is crucial. Periods of reform fallout can present opportunities to accumulate quality assets at attractive valuations. Long-term investors who focus on fundamentals rather than short-term noise often benefit as reforms translate into sustainable growth.
Conclusion
Market reform fallout is an inevitable part of economic transformation. While reforms aim to strengthen markets and economies, their immediate consequences often include volatility, uncertainty, and uneven sectoral impact. Short-term disruptions can test investor confidence, corporate resilience, and social stability. However, when reforms are well-designed, credibly implemented, and supported by complementary policies, the long-term benefits tend to outweigh the initial costs.
For market participants, the key lies in understanding the nature of reforms, identifying structural winners and losers, and maintaining a balanced perspective. Rather than viewing reform fallout purely as a risk, it can be seen as a phase of adjustment—one that reshapes markets, creates new opportunities, and lays the foundation for more robust and efficient economic systems in the future.
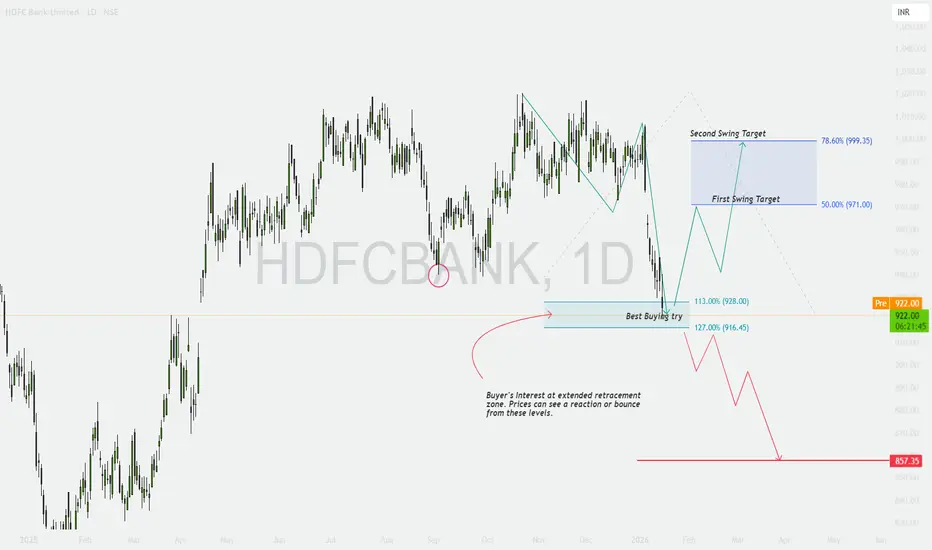
HDFCBANK - Extended Retracement Phase
📊 HDFC Bank – Daily Chart Update | Extended Retracement Phase
Timeframe: 1D
Trend Context: Medium-term correction within a broader structure
Current Price: ~₹925
🔍 What Changed from Previous Analysis? (Important Update)
Earlier, we discussed an ABC correction nearing completion around the ₹960–965 zone.
📉 Price failed to hold that zone, leading to a deeper, extended retracement.
Now the structure has evolved into an extended Fibonacci retracement, where buyers may re-emerge, but with higher risk.
📐 Fibonacci-Based Structure (Educational)
From the prior swing low → swing high:
113% Retracement: ~₹928
127% Retracement: ~₹916
➡️ This ₹916–928 zone is now marked as a “Best Buying Try” area, not blind buying.
📘 Extended retracements often invite short-covering + value buying, but confirmation is mandatory.
📌 Key Levels to Watch (Updated)
🟢 Support / Demand Zones
Primary Demand: ₹916–928
Major Breakdown Level: ₹857
🔴 Resistance / Recovery Zones
First Swing Target: ₹971 (50% retracement)
Second Swing Target: ₹999 (78.6% retracement)
Major Supply: ₹1,018–1,020
🟢 Bullish Scenario (Conditional Recovery)
If price:
Holds ₹916–928
Forms a base / reversal structure (daily close improvement, higher low)
Then:
First bounce toward ₹960–971
Sustained strength can extend toward ₹995–1,000
📈 This would be a relief rally, not trend reversal yet.
🔴 Bearish Scenario (Risk Case)
If price:
Breaks below ₹916 with daily close
Then:
Extended correction likely
Downside opens toward ₹880 → ₹857
📉 Below ₹916, buyers lose positional control.
🎓 Educational Insights
Extended retracements = high reward but high patience trades
Buying zones ≠ buying signals
Daily timeframe requires confirmation, not anticipation
Strong trends correct deeper before resuming
🧠 Options Trading View (Educational Only)
🟢 Near ₹916–928 (Only After Confirmation)
Bull Call Spread (ATM + OTM)
Put Credit Spread for range-bound recovery
🔴 If ₹916 Breaks
Bear Put Spread
Call Credit Spread near ₹960–980
⚠️ Avoid naked option selling in falling markets.
✅ DOs
✔ Wait for daily confirmation
✔ Trade zones, not emotions
✔ Use defined risk strategies
✔ Reduce position size during deep corrections
❌ DON’Ts
❌ Don’t average blindly
❌ Don’t assume every dip is the bottom
❌ Don’t ignore Fibonacci extensions
❌ Don’t overtrade volatility
🧾 Conclusion
HDFC Bank is now in an extended corrective phase.
The ₹916–928 zone is a potential demand area, but only confirmation will decide whether this becomes a base or a breakdown.
📌 Patience here is more profitable than prediction.
⚠️ Disclaimer
This analysis is for educational purposes only. I am not a SEBI registered analyst. Markets are risky, and I may be wrong. Please consult your financial advisor before trading.
DO OR DIE ZONE – BANDHAN BANK
Timeframe: Weekly
Current Price: ~₹145
Primary Trend: Long-term downtrend transitioning into a potential base formation
🔍 Chart Pattern & Market Structure
Bandhan Bank has been trading inside a long-term falling channel, respecting both upper and lower trendline boundaries.
The price structure reflects a 5-wave Elliott decline (Wave 1–5), with Wave 5 likely completed near the lower channel support.
Post Wave 5, the stock is attempting a trendline resistance breakout, followed by a pullback into a Golden Retracement Zone (50%–78.6%), which is technically healthy.
📌 Key Technical Observations:
Golden Retracement Zone:
50% retracement: ~₹160
78.6% retracement: ~₹141
Price is currently holding above 78.6% retracement, suggesting buyers are still defending structure.
₹133–135 zone is marked as a “Do or Die” level, where a weekly close below would invalidate the bullish recovery thesis.
🟢 Swing Trading Strategy (Medium-Term)
✅ Swing Buy Zone:
₹142 – ₹150 (on pullbacks with price stabilization)
🎯 Swing Targets:
Target 1: ₹175
Target 2: ₹200
Extended Swing Target: ₹225–₹240 (only if momentum sustains)
🛑 Swing Stop Loss (Strict):
₹133 (Weekly close basis)
📐 Risk–Reward (Approx.):
Risk: ~₹12
Reward: ₹30–₹90
Risk–Reward Ratio: 1:2.5 to 1:7 (favorable if SL respected)
🔵 Investment Strategy (Positional / Long-Term)
📌 Investment Thesis:
Completion of a multi-year corrective cycle improves the probability of a structural mean reversion.
If price sustains above the broken trendline and holds the golden retracement zone, Bandhan Bank may enter a larger corrective Wave 4 (3-to-4 retracement).
🎯 Investment Upside Zones (Based on Fibonacci Extension):
113% Extension: ~₹282
127% Extension: ~₹302
These levels are long-term objectives, achievable only if the stock builds higher highs and higher lows above ₹200.
🛑 Investment Stop Loss:
₹133 (Weekly close below)
Conservative investors may use ₹125 as a hard capital protection level.
⚠️ Caution & Concerns
The broader trend is still technically bearish until the stock:
Sustains above ₹175–₹180
Breaks and holds above the falling channel decisively
Banking stocks remain sensitive to:
Asset quality concerns
Credit cycle shifts
Macro interest rate dynamics
Failure to hold ₹133 on a weekly closing basis would signal:
Loss of buyer interest
Possible continuation of the long-term downtrend
🚀 Opportunities & Positive Triggers
Successful defense of the Golden Retracement Zone indicates:
Strong hands accumulating
Reduced downside risk
A weekly close above ₹175 can act as a trend reversal confirmation.
The current price structure offers:
Defined risk
Asymmetric upside
Clear invalidation point
📌 Conclusion
Bandhan Bank is at a critical inflection point. While the long-term trend remains cautious, the completion of Wave 5 and support at the golden retracement zone present a high-quality risk-defined opportunity for swing traders and patient investors. Discipline around stop loss will be key.
⚠️ Disclaimer
This analysis is for educational purposes only. I am not a SEBI-registered analyst. Please consult your financial advisor and manage risk responsibly.

ETHUSD – Bearish Rejection from Supply Zone | Short BiasETHUSD showing rejection near higher supply zone on D1.
Structure still weak, looking for downside continuation.
• Sell area marked
• Clear invalidation (SL above zone)
• Target based on prior demand / imbalance
• Trend + structure aligned
This is a market view, not financial advice.
Trade with your own risk management.
#ETHUSD #CryptoAnalysis #PriceAction #SupplyDemand #TradingView

Short term Analysis of GoldWrap up:-
Gold has almost completed a impulse of major wave 3 and also making a wxy pattern in wave 5 of wave 3. Buying Gold at these levels may lead to regret over time. Now, correction in Gold is about to start in coming 1-2 months.
What I’m Watching for 🔍
Short Gold once it breaks 38.2% level of wave y (i.e. from $3998 to a current high or if a new high is made then upto that level) for a target of $3702-$3577-$3446.
Disclaimer: Sharing my personal view — only for educational purpose not financial advice.
"Don't predict the market. Decode them."
