STEELCAS 1 Day Time Frame 📊 Current Price Snapshot (Latest Available)
Approx Live Price: ~₹210–₹213 per share (recent session)
Today’s Day Range (recent close): ~₹208–₹214
📈 Accurate Daily Support & Resistance Levels
🔹 Pivot Point (Day Reference)
Pivot: ~₹206.55–₹213.62 (central reference)
📉 Support Levels
S1: ~₹203.7–₹205.8 – first key support
S2: ~₹197.1–₹201.1 – stronger secondary support
S3: ~₹188.8–₹193.3 – deep support zone
📈 Resistance Levels
R1: ~₹218.5–₹218.3 – first resistance
R2: ~₹226.8–₹226.1 – next upside target
R3: ~₹233.4–₹230.7 – higher resistance
🧠 How to Use These Levels (Daily Time Frame)
Bullish scenario
Break and hold above R1 (~₹218–219) could signal continuation toward R2 (~₹226+).
Sustained break above R2 strengthens trend.
Bearish scenario
Failure under Pivot (~₹206–213) with close below S1 (~₹204–206) may open S2 (~₹197) and S3 (~₹188).
Look for volume confirmation on breakdowns.
📍 Quick Reference Summary (Daily Levels)
Level Price Approx
R3 ~₹230–₹233+
R2 ~₹226–₹227
R1 ~₹218–₹219
Pivot ~₹206–₹213
S1 ~₹203–₹206
S2 ~₹197–₹201
S3 ~₹188–₹193
Wave Analysis

Crypto Investing Guide: Roadmap to Digital Asset InvestingCryptocurrency investing has evolved from a niche technological experiment into a global financial phenomenon. With Bitcoin, Ethereum, and thousands of alternative digital assets now traded worldwide, crypto has attracted retail investors, institutions, and even governments. However, crypto investing is fundamentally different from traditional investing due to its high volatility, emerging technology, regulatory uncertainty, and unique market dynamics. This guide provides a comprehensive overview of crypto investing, covering fundamentals, strategies, risks, and best practices to help investors make informed decisions.
Understanding Cryptocurrency and Blockchain
At its core, cryptocurrency is a digital or virtual currency secured by cryptography and typically built on blockchain technology. A blockchain is a decentralized, distributed ledger that records transactions across a network of computers. Unlike traditional financial systems controlled by central authorities, blockchains operate on consensus mechanisms such as Proof of Work (PoW) or Proof of Stake (PoS). This decentralization is a key value proposition, offering transparency, immutability, and resistance to censorship.
Bitcoin, the first cryptocurrency, was designed as a peer-to-peer electronic cash system. Ethereum expanded the concept by enabling smart contracts—self-executing programs that run on the blockchain—paving the way for decentralized finance (DeFi), non-fungible tokens (NFTs), and Web3 applications. Understanding these technological foundations is essential before investing, as the value of crypto assets is often tied to their utility, network adoption, and security.
Types of Crypto Assets
Crypto assets can be broadly categorized into several groups. Payment coins like Bitcoin and Litecoin focus on value transfer and store of value. Platform tokens such as Ethereum, Solana, and Avalanche support decentralized applications. Utility tokens grant access to specific services within an ecosystem. Stablecoins are pegged to fiat currencies and aim to reduce volatility. Governance tokens allow holders to vote on protocol decisions. Each category carries different risk and return profiles, making diversification across types an important consideration.
Why People Invest in Crypto
Investors are drawn to crypto for multiple reasons. Some view it as a hedge against inflation and currency devaluation, especially in economies with unstable monetary systems. Others are attracted by the potential for high returns, as early adopters of successful projects have historically seen significant gains. Additionally, crypto offers exposure to cutting-edge innovation in finance, technology, and digital ownership. However, these opportunities come with heightened risks that require careful evaluation.
Investment Strategies in Crypto
Crypto investing strategies range from conservative to highly speculative. Long-term investing (HODLing) involves buying fundamentally strong projects and holding them through market cycles, betting on long-term adoption. Dollar-cost averaging (DCA) reduces timing risk by investing fixed amounts at regular intervals. Active trading focuses on short-term price movements using technical analysis but requires experience, discipline, and risk management. Staking and yield farming allow investors to earn passive income by locking assets in networks or DeFi protocols, though they introduce smart contract and liquidity risks.
A disciplined strategy should align with the investor’s risk tolerance, time horizon, and financial goals. Overexposure to a single asset or strategy can significantly increase downside risk.
Fundamental and Technical Analysis
Successful crypto investing relies on analysis. Fundamental analysis examines factors such as the project’s use case, team, tokenomics, roadmap, community support, and real-world adoption. Metrics like active addresses, transaction volume, and total value locked (TVL) provide insights into network health. Technical analysis, on the other hand, studies price charts, trends, support and resistance levels, and indicators like RSI or moving averages to identify potential entry and exit points. Combining both approaches can lead to more balanced decisions.
Risk Management and Volatility
Crypto markets are notoriously volatile, with prices capable of swinging dramatically in short periods. Risk management is therefore critical. Investors should never invest money they cannot afford to lose, use position sizing to limit exposure, and avoid excessive leverage. Setting stop-loss levels, maintaining diversification, and periodically rebalancing portfolios can help manage downside risk. Emotional discipline is equally important, as fear and greed often drive poor decisions during extreme market moves.
Security and Storage
Security is a unique concern in crypto investing. Assets are controlled by private keys, and losing them can mean permanent loss of funds. Investors can store crypto on exchanges, software wallets, or hardware wallets. While exchanges offer convenience, they carry counterparty risk. Hardware wallets provide higher security for long-term holdings. Practicing good security hygiene—such as enabling two-factor authentication, avoiding phishing links, and backing up recovery phrases—is essential.
Regulation and Taxation
Crypto regulations vary widely across countries and are constantly evolving. Some jurisdictions embrace digital assets, while others impose restrictions or bans. Investors must stay informed about local regulations, compliance requirements, and tax obligations. Profits from crypto trading are often subject to capital gains tax, and improper reporting can lead to legal issues. Regulatory clarity can significantly impact market sentiment and asset prices.
Common Mistakes to Avoid
New investors often fall into predictable traps: chasing hype, investing without research, overtrading, or relying solely on social media tips. Another common mistake is ignoring fees, liquidity, and security risks. Patience, education, and a long-term perspective can help avoid costly errors.
Conclusion
Crypto investing offers unique opportunities to participate in a rapidly evolving digital economy, but it is not a guaranteed path to wealth. Success requires a solid understanding of blockchain technology, thoughtful strategy selection, disciplined risk management, and continuous learning. By approaching crypto with a balanced mindset—embracing innovation while respecting risk—investors can navigate this dynamic market more effectively and build a resilient digital asset portfolio over time.

Major Crash Ahead?The Diametric Pattern completed.
2-stage confirmation achieved.
The Major impulsive downtrend has begun - Unless there is a sharp reversal upside by next week.

What exactly you have to do when the Markets are REDI make educational content videos for swing trading basis
Charts used are older than 3 months in this video

Updated Nifty Analysis for Jan 09, 2026Wrap up:-
As updated earlier, wave 1 was completed at 26057 but wave 2 counts have now been changed due to a sudden fall and is expected to be completed in the range of 25800-25850. Thereafter, nifty will head towards wave 3.
What I’m Watching for Jan 09, 2026 🔍
Buy Nifty only above @25971 sl 25858 (15 min. candle closing basis) for a target of 26447-26630.
Short Nifty in the range @25935-25921 sl 25971 (15 min. candle closing basis) for a target of 25818.
Disclaimer: Sharing my personal market view — only for educational purpose not financial advice.
"Don't predict the market. Decode them."

Tube Investments of India Ltd — Wave X Triangle in PlayAfter the sharp decline from ₹4,810, the recent advance initially looked like a potential leading diagonal of a new impulse. However, the internal overlaps and choppy rhythm point instead to a Wave X triangle, likely part of a larger corrective sequence (W–X–Y).
As long as price holds below ₹3,419.90, the bearish outlook remains intact, with the next leg — Wave Y — possibly aiming toward the 0.5–0.618 retracement zone (₹2,511–₹1,968). That region, close to the golden ratio, may act as a potential termination zone for the entire correction.
Disclaimer: This analysis is for educational purposes only and does not constitute investment advice. Please do your own research (DYOR) before making any trading decisions.

Elliott Wave Analysis XAUUSD – January 9, 2025
1. Momentum
Daily (D1)
– Daily momentum has already turned bearish
– I expect the downside move to continue for the next few days until D1 momentum reaches the oversold zone
– This suggests that medium-term corrective pressure is still dominant
H4
– H4 momentum is preparing to turn bearish
– We need to wait for H4 candle close confirmation
– Once confirmed, price is likely to experience at least a few bearish H4 candles
H1
– H1 momentum is currently in the oversold zone
– In the short term, a technical rebound on H1 is likely
– This rebound will be critical for identifying a potential sell opportunity
2. Elliott Wave Structure
Daily Wave Structure (D1)
– With Daily momentum turning bearish, I expect price to continue developing the purple wave Y
– Based on last week’s analysis (which will be updated again this week), Weekly momentum still needs around two more weekly candles to reach the oversold zone
– This implies that wave Y may evolve as a time-consuming corrective structure, such as:
– A 5-wave structure
– A zigzag
– Or a triangle
– These scenarios align with the principle of alternation, where corrective structures tend to become more complex over time
– Therefore, we continue to let momentum and wave structure confirm each other
(This is a key difference in my Elliott Wave approach: I do not rely solely on wave patterns, but always integrate momentum — an approach I learned from Robert C. Minor.)
H4 Wave Structure
– H4 momentum is now turning bearish, as mentioned in yesterday’s plan
– The recent H4 momentum rally failed to break above 4500, which supports the view that wave 2 or wave B has already formed
– As H4 momentum moves toward the oversold zone:
– Price needs to break below 4402 to confirm the bearish trend
H1 Wave Structure
– On H1, a blue 1-2-3-4-5 structure has been tentatively assigned
– Price is currently developing blue wave 2
Invalidation scenarios
– If price reaches 4500:
– The current H1 wave count will be invalidated
– In this case, red wave C may continue toward 4521
– If price reaches 4550:
– The entire red ABC structure will be invalidated
– A full wave recount will be required
3. Outlook & Trading Bias
– With:
– Daily momentum already bearish
– H4 momentum turning bearish
→ I remain bearish on the development of wave Y
– The current H1 rebound is therefore crucial
– The ideal scenario:
– Price rallies below 4500
– H1 momentum reaches the overbought zone and turns down from there
→ This would provide a high-probability sell setup
4. Trading Plan (Unchanged)
– Sell Zone: 4481 – 4484
– Stop Loss: 4502
– TP1: 4440
– TP2: 4376
– TP3: 4348

NIFTY : Trading levels and Plan for 09-Jan-2026
(Timeframe: 15-min | Gap criteria considered: 100+ points)
🔑 Key Levels from Chart
Major Upside Resistance: 26,115
Last Intraday Resistance: 26,032
No-Trade / Supply Zone: 25,839 – 25,932
Opening Support / Pivot: 25,839
Last Intraday Support: 25,741
Lower Support Extension: 25,587
🧠 Market context: NIFTY is in a short-term corrective structure after a strong sell-off. Price is consolidating inside a well-defined no-trade zone, indicating balance before the next directional move.
🟢 1. GAP-UP OPENING (100+ Points)
If NIFTY opens above 25,932, it signals short-covering but into a supply zone.
🎓 Educational Insight
Gap-ups after a decline often face selling pressure near VWAP/supply zones. Sustainable upside requires acceptance above resistance, not just an opening spike.
Plan of Action
Avoid chasing longs in first 15 minutes ⏳
Sustain above 26,032 → upside toward 26,115
Rejection near 26,032 → pullback to 25,932 – 25,839
Fresh longs only on retest + higher low formation
Options idea: Bull Call Spread (ATM buy + OTM sell)
🟡 2. FLAT OPENING
If NIFTY opens inside 25,839 – 25,932, expect range-bound & whipsaw action.
🎓 Educational Insight
Flat opens within supply-demand overlap zones usually lead to false breakouts. Direction emerges only after range expansion with volume.
Plan of Action
Above 25,932 with hold → move toward 26,032
Failure above 25,932 → sideways to negative bias
Break below 25,839 → weakness toward 25,741
Avoid trades in mid-range 🚫
Options idea: Iron Fly / Hedged Short Strangle if volatility drops
🔴 3. GAP-DOWN OPENING (100+ Points)
If NIFTY opens below 25,839, bears remain in control.
🎓 Educational Insight
Gap-downs into prior supports can trigger panic selling, but sharp bounces are also common. Always wait for price confirmation.
Plan of Action
First demand zone: 25,741
Strong rejection from 25,741 → intraday bounce possible
Break & sustain below 25,741 → slide toward 25,587
Avoid fresh shorts exactly at support
Options idea: Bear Put Spread or Put Debit Spread
🛡️ Risk Management Tips (Options Trading)
Risk only 1–2% capital per trade 💰
Prefer spreads over naked buying in volatile zones
Book partial profits near resistance/support
No averaging against trend 🚫
Stop trading after 2 consecutive losses 🧠
🧾 Summary & Conclusion
Above 26,032: Short-term bullish toward 26,115
25,839 – 25,932: No-Trade / Chop Zone
Below 25,839: Weakness toward 25,741 → 25,587
Focus on price acceptance, not prediction 🎯
⚠️ Disclaimer
I am not a SEBI-registered analyst. This analysis is strictly for educational purposes only. Markets involve risk—please consult a certified financial advisor before trading.

BTCUSDT – Elliott Wave Completion → Short Sell SetupPrice action on BTCUSDT appears to be completing a 5-wave Elliott impulse structure inside a rising wedge / channel. Waves (1)–(5) are clearly respected, with Wave (5) now testing a major trendline resistance zone around 91,800–92,000.
Momentum indicators are showing loss of strength near the top, suggesting Wave (5) exhaustion. As per Elliott Wave theory, after a completed 5-wave move, a corrective ABC structure is expected.
Trade Idea:
Bias: Short / Sell
Sell Zone: 92000 – 92,200
Invalidation (SL): Above 92,600 (Wave 5 extension failure)
Targets:
TP1: 90,000
TP2: 88,700
TP3: 87,400 (major demand & channel support)
A breakdown from the upper trendline should accelerate downside pressure toward the lower channel support, aligning with a larger corrective move.

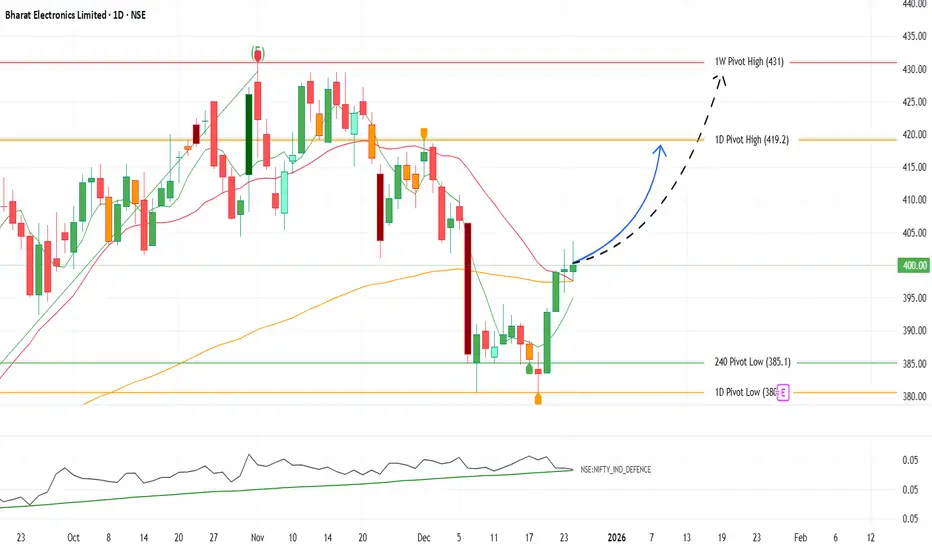
BEL – Setting Up for a 5% Move-Swing TradeBEL – Setting Up for a 5% Upside Move 🚀
BEL has taken strong support near ₹385–388 and is now reclaiming key moving averages with improving momentum. With the upcoming Union Budget expected to favor Defence spending, sentiment & flows remain supportive.
📌 Trade View
CMP: ~₹400
Targets: ₹420 (near-term), ₹431 (extendable)
Support: ₹388
Stoploss: ₹382 (strict)
💡 Why?
Strong bounce from key demand zone
Reclaiming trend levels + improving structure
Budget tailwinds + Defence sector strength
Trend intact. Dips buying. Ride the move! 🐊🔥
Nifty Analysis for Jan 09, 2026Wrap up:-
As updated earlier, wave 1 was completed at 26057 but wave 2 counts have now been changed due to a sudden fall and is expected to be completed at 25858 if nifty breaks and sustains above 25971. Thereafter, nifty will head towards wave 3.
What I’m Watching for Jan 09, 2026 🔍
Buy Nifty above @25971 sl 25858 (15 min. candle closing basis) for a target of 26447-26630.
Disclaimer: Sharing my personal market view — only for educational purpose not financial advice.
"Don't predict the market. Decode them."

Nifty Analysis for Jan 08, 2026Wrap up:-
As updated earlier, wave c is an impulse wave. But, now the counts have been changed with wave 1 at 26057, wave 2 at 26067 and now, nifty heading towards wave 3.
Buy Nifty @26140 sl 26008 (15 min. candle closing basis) for a target of 26432.
Disclaimer: Sharing my personal market view — only for educational purpose not financial advice.
"Don't predict the market. Decode them."

AUDUSD Buy Setup | Discount Zone Reaction + Trendline BreakBias: Bullish
Timeframe: 15M
Pair: AUDUSD
Market Structure & Context
AUDUSD has completed a corrective move within a descending channel after a strong impulsive rally. Price has now reached a higher-timeframe discount zone, aligning with a rising trendline support, where we see clear signs of seller exhaustion.
Downside liquidity has been swept below recent equal lows, followed by strong bullish displacement, indicating potential smart money re-entry from discount.
Technical Confluence
Price reacting from HTF discount zone
Liquidity sweep below equal lows
Descending channel break attempt
Bullish structure shift on lower timeframe
Mean reversion setup targeting equilibrium & premium
Trade Plan
Entry:
Buy on confirmation above 0.66936
Stop Loss:
Below demand & trendline at 0.66728
Targets:
TP1: 0.6725 (Equilibrium)
TP2: 0.6742 (Mid supply)
TP3: 0.6765 (Premium zone / HTF resistance)
Risk–Reward
Approx 1:3.5 – 1:5 RR
Invalidation
Strong close below 0.66728 invalidates bullish bias
Notes
Patience is key. Best entries occur after structure confirmation, not blind buying. This setup favors New York session expansion if DXY weakens.

EUR/USD Complete PictureTechnically:
As per the Current Market Structure, EUR/USD looks weaker for an 1st Target of 1.15305 . Once Wave E is completed EUR/USD turns into buy side for an 2nd Target of 1.20300
Fundamentally: Change of Structure Possible on Jan23rd based on the data German and French Flash manufacturing which will decide the next move of EURO and Pound Pairs.

POLICYBZR bounce backPOLICYBZR bounce back, target is Rs:1950/- in 6 weeks, trend reversed with support levels of 1650

USD/JPY short term bullishAs Per Wave Analysis, USD/JPY looks for an short term bullish for an Target = 156.500

CAD/JPY bullish in 4hr time frameCAD/JPY currently completed the Running flat, an strong impulse for an Target = 112.380

AUD/USD bullish in 4hr time frameThe current chart represents strong bullish in 4hr time frame. As the correction of Flat is completed. Strong bullish with an target of 0.67070 is expected.

ETH/USD in Daily time framePresent scenario looks like triangle pattern is running, Once the E-Wave is completed, then further downside with an Target mentioned in the chart is possible.

GERMAN30 Super Bullish in Daily Time FrameLooks like German30 super bullish in Daily time frame for an Target of 25278

ETH/USD sell in monthly Time frameETH/USD strong sell in Monthly, weekly, daily and 4hr time frame. Current scenario suggests big sell to hunt the liquidity for an Target of 1665$.

Nifty Sideways Uptrend 1 HR Timeframe Nifty is currently in a sideways-to-uptrend structure on the 1-hour timeframe. Price is hovering near an important zone which can act as either a breakout or a reversal point. The next upside and downside levels are clearly marked on the chart for reference. A sustained move above resistance can open further upside, while rejection from this zone may lead to a pullback toward support. Watch price action closely around these levels for confirmation before taking trades.

Part 12 Trading Master Class Key Terminologies in Option Trading
1. Strike Price
The price at which the buyer can exercise the option.
2. Premium
The cost paid by the option buyer to the seller for the contract.
3. Expiry
The date when the option contract expires (weekly/monthly).
4. In-the-Money (ITM)
When the option has intrinsic value.
CE is ITM if underlying > strike.
PE is ITM if underlying < strike.
5. Out-of-the-Money (OTM)
When the option has no intrinsic value.
CE is OTM if underlying < strike.
PE is OTM if underlying > strike.
6. Lot Size
Options trade in fixed quantities called lots (e.g., NIFTY lot size = 50).
