ATHERENERGATHERENERG
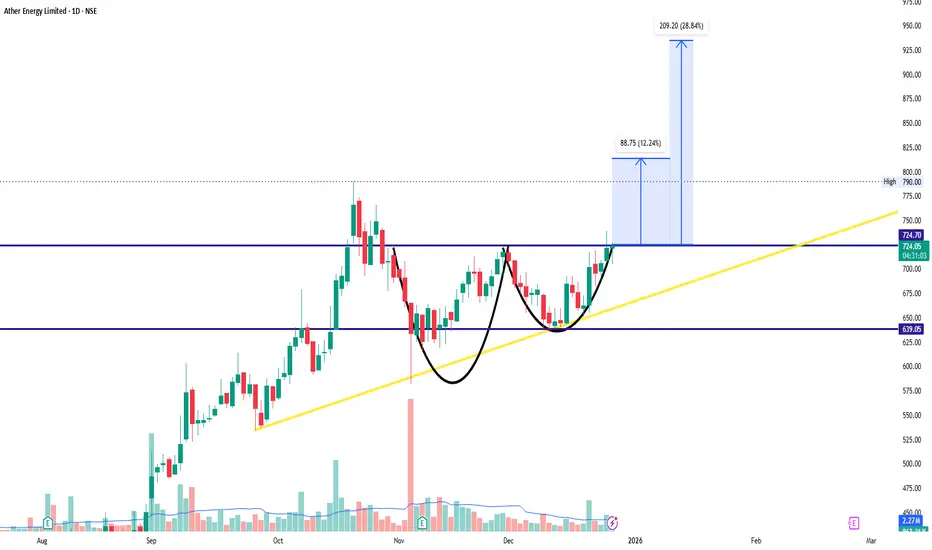
bullish trend is Showing on the chart.
buy signals in
technical indicators and
Cup with Handle & Ascending Triangle chart pattern.
Watch for a breakout above 725/730 to sustain the bullish trend. If the resistance holds, there could be a retest towards 630/640 and an uptrend from here.
Wave Analysis
Risk Management and Position Sizing in Option TradingOption trading offers traders flexibility, leverage, and the ability to profit in various market conditions. However, these same advantages also make options inherently risky. Without a structured approach to risk management and position sizing, even a few unfavorable trades can lead to significant capital erosion. Successful option traders focus less on predicting the market perfectly and more on controlling risk, managing losses, and sizing positions wisely. This discipline separates consistent traders from speculative gamblers.
1. Understanding Risk in Option Trading
Risk in option trading is multi-dimensional. Unlike equity trading, where price movement is the main risk, options are affected by price, time, volatility, and interest rates. The primary risks include:
Directional risk – the underlying asset moving against the trade.
Time decay (Theta risk) – options losing value as expiration approaches.
Volatility risk (Vega risk) – changes in implied volatility impacting option prices.
Liquidity risk – difficulty entering or exiting trades at desired prices.
Gap risk – sudden price movements due to news or events.
Effective risk management begins with recognizing these risks and designing strategies that limit their impact.
2. Capital Preservation: The Core Principle
The first rule of trading is “do not lose capital.” Capital preservation ensures that traders stay in the game long enough to benefit from favorable probabilities over time. Option traders must accept that losses are unavoidable, but large losses are optional.
Key principles of capital preservation include:
Never risking too much on a single trade.
Avoiding over-leverage.
Planning for worst-case scenarios before entering a trade.
Accepting small, controlled losses as part of the trading process.
Preserving capital builds psychological confidence and allows compounding to work effectively.
3. Defining Risk Per Trade
A common professional guideline is to risk 1% to 2% of total trading capital per trade. For example, with a capital of ₹10,00,000, the maximum loss per trade should ideally be ₹10,000–₹20,000.
In options, this means:
Knowing the maximum possible loss before entering the trade.
Avoiding naked positions with unlimited risk unless hedged.
Using defined-risk strategies like spreads instead of outright option buying or selling.
By limiting risk per trade, even a series of losing trades will not significantly damage the overall portfolio.
4. Position Sizing in Option Trading
Position sizing determines how many option contracts or lots to trade. Proper sizing ensures that no single trade can disproportionately impact the portfolio.
Factors influencing position sizing include:
Account size
Maximum acceptable loss
Volatility of the underlying asset
Strategy used (buying vs selling options)
For example:
High-volatility stocks require smaller position sizes.
Index options may allow slightly larger positions due to liquidity and stability.
Selling options requires stricter sizing due to margin and tail risk.
Position sizing transforms risk management from theory into practice.
5. Fixed Fractional Position Sizing
Fixed fractional sizing is one of the most widely used methods. Here, traders allocate a fixed percentage of capital to each trade.
Example:
Risk 1.5% per trade.
Capital = ₹10,00,000
Maximum loss allowed = ₹15,000 per trade.
If one strategy has a higher stop-loss or wider spread, the number of lots is reduced accordingly. This method automatically adjusts exposure as capital grows or shrinks.
6. Strategy-Based Risk Allocation
Different option strategies carry different risk profiles:
Long options – risk limited to premium paid.
Credit spreads – defined but higher probability trades.
Iron condors – limited risk with range-bound expectations.
Naked selling – high risk and margin intensive.
Professional traders allocate capital across strategies instead of concentrating on one type. For example:
40% in low-risk income strategies
30% in directional trades
20% in hedges
10% kept as cash buffer
This diversification reduces overall portfolio volatility.
7. Stop-Loss and Adjustment Rules
Risk management is incomplete without predefined exit rules. In option trading, stop-losses can be:
Premium-based (exit if option loses 50% of value)
Underlying-based (exit if price breaks key level)
Time-based (exit if trade does not work within a specific period)
For option sellers, adjustments like rolling, converting to spreads, or reducing quantity are part of dynamic risk control. The key is to decide exits before entering the trade, not emotionally during market fluctuations.
8. Managing Portfolio-Level Risk
While individual trade risk is important, portfolio-level risk is equally critical. This includes:
Avoiding overexposure to a single sector or index.
Limiting correlation between trades.
Monitoring total margin usage.
Maintaining sufficient free capital for adjustments.
A common rule is to avoid using more than 50–60% of total available margin at any time. This buffer protects against sudden volatility spikes and margin calls.
9. Hedging and Risk Offsetting
Hedging is a powerful risk management tool in option trading. Examples include:
Buying protective puts against short positions.
Using spreads instead of naked options.
Holding opposite directional trades to reduce net exposure.
While hedging reduces potential profit, it significantly improves risk-adjusted returns, which is the hallmark of professional trading.
10. Psychological Risk Management
Risk management is not only mathematical but also psychological. Overtrading, revenge trading, and fear-driven decisions often cause more damage than market movements.
Strong risk discipline helps:
Reduce emotional stress.
Improve consistency.
Maintain confidence during drawdowns.
Traders who follow strict position sizing rules are less likely to panic during losses or become overconfident during winning streaks.
11. Risk–Reward Evaluation
Every option trade should have a favorable risk–reward ratio, ideally at least 1:2 or higher. This means potential reward should be at least twice the risk.
Even with a win rate of 40–50%, traders can remain profitable if risk–reward is well structured. Risk management ensures that profits grow faster than losses over time.
12. Long-Term Consistency and Compounding
The ultimate goal of risk management and position sizing is long-term survival and steady growth. Small, consistent gains compounded over time can outperform aggressive strategies with high drawdowns.
Traders who respect risk:
Survive volatile markets
Adapt to changing conditions
Build sustainable trading careers
In option trading, discipline matters more than prediction.
Conclusion
Risk management and position sizing are the foundation of successful option trading. While strategies, indicators, and market views may change, disciplined risk control remains constant. By limiting losses, sizing positions intelligently, diversifying strategies, and maintaining emotional discipline, traders can transform option trading from a high-risk gamble into a structured, professional approach. In the long run, those who manage risk effectively are the ones who stay profitable and consistent in the options market.

Elliott Wave Analysis – XAUUSD | December 26, 2025
1. Momentum Analysis
D1 (Daily)
Daily momentum is currently preparing for a bearish reversal. There is a high probability that momentum will confirm a downside reversal today or tomorrow. If confirmed, the market is likely to enter a Daily corrective move lasting at least several candles.
H4
H4 momentum remains bullish. Therefore, in the short term, the upward move or sideways consolidation on H4 may persist for approximately one to two more candles before clear signs of weakening appear.
H1
H1 momentum is already turning down, indicating that short-term bearish pressure continues to dominate on the H1 timeframe.
2. Elliott Wave Structure
D1 Structure
The Daily wave structure has not changed significantly. Price remains within wave X of a flat corrective structure inside wave 4 (yellow).
With Daily momentum approaching a bearish reversal, I expect wave X to complete once D1 momentum confirms the reversal.
H4 Structure
Within the blue wave 5, we can observe a complete 5-wave structure in red. Price is currently in the final phase of red wave 5.
Once red wave 5 is completed, this will confirm the completion of purple wave X.
Notably, red wave 5 appears to be extended, and according to Elliott Wave characteristics, the first corrective leg following an extended wave 5 is often sharp and aggressive. Therefore, confirmation from momentum reversal signals will be essential to validate wave completion.
H1 Structure
Inside red wave 5, the H1 timeframe also shows a 5-wave internal structure (black 1–2–3–4–5).
Price has already reached the 4514 target zone, yet at today’s session open, a new high was formed.
When combined with Daily momentum preparing for a bearish reversal, contracting candle ranges, and the fact that price has already met its primary target, I am leaning toward the scenario that black wave 5 is forming a terminal triangle.
At this stage, there is no confirmed terminal triangle yet, so continued observation is required before drawing final conclusions.
3. Volume Profile & Key Price Zones
From the Volume Profile, price is currently trading within a high-liquidity range between 4471 and 4514.
A strong breakout from this zone in either direction will provide important confirmation for the next directional move.
- A daily close below 4471 would strongly suggest that wave 5 has completed, opening the door for a clearer bearish trend.
- As long as price remains inside this range, the market is still in a late-stage consolidation phase.
4. Trading Plan
The market is currently in a holiday period, resulting in low liquidity and unpredictable stop-hunting behavior.
Additionally, the Elliott Wave structures on higher timeframes are still awaiting confirmation. Therefore:
- Focus on short-term trades only, or remain patient and observe
- Avoid large position sizing
- Wait for clear confirmation from momentum and structural breaks
I will update the analysis once clearer signals emerge.

BANKNIFTY : Trading levels and Plan for 26-Dec-2025📘 BANK NIFTY Trading Plan for 26-Dec-2025
(Chart reference: 15-min | Gap criteria considered: 200+ points)
Key Levels to Track (from chart)
Major Upside Supply Zone: 59,573 – 59,663
Last Intraday Resistance: 59,401
Opening Resistance: 59,296
Opening Support: 59,107
Last Intraday Support: 58,896
Lower Support (Extreme): 58,645
🟢 1. GAP-UP OPENING (200+ Points)
If BANK NIFTY opens above 59,296, price enters a resistance-heavy zone where supply may appear.
🎓 Educational Explanation:
A 200+ point gap-up usually reflects strong overnight cues. However, opening near resistance often invites profit booking. Healthy continuation typically needs acceptance above resistance or a pullback-and-hold before moving higher.
Plan of Action:
If price sustains above 59,296 for 10–15 minutes, look for pullback-based long entries.
First upside hurdle is 59,401; observe volume and candle acceptance.
Acceptance above 59,401 can extend toward the 59,573–59,663 supply zone.
Rejection near 59,401–59,663 may trigger a pullback toward 59,296.
Option buyers should avoid chasing CE at the open; confirmation improves R:R.
🟡 2. FLAT OPENING
A flat open near 59,200–59,260 keeps BANK NIFTY inside a balance area.
🎓 Educational Explanation:
Flat opens indicate equilibrium between buyers and sellers. Direction usually emerges only after the opening range is broken. Trading inside the range without confirmation often leads to whipsaws.
Plan of Action:
Sustaining above 59,296 shifts momentum bullish, targeting 59,401.
Failure to cross 59,296 keeps price vulnerable to a pullback.
Breakdown below 59,107 signals weakness toward 58,896.
Bullish rejection near 59,107 can offer a low-risk bounce trade.
🔴 3. GAP-DOWN OPENING (200+ Points)
If BANK NIFTY opens below 59,107, early sentiment turns weak.
🎓 Educational Explanation:
Large gap-downs are often emotion-driven. Strong demand zones can attract short-covering and value buying. Selling blindly into support increases the risk of sharp reversals.
Plan of Action:
First support to watch is 58,896 — observe price behaviour and candle structure.
Breakdown below 58,896 opens the downside toward 58,645.
Strong bullish reversal near 58,645 may lead to a sharp intraday bounce.
Any pullback toward 59,107 after a breakdown can be used as a selling-on-rise opportunity.
⚙️ Risk Management Tips for Options Traders 🛡️
Avoid trading the first 5–10 minutes during 200+ point gap days.
Don’t buy options at resistance or sell at support without confirmation.
Use a time-based stop-loss (15–20 minutes) if premium doesn’t move.
Risk only 1–2% of total capital per trade.
Prefer ATM options or defined-risk spreads to manage theta decay.
Book partial profits near marked resistance/support levels.
🧾 Summary & Conclusion
Above 59,296: Bulls stay active; targets 59,401 → 59,573–59,663.
Between 59,107–59,296: Market remains range-bound; patience required.
Below 59,107: Sellers gain control unless buyers defend 58,896 / 58,645.
Trade price behaviour at levels, not predictions.
Consistency comes from discipline, confirmation, and risk control.
⚠️ Disclaimer
I am not a SEBI-registered analyst. This trading plan is for educational purposes only and should not be considered financial or investment advice. Please consult your financial advisor before taking any trades.

NIFTY : Trading levels and Plan for 26-Dec-2025📘 NIFTY Trading Plan for 26-Dec-2025
(Chart reference: 15-min | Gap criteria considered: 100+ points)
Key Levels to Track (from chart)
Major Upside Resistance: 26,341.10
Last Intraday Resistance: 26,265.00
Opening Resistance: 26,212.00
Opening Support / Resistance (Pivot Zone): 26,099 – 26,141
Last Intraday Support: 26,040.50
Lower Support: 25,920.85
🟢 1. GAP-UP OPENING (100+ Points)
If NIFTY opens above 26,212, price starts the session in a bullish zone but close to overhead supply.
🎓 Educational Explanation:
Gap-up opens indicate positive overnight sentiment. However, when price opens near resistance, early profit-booking is common. Strong trends usually continue only after acceptance above resistance or a clean retest, not on impulsive spikes.
Plan of Action:
If price sustains above 26,212 for 10–15 minutes, look for pullback-based long entries.
First upside hurdle is 26,265 (last intraday resistance).
Acceptance above 26,265 can extend the move toward 26,341.10.
Rejection or exhaustion near 26,265–26,341 may lead to a pullback toward 26,212.
Option buyers should avoid chasing CE at the open; confirmation improves R:R.
🟡 2. FLAT OPENING
A flat open around 26,120–26,160 keeps NIFTY inside the opening pivot zone (26,099–26,141).
🎓 Educational Explanation:
Flat opens reflect balance between buyers and sellers. Direction typically emerges after the opening range breaks. Trading inside this zone without confirmation often leads to whipsaws and theta decay.
Plan of Action:
Sustaining above 26,141 keeps bullish bias intact, targeting 26,212 → 26,265.
Failure to hold 26,099 increases downside risk toward 26,040.50.
Bullish rejection near 26,099–26,141 offers a low-risk bounce back to 26,212.
Breakdown and acceptance below 26,099 shifts momentum toward 26,040.50.
🔴 3. GAP-DOWN OPENING (100+ Points)
If NIFTY opens below 26,099, early sentiment turns cautious to bearish.
🎓 Educational Explanation:
Gap-downs are often emotion-driven. Strong demand zones can attract short-covering and value buying, leading to sharp reversals. Selling blindly into support increases risk.
Plan of Action:
First support to watch is 26,040.50 — observe candle structure and volume.
Breakdown below 26,040.50 opens the downside toward 25,920.85.
Strong bullish reversal signals near 25,920.85 may lead to a sharp intraday bounce.
Any pullback toward 26,099 after breakdown can be used as a selling-on-rise opportunity.
⚙️ Risk Management Tips for Options Traders 🛡️
Avoid trading the first 5–10 minutes during gap openings.
Don’t buy options at resistance or sell at support without confirmation.
Use a time-based stop-loss (15–20 minutes) if premium doesn’t move.
Risk only 1–2% of total capital per trade.
Prefer ATM options or defined-risk spreads to manage theta decay.
Book partial profits near marked resistance/support levels.
🧾 Summary & Conclusion
Above 26,212: Bulls remain active; targets 26,265 → 26,341.
Between 26,099–26,212: Market stays balanced; patience is key.
Below 26,099: Sellers gain control unless buyers defend 26,040.50 / 25,920.85.
Trade price behaviour at levels, not predictions.
Consistency comes from discipline, confirmation, and risk control.
⚠️ Disclaimer
I am not a SEBI-registered analyst. This trading plan is for educational purposes only and should not be considered financial or investment advice. Please consult your financial advisor before taking any trades.

U.S Doller Index ( DXY ) - EW Analysis Doller Index weekly analysis forming leading diagonal pattern completed now in correction phase and C wave (impulse) target possible at $ 87.5

Best to exit this counterUPL CMP 772
Elliott- The entire rally post the 2020 correction is corrective in rally. The current rally is also corrective in nature. The stock has reached its previous highs and is a natural resistance. To me a fresh set of three wave correction should start from here. The correction should be deep.
Fib- the stock respecting zones drawn from top and bottom is another indication that the stock is going no where. In technical terms its moving symmetrically. Hence not good for investments.
Conclusion - this is an opportunity to exit this stock. The stock is not expanding and hence will not give any positive returns. Hence best to take a graceful exit.

TESLA VIEWTesla
Scenario 1
Wave 4 360, 320 Sustain strongly
Wave 5 583, 640
scenario 2
WAVE 4 360 , 276 Sustain strongly
WAVE 5 670 , 715
223 below sustain or close monthly is invalidation
view is for study purpose only , we are not recommend any trade or investment
Always do your own analysis


Gold 1H – Smart Money Traps Near 4540–4450 Range🟡 XAUUSD – Intraday Smart Money Plan | by Ryan_TitanTrader (23/12)
📈 Market Context
Gold remains structurally bullish on the higher timeframes, but price is now trading inside a compression zone after a clear impulsive expansion. With year-end liquidity thinning and traders positioning ahead of fresh Fed rate expectations and USD yield fluctuations, Gold is vulnerable to liquidity manipulation rather than clean continuation.
Recent USD softness and mixed macro headlines keep Gold supported, yet extended pricing near highs increases the probability of stop hunts on both sides before the next decisive move.
Smart Money behavior here favors range engineering — drawing in breakout traders above highs and shaking out impatient long positions below key demand — before revealing true intent.
🔎 Technical Framework – Smart Money Structure (1H)
Current Phase: Bullish HTF structure with short-term distribution
Key Idea: Expect liquidity interaction at premium (4540–4542) or discount (4450–4448) before displacement
Structural Notes:
• Higher-timeframe bullish BOS remains intact
• Recent CHoCH signals short-term distribution risk
• Price is trading in premium, extended from equilibrium
• Clear impulsive leg left unmitigated inefficiencies below
• A defined scalping range has formed between premium and discount
• Liquidity rests clearly above 4540 and below 4450
Liquidity Zones & Triggers:
• 🔴 SELL GOLD 4540 – 4542 | SL 4560
• 🟢 BUY GOLD 4450 – 4448 | SL 4440
🧠 Institutional Flow Expectation:
Liquidity sweep → MSS / CHoCH → BOS → displacement → FVG / OB retest → expansion
🎯 Execution Rules (matching your exact zones)
🔴 SELL GOLD 4540 – 4542 | SL 4560
Rules:
✔ Sweep above premium buy-side liquidity
✔ Bearish MSS / CHoCH on M5–M15
✔ Clear downside BOS with impulsive displacement
✔ Entry via bearish FVG refill or refined supply OB
Targets:
1. 4510
2. 4485
3. 4450 – extension if USD strengthens or yields push higher
🟢 BUY GOLD 4450 – 4448 | SL 4440
Rules:
✔ Liquidity grab into discount and prior demand
✔ Bullish MSS / CHoCH confirms demand control
✔ Upside BOS with strong bullish displacement
✔ Entry via bullish FGV fill or demand OB retest
Targets:
1. 4480
2. 4510
3. 4540 – extension if USD weakens and bullish flow resumes
⚠️ Risk Notes
• Premium trading increases fake breakout probability
• No entry without MSS + BOS confirmation
• Expect volatility during U.S. session and thin year-end liquidity
• Reduce risk around Fed-driven or USD yield headlines
📍 Summary
Gold is still bullish by structure, but current price action signals liquidity games inside a defined range. Smart Money is likely to engineer stops before expansion:
• A sweep above 4540 may fade back toward 4485–4450, or
• A liquidity grab near 4450 could reload long positions toward 4510–4540+
Let price show intent — Smart Money waits, retail reacts. ⚡️
📌 Follow @Ryan_TitanTrader for daily Smart Money gold breakdowns.

Essential Infrastructure Investments: Foundation for SustainableIntroduction
Essential infrastructure investments form the backbone of economic development, social well-being, and long-term national competitiveness. Infrastructure is not limited to roads and bridges; it includes power systems, water supply, digital networks, transport corridors, healthcare facilities, and urban services that enable societies and economies to function efficiently. In an era of rapid urbanization, climate change, technological disruption, and rising population demands—especially in emerging economies like India—strategic infrastructure investment has become a critical policy priority. Well-planned infrastructure enhances productivity, reduces inequality, supports private investment, and ensures resilience against future shocks.
Understanding Essential Infrastructure
Essential infrastructure refers to physical and institutional systems necessary for the operation of a modern economy and society. These include:
Economic infrastructure such as transportation, energy, logistics, and telecommunications.
Social infrastructure including healthcare, education, housing, and sanitation.
Digital infrastructure like broadband connectivity, data centers, and digital public platforms.
Environmental infrastructure covering water management, waste treatment, and renewable energy systems.
These systems are interlinked, and deficiencies in one area often constrain the effectiveness of others.
Role of Infrastructure in Economic Growth
Infrastructure investment directly contributes to economic growth by improving efficiency and lowering transaction costs. Reliable roads and railways reduce logistics expenses, efficient ports enhance trade competitiveness, and stable power supply boosts industrial productivity. Infrastructure also has a strong multiplier effect—every unit of investment generates employment, stimulates demand in allied industries like steel and cement, and crowds in private sector investment. For developing economies, infrastructure bridges regional disparities by integrating rural and urban markets and expanding access to economic opportunities.
Transportation Infrastructure: Connecting Markets and People
Transportation infrastructure is a cornerstone of development. Roads, railways, ports, and airports enable the smooth movement of goods and people. Investments in highways and freight corridors reduce travel time, fuel costs, and logistics inefficiencies. Urban public transport systems like metros and electric buses ease congestion, reduce pollution, and improve quality of life. In countries like India, projects such as dedicated freight corridors, expressways, and port modernization are crucial for supporting manufacturing growth and export competitiveness.
Energy Infrastructure: Powering Development
Reliable and affordable energy is essential for economic and social progress. Investments in power generation, transmission, and distribution ensure uninterrupted supply to industries and households. The global transition toward renewable energy has made investments in solar, wind, green hydrogen, and energy storage increasingly important. Modern energy infrastructure not only supports sustainability goals but also reduces dependence on fossil fuel imports, strengthens energy security, and aligns growth with climate commitments.
Water, Sanitation, and Urban Infrastructure
Water supply, sanitation, and waste management are fundamental to public health and urban sustainability. Investments in drinking water pipelines, sewage treatment plants, stormwater drainage, and solid waste management improve living conditions and reduce disease burden. Rapid urbanization demands smart urban infrastructure—integrated planning, efficient land use, affordable housing, and resilient cities that can withstand floods, heatwaves, and other climate risks.
Digital Infrastructure: Enabling the Modern Economy
Digital infrastructure has emerged as a new essential pillar. High-speed internet, mobile networks, cloud computing, and digital identity systems enable e-governance, financial inclusion, online education, telemedicine, and digital commerce. Investments in broadband connectivity, especially in rural and remote areas, reduce the digital divide and unlock productivity gains. Digital public infrastructure also enhances transparency, service delivery, and innovation across sectors.
Social Infrastructure: Investing in Human Capital
Healthcare, education, and skill development infrastructure are vital for long-term growth. Hospitals, schools, universities, and training centers enhance human capital, which is the true driver of sustainable development. Quality social infrastructure improves labor productivity, supports demographic dividends, and ensures inclusive growth. Public investment in these areas often delivers high social returns, even if immediate financial returns are limited.
Infrastructure Financing and Policy Frameworks
Financing essential infrastructure requires a mix of public spending, private participation, and innovative funding mechanisms. Governments play a central role through budgetary allocations, development banks, and policy support. Public-Private Partnerships (PPPs), infrastructure investment trusts (InvITs), green bonds, and sovereign funds help mobilize long-term capital. A stable regulatory framework, transparent bidding processes, and risk-sharing mechanisms are crucial to attract private investors and ensure project viability.
Challenges in Infrastructure Investment
Despite its importance, infrastructure development faces challenges such as land acquisition delays, regulatory bottlenecks, cost overruns, environmental concerns, and financing constraints. Poor project planning and governance can reduce efficiency and lead to underutilized assets. Climate risks also require infrastructure to be resilient and future-ready, increasing initial costs but reducing long-term losses.
Conclusion
Essential infrastructure investments are not merely capital expenditures; they are strategic investments in a nation’s future. By strengthening transportation, energy, digital, social, and environmental systems, governments can accelerate economic growth, improve quality of life, and enhance resilience. In a rapidly changing global environment, infrastructure that is sustainable, inclusive, and technologically advanced will determine long-term competitiveness. Countries that prioritize well-planned infrastructure investments today will be better positioned to achieve stable growth, social equity, and sustainable development in the decades ahead.

ETHUSD - Are Bears Ready for the Fall?ETHUSD on the 4H timeframe is clearly in a corrective downtrend, not a healthy bullish structure. The price action fits an Elliott Wave decline where wave 3 already completed near 2620 , followed by a weak and overlapping recovery that looks like wave 4. That recovery stayed inside a falling channel and never showed impulsive strength, which already tells you buyers are weak. More importantly, wave 4 is flirting with wave 1 territory, which puts the entire bullish hope on thin ice.
Right now, ETH is at a make or break zone. If this move is just a fake breakdown, price must quickly reclaim the channel and hold above recent highs. If not, then this is likely wave 5 of C, and downside continuation becomes the dominant scenario. The structure favors a final flush toward the 2380 to 2350 area, where wave 5 projection and channel support align. Anyone blindly bullish here is ignoring structure. This is not a buy the dip market, it is a wait for confirmation or respect the downtrend market.

Elliott Wave Analysis XAUUSD – 23/12/2025
1. Momentum
D1 (Daily):
The D1 momentum has already shifted to the upside. However, this reversal is occurring directly within the overbought zone. This suggests that the current bullish move may not be sustainable for long, and the risk of a medium-term reversal should be carefully monitored.
H4:
H4 momentum is currently compressed, indicating that the bullish move still has room to continue. That said, a momentum reversal can occur at any time. A single confirmed bearish H4 candle would likely trigger a corrective move lasting several H4 candles.
H1:
H1 momentum is currently turning down. Therefore, in the short term, there is a high probability of a pullback on the H1 timeframe, especially if the decline extends over several consecutive H1 candles.
2. Elliott Wave Structure
D1:
The current D1 wave structure shows that price has broken above the Wave 3 high. Although this does not completely invalidate the flat correction scenario, it serves as an important warning signal that requires close attention.
The 127% extension of the purple W wave is the next key observation zone. According to Elliott Wave theory, if price breaks below the base of wave W, wave X often extends toward the 127% level of wave W.
If price decisively breaks this zone, we must prepare for the possibility of a new bullish trend, potentially with a larger upside expansion. In that case, an updated scenario will be provided.
H4:
Wave 5 (blue) is currently extending. At this stage, the priority remains observation and confirmation from H4 momentum.
If a confirmed bearish H4 candle appears, we will reassess whether a short-term top has already been formed.
H1:
Within the red 5-wave structure, wave 5 is showing signs of extension. Inside this red wave 5, a smaller black 5-wave structure is developing.
When wave 5 extends, precise target projection becomes more challenging. Therefore, at this stage, we use the 127% extension of the purple W wave on D1, around the 4514 price zone, as the primary observation target.
If price breaks strongly above 4514, the probability of a new bullish trend increases significantly.
If price reaches this zone and reverses downward, the D1 flat correction scenario remains valid, and the downside target of the purple Y wave may be adjusted higher than initially expected.
3. Trading Plan & Targets
The 4514 zone is considered the primary Sell observation area. However, it is important to emphasize:
- Top picking always carries very high risk, even though potential rewards may be large
- With an extended wave 5, price action can become highly volatile and irregular
- Therefore, position sizing and strict risk management are mandatory
Sell Zone: 4514 – 4516
Stop Loss: 4535
Take Profit 1: 4420
Take Profit 2: 4348

Bitcoin's Path to $1 million by October 2029Look at the beauty of mathematics and how Bitcoin follows a structured price escalation cycle after cycle.
RED: The average time span between every market top is 1,444 days.
GREEN: The average time span between every market bottom is 1,433 days.
BLUE: The average time span between cycle top to cycle bottom is 390 days.
PURPLE: The average time span between cycle bottom to cycle top is 1,059 days.
According to these calculations, the next market bottom is expected in October 2026, and subsequently, Bitcoin may reach a $1 million price by October 2029.

BTC DIFFERENT VIEW OF SUPPORT & RESISTANCEIn this chart and previous post there is diference what is that
In this chart i used only 3-4 lines to get S/R If youare going to analyse first of allyou should have to remember that there is not necessary that 1/1 line must be in 45 degree.Necessary is that both the fan must be in 90 degree exactly.
Here all the supports and resistances are in yellow horizontal line which is cross ponts of lines.It's an idea only to find S/R.

McDonalds Elliott wave breakdown and double correction outlookMcDonald's Elliott Wave Breakdown & Double Correction Outlook
Dear Traders,
McDonald's stock has recently completed a textbook five-wave impulsive structure, followed by a complex double correction. Based on current wave dynamics and Fibonacci projections, the price may retrace toward the 287 or even 277 levels.
Let’s dissect the wave structure:
🔹 Impulse Wave Formation
- Wave 1: Initiated from $243 on July 9, 2024, and peaked at $262 on July 19, 2024.
- Wave 2: Retraced to $246.12 by July 24, 2024, correcting over 61.8% of Wave 1. Importantly, it respected the Elliott rule that Wave 2 must not breach the origin of Wave 1.
- Wave 3: Extended sharply to $317 by October 21, 2024, exceeding 3.618× the length of Wave 1, validating its role as the strongest and longest wave.
- Wave 4: Pulled back approximately 50% of Wave 3, without overlapping Wave 1 territory—compliant with Elliott guidelines.
- Wave 5: Formed a clear five-wave substructure and extended 2.618× Wave 1, completing the impulsive sequence.
🔸 Technical Confirmation
- RSI Divergence: Positive divergence observed between Waves 3 and 5, reinforcing the exhaustion of the bullish impulse.
🔻 Double Correction Structure
Following the impulse, price action transitioned into a complex flat correction, exhibiting a 3-3-5 structure:
it is in double flat pattern and it has completed X wave
📌 Conclusion: The completed impulse and confirmed double correction suggest further downside potential. Key Fibonacci support zones lie at $287 and $277, which may act as reversal zones.
Stay sharp and trade with discipline.

SilverSilver imbalance at the marked zone silver will go till that level short silver with sl of ATH price

NIFTY 50: Transition Phase — Time-Based Wave (4) vs Final Extn.NIFTY continues to trade within a long-term rising channel, maintaining the integrity of the broader bullish structure from the pandemic low. However, recent price behavior suggests the market is no longer in a clean trending phase and may be transitioning into a structural digestion phase.
Primary Structure
From the 2020 low, NIFTY developed a clear impulsive advance, with Wave (3) delivering strong upside momentum. Since then, price action has slowed, overlap has increased, and progress has become more rotational than directional.
Despite this, no major structural support has been violated, and the long-term trend remains intact.
Alternate Interpretation: Wave (4) in Progress
An equally valid interpretation is that NIFTY has already completed a higher-degree Wave (3) and is now unfolding a time-based Wave (4) correction.
Historically, NIFTY’s Wave (4) phases tend to be:
Sideways and frustrating
Volatile with sharp pullbacks and quick recoveries
Characterized by sector rotation rather than index expansion
A close parallel can be observed in the early-2022 phase , where the market consolidated for an extended period while preserving the larger bullish trend.
The current price behavior, channel interaction, and momentum profile align well with this pattern.
Momentum Perspective
Weekly RSI is holding in a neutral-bullish zone but lacks the expansion typically seen at the start of a fresh Wave (5). This supports the view that the market is consolidating through time rather than correcting deeply through price.
Importantly, RSI is not breaking down — arguing against a bearish trend reversal.
How to Approach This Phase
At this stage, the market does not reward aggressive index positioning. A disciplined approach is to:
Assume Wave (4) behavior (range, volatility, muted returns)
Avoid chasing breakouts without clear impulsive confirmation
Avoid aggressive shorts while the channel structure holds
Let price prove the start of Wave (5), rather than anticipating it
What Would Change the View
A
clean, impulsive breakout with momentum expansion would favor the start of Wave (5)
Prolonged range-bound action with rotational behavior would confirm a broader Wave (4) phase
Until one of these resolves decisively, patience remains the edge.
Conclusion
NIFTY appears to be in a structural transition zone — not bearish, but no longer in a strong trending phase. The broader trend remains intact, but index-level returns may stay muted until the market clearly exits this consolidation.
Trend intact. Direction unclear. Patience required.
Educational & structural analysis only. Not a buy/sell recommendation.

short-term consolidation or "cooling off" phase1. Market Context & Current Setup
The Trend: The long-term trend is strongly bullish, with Gold gaining roughly 70% in 2025 and recently hitting record highs above $4,500.
The Rejection: The chart shows a sharp rejection from a peak near 4,526. The indicator has flipped from green to red, issuing a "SELL" tag near 4,510, which suggests immediate momentum has shifted to the downside.
Key Support Levels: Price is currently hovering near the 0.5 Fibonacci level (4,492). Analysts identify the $4,485 – $4,491 zone as a critical support area where buyers may step back in.
External Factors: A weaker U.S. Dollar and escalating geopolitical tensions (specifically between the US and Venezuela) are providing a fundamental floor for these high prices.
2. Strategy for Your Next Move
Because the primary trend is bullish but the 15-minute signal is "SELL," your strategy depends on your risk tolerance:
Option A: The Conservative "Buy the Dip" (Higher Probability)
Wait for the current minor retracement to find a floor at the support levels before entering a long position.
Entry: Look for a "BUY" signal or bullish candlestick patterns (like long lower wicks) near 4,485 – 4,491.
Targets: Aim for a return to 4,510 and eventually the recent high of 4,526.
Stop Loss: Place just below the 4,479 level to protect against a deeper breakdown.
Option B: Scalping the Sell (Higher Risk)
If you are already in the "Sell" trade triggered at 4,510, you are trading against the main trend but with short-term momentum.
Management: Secure partial profits or move your Stop Loss to the entry price ("breakeven") now that gold is near 4,500.
Target: The next major support at 4,485.
Warning: Gold is extremely volatile at these all-time highs; avoid "chasing" the price downward if it has already dropped significantly from the signal.
Summary Recommendation (Make sure by your own)
The market is currently in a "healthy pause" rather than a full reversal. While the 15-minute chart shows a sell signal, it is likely a reset to absorb recent gains before another leg up.

BTC LONG TERM ANALYSIS WITH GANN FANIf you see my chart there is all the reversal are shown here and you will see that gann fan angle wored beutifully.All gann line labled here as 1/1,1/2,1/4........and you can see here these fan line exihibited support and resistance. this gann fan is ploted as per scale. so nobody can deny it.
arrows are indicating reversal.Now BTC at its strong support and here it may accumullation/distribution is going on just waiting for the time to break up/down side. decision wil be yours what to do.
decide after price action.I will show you another analysis for BTC next by diferrent angle to show that this support is strong.

Understanding the Foundation of Financial MarketsPrimary Market vs Secondary Market
Financial markets play a crucial role in the functioning of modern economies by facilitating the flow of capital between investors and entities that need funds. At the core of these markets lie two fundamental segments: the Primary Market and the Secondary Market. Though closely connected, they serve distinct purposes and operate in different ways. Understanding the difference between the primary and secondary market is essential for investors, companies, policymakers, and anyone interested in how capital markets function.
What Is the Primary Market?
The primary market is the segment of the financial market where new securities are created and issued for the first time. In this market, companies, governments, or public sector institutions raise fresh capital directly from investors. The money invested flows straight to the issuer and is used for productive purposes such as business expansion, infrastructure development, debt repayment, or working capital needs.
The most common example of the primary market is an Initial Public Offering (IPO), where a private company offers its shares to the public for the first time. Other forms include Follow-on Public Offers (FPOs), Rights Issues, Private Placements, and Preferential Allotments.
In the primary market, securities are priced either through a fixed price issue or a book-building process, where investor demand determines the final price. Once investors subscribe to these securities and allotment takes place, the role of the primary market ends for those instruments.
Key Features of the Primary Market
Creation of Securities
The primary market is responsible for the birth of new financial instruments such as shares, bonds, and debentures.
Direct Fund Flow to Issuers
Funds collected go directly to the issuing company or government, supporting economic growth and capital formation.
Limited Time Access
Primary market issues are open for a limited period, after which subscriptions close.
Higher Risk for Investors
Since securities are newly issued, investors rely on company fundamentals, future prospects, and disclosures rather than past market performance.
Regulatory Oversight
In India, the primary market is regulated by SEBI, ensuring transparency, disclosures, and investor protection.
What Is the Secondary Market?
The secondary market is where existing securities are bought and sold among investors after they have been issued in the primary market. Stock exchanges such as the NSE and BSE in India are prime examples of secondary markets. Here, investors trade shares, bonds, ETFs, and derivatives at prevailing market prices.
Unlike the primary market, the issuing company does not receive any money from secondary market transactions. Instead, ownership of securities simply changes hands between buyers and sellers. The secondary market provides liquidity, price discovery, and an exit route for investors.
Key Features of the Secondary Market
Trading of Existing Securities
Securities already issued in the primary market are traded multiple times.
Liquidity Provision
Investors can easily convert their holdings into cash, making investments more attractive.
Continuous Price Discovery
Prices fluctuate based on demand, supply, company performance, economic data, and global events.
Lower Entry Barriers
Investors can participate with smaller amounts compared to primary market investments.
Speculation and Hedging
Traders, investors, institutions, and hedgers all participate, adding depth and volume to the market.
Primary Market vs Secondary Market: Key Differences
Basis Primary Market Secondary Market
Nature Issue of new securities Trading of existing securities
Fund Flow Goes to issuing company Goes to selling investor
Price Determination Fixed or book-built Market-driven
Risk Level Higher (future uncertainty) Relatively lower (track record available)
Liquidity Low (locked until listing) High (daily trading)
Purpose Capital formation Liquidity & wealth creation
Role in the Economy
The primary market supports economic development by enabling companies and governments to raise funds for growth-oriented activities. Without a strong primary market, new businesses would struggle to access capital.
The secondary market, on the other hand, ensures market efficiency and investor confidence. Liquidity and transparent pricing encourage more participation, which indirectly benefits issuers by lowering their future cost of capital.
Both markets are interdependent. A strong secondary market improves the success of primary issues, while a healthy pipeline of primary market issuances keeps the secondary market vibrant.
Investor Perspective
From an investor’s point of view, the choice between primary and secondary markets depends on risk appetite and investment strategy.
Primary Market Investors often seek early entry into high-growth companies and may benefit significantly if the company performs well post-listing. However, poor listing performance or weak fundamentals can lead to losses.
Secondary Market Investors can analyze historical prices, financial results, and market trends before investing, offering more flexibility and control.
Long-term investors often participate in both markets—subscribing to quality IPOs and building portfolios through secondary market purchases.
Conclusion
The primary and secondary markets together form the backbone of the financial system. The primary market enables capital formation and fuels economic growth, while the secondary market ensures liquidity, transparency, and efficient price discovery. Neither market can function effectively in isolation; their synergy sustains investor confidence and economic progress.
For anyone involved in investing or trading—especially in markets like India—understanding the distinction between these two markets is essential for making informed decisions, managing risk, and achieving long-term financial goals.

Blockchain and Tokenized AssetsRedefining Ownership, Finance, and the Global Economy
Blockchain technology and tokenized assets represent one of the most transformative shifts in the modern financial and economic landscape. What began as the underlying infrastructure for cryptocurrencies has evolved into a powerful system capable of redefining ownership, trust, and value exchange across industries. At its core, blockchain introduces a decentralized, transparent, and immutable ledger, while tokenization converts real-world and digital assets into blockchain-based tokens. Together, they are reshaping finance, investment, governance, and even the concept of property itself.
Understanding Blockchain: The Foundation
Blockchain is a distributed ledger technology where transactions are recorded across a network of computers (nodes). Unlike traditional centralized systems controlled by a single authority, blockchain operates on decentralization and consensus. Every transaction is validated by the network, cryptographically secured, and permanently stored in blocks that are linked together in chronological order.
This structure creates three powerful advantages. First, transparency, as all participants can verify transactions. Second, immutability, meaning once data is recorded, it cannot be altered without consensus. Third, trust minimization, as intermediaries such as banks, brokers, or clearinghouses become less necessary. These characteristics make blockchain an ideal platform for handling value, ownership, and contracts.
What Are Tokenized Assets?
Tokenized assets are representations of real-world or digital assets on a blockchain in the form of tokens. These tokens can represent almost anything of value—stocks, bonds, real estate, commodities, art, intellectual property, or even carbon credits. Each token carries information about ownership rights, transferability, and sometimes income entitlements.
There are two broad categories of tokenized assets:
Fungible tokens, where each unit is identical (such as tokenized shares or stablecoins).
Non-fungible tokens (NFTs), where each token is unique, commonly used for art, collectibles, and unique assets.
Tokenization bridges the physical and digital worlds, allowing traditionally illiquid or inaccessible assets to be traded efficiently on global platforms.
How Tokenization Transforms Ownership
One of the most revolutionary impacts of tokenized assets is fractional ownership. Traditionally, assets like real estate, infrastructure projects, or fine art require significant capital. Tokenization allows these assets to be divided into smaller units, enabling retail investors to participate with minimal capital.
This democratization of access changes investment dynamics. A commercial building, for example, can be tokenized into thousands of units, allowing investors worldwide to own fractions, earn rental yields, and trade their holdings instantly. Ownership becomes more inclusive, liquid, and global.
Impact on Financial Markets
Tokenized assets have profound implications for financial markets. Settlement times, which traditionally take days, can be reduced to minutes or seconds through blockchain-based transactions. This lowers counterparty risk, reduces costs, and improves capital efficiency.
Furthermore, 24/7 trading becomes possible. Unlike traditional stock exchanges with fixed hours, tokenized assets can be traded continuously across borders. This creates a more dynamic market environment and aligns with the always-on nature of the global economy.
In addition, smart contracts—self-executing programs on the blockchain—automate compliance, dividend payments, interest distribution, and corporate actions. This automation reduces operational errors and intermediaries, making financial systems leaner and more resilient.
Use Cases Beyond Finance
While finance is the most visible application, blockchain and tokenization extend far beyond it.
Real Estate: Property records can be tokenized, enabling instant transfers, transparent ownership history, and reduced fraud.
Commodities: Gold, oil, and agricultural products can be tokenized, simplifying trade, storage verification, and settlement.
Supply Chains: Tokenized tracking of goods ensures authenticity, reduces counterfeiting, and enhances traceability.
Intellectual Property: Music, patents, and digital content can be tokenized, allowing creators to monetize directly and retain control.
Carbon Credits and ESG Assets: Tokenization enables transparent tracking and trading of environmental assets, supporting sustainability goals.
These applications demonstrate that tokenization is not just a financial innovation, but an economic infrastructure upgrade.
Regulation and Institutional Adoption
As tokenized assets grow, regulation becomes a critical factor. Governments and regulators worldwide are working to balance innovation with investor protection. Clear legal frameworks around digital ownership, custody, taxation, and compliance are essential for mainstream adoption.
Institutional players—banks, asset managers, exchanges, and central banks—are increasingly embracing blockchain. Central Bank Digital Currencies (CBDCs), tokenized government bonds, and regulated digital asset exchanges signal that blockchain is moving from the fringes to the core of the financial system.
For markets like India, tokenization presents opportunities to improve market efficiency, attract global capital, and enhance financial inclusion—provided regulatory clarity evolves alongside technology.
Risks and Challenges
Despite its promise, blockchain and tokenized assets face challenges. Cybersecurity risks, smart contract vulnerabilities, and technology scalability remain concerns. Market volatility, particularly in crypto-linked tokens, can deter conservative investors.
Legal recognition of tokenized ownership is another hurdle. Without enforceable rights in the physical world, tokenized assets risk remaining purely digital representations. Education is also essential, as investors must understand the technology, risks, and valuation methods.
The Future of Tokenized Economies
Looking ahead, tokenization is likely to become a standard feature of global markets. As infrastructure matures, assets of all kinds may exist simultaneously in physical and tokenized forms. Financial systems could evolve into interoperable networks where assets move seamlessly across platforms and jurisdictions.
Blockchain-based identities, programmable money, and decentralized finance (DeFi) will further integrate with tokenized assets, creating a more open and efficient economic system. Ownership may shift from static records to dynamic, programmable rights embedded directly in digital tokens.
Conclusion
Blockchain and tokenized assets represent a fundamental shift in how value is created, owned, and exchanged. By combining transparency, efficiency, and global accessibility, they challenge traditional systems while opening new possibilities for investors, institutions, and economies. Although regulatory, technical, and educational challenges remain, the trajectory is clear: tokenization is not a passing trend, but a structural evolution. As adoption accelerates, blockchain-powered assets are set to redefine the future of finance and the global economy itself.

Gold 1H – Traps form near 4500–4420.Gold 1H – Liquidity Compression Sets Traps Around 4500–4420
🟡 XAUUSD – Intraday Smart Money Plan | by Ryan_TitanTrader (23/12)
📈 Market Context
Gold is trading inside a strong bullish structure after a clean impulsive expansion, currently hovering in a premium zone near recent highs. With price extended from the mean, the market is vulnerable to liquidity engineering rather than immediate continuation.
CPI uncertainty and mixed USD flows continue to reduce directional conviction, favoring stop hunts at key psychological levels instead of clean breakouts. This environment often rewards patience and confirmation-based execution rather than anticipation.
Smart Money is likely to manipulate both sides of the range — sweeping late buyers above 4500 or shaking out weak longs into the 4420 discount before the next meaningful expansion.
🔎 Technical Framework – Smart Money Structure (1H)
Current Phase: Bullish structure with signs of short-term distribution
Key Idea: Expect liquidity interaction at 4500–4502 (premium) or 4420–4418 (discount) before displacement
Structural Notes:
• Higher-timeframe bullish BOS remains intact
• Price is trading deep in premium, extended from equilibrium
• Clear impulsive leg created unmitigated FVGs below current price
• Momentum is slowing near highs → distribution risk
• Liquidity is resting clearly above 4500 and below 4420
Liquidity Zones & Triggers:
• 🔴 SELL GOLD 4500 – 4502 | SL 4510
• 🟢 BUY GOLD 4420 – 4418 | SL 4410
🧠 Institutional Flow Expectation:
Liquidity sweep → MSS / CHoCH → BOS → displacement → FVG / OB retest → expansion
🎯 Execution Rules (matching your exact zones)
🔴 SELL GOLD 4500 – 4502 | SL 4510
Rules:
✔ Sweep above psychological 4500 buy-side liquidity
✔ Bearish MSS / CHoCH on M5–M15
✔ Clear downside BOS with impulsive displacement
✔ Entry via bearish FVG refill or refined supply OB
Targets:
1. 4470
2. 4450
3. 4420 – extension if USD firms or risk-off accelerates
🟢 BUY GOLD 4420 – 4418 | SL 4410
Rules:
✔ Liquidity grab into discount and bullish structure support
✔ Bullish MSS / CHoCH confirms demand control
✔ Upside BOS with strong bullish displacement
✔ Entry via bullish FVG fill or demand OB retest
Targets:
1. 4450
2. 4475
3. 4500 – extension if USD weakens and bullish flow resumes
⚠️ Risk Notes
• Extended bullish moves increase fake breakout probability
• No entry without MSS + BOS confirmation
• Expect volatility during U.S. session
• Reduce risk around CPI-related or Fed-driven headlines
📍 Summary
Gold remains structurally bullish, but trading at premium levels where conviction is fragile. Smart Money is likely to engineer liquidity before the next expansion:
• A sweep above 4500 may fade toward 4450–4420, or
• A liquidity grab near 4420 could reload bullish flow toward 4475–4500+
Let price reveal intent — Smart Money waits, retail rushes. ⚡️
📌 Follow @Ryan_TitanTrader for daily Smart Money gold breakdowns.
