Gold retests highs as upside momentum shows signs of fatigueGold saw a strong rally, reaching the 4497 zone before facing resistance and correcting toward 4431. The price later bounced and revisited the upper area near 4493, confirming it as a significant reaction zone. Multiple attempts at the highs indicate that buying strength may be losing pace, with price action showing hesitation near supply. After such an extended move, some rebalancing is natural. From the current area, selling pressure may slowly build, allowing room for a corrective move. A drift toward the 4400 zone is possible as volatility cools and short-term traders adjust positions. If sellers remain engaged, price action may stay subdued into the close and carry a softer tone into the next session. Staying disciplined with risk is important near these levels.
Wave Analysis

SENSEX : Trading levels and Plan for 24-Dec-2025SENSEX Trading Plan for 24-Dec-2025
(Chart reference: 15-min | Gap criteria considered: 300+ points)
Key Levels to Track (from chart)
Major Upside Resistance: 86,241.83
Last Intraday Resistance: 85,996.00
Upper Range Resistance: 85,690.62
Opening Support / Resistance (Pivot): 85,453.00 – 85,499.60
Last Intraday Support: 85,131.00
Lower Support: 84,918.00
🟢 1. GAP-UP OPENING (300+ Points)
If SENSEX opens well above 85,690, price enters a strong supply zone immediately.
🎓 Educational Explanation:
A 300+ point gap-up generally reflects strong global or overnight cues. However, when price opens near higher-timeframe resistance, smart money often books profits. Sustainable upside usually comes only after acceptance above resistance or a healthy retest, not from straight vertical moves.
Plan of Action:
If price sustains above 85,690 for 15–20 minutes, look for pullback-based long entries.
First upside hurdle is 85,996; watch for volume expansion and candle acceptance.
Acceptance above 85,996 opens the path toward 86,241.83.
Rejection or exhaustion candles near 85,996–86,241 can trigger a pullback toward 85,690.
Option buyers should avoid chasing CE at the open; confirmation is crucial for better R:R.
🟡 2. FLAT OPENING
A flat open near 85,450–85,550 places SENSEX inside the opening pivot range.
🎓 Educational Explanation:
Flat openings signal equilibrium between buyers and sellers. Direction usually emerges after a clear break of the opening range. Trading inside this zone without confirmation often leads to whipsaws and premium decay for option buyers.
Plan of Action:
Sustaining above 85,499.60 keeps bullish bias intact, targeting 85,690 → 85,996.
Failure to hold 85,453 increases downside risk toward 85,131.
Bullish rejection near 85,131 can offer low-risk bounce trades back to 85,453–85,499.
Breakdown and acceptance below 85,131 shifts momentum toward 84,918.
🔴 3. GAP-DOWN OPENING (300+ Points)
If SENSEX opens below 85,131, early sentiment turns clearly weak.
🎓 Educational Explanation:
Large gap-downs are often driven by panic or negative overnight news. Strong demand zones, however, tend to attract short-covering and positional buying. Selling blindly at support increases the risk of sharp reversals.
Plan of Action:
First support to watch is 85,131 — observe price behaviour and candle structure.
Breakdown below 85,131 opens downside toward 84,918.
Strong bullish reversal signals near 84,918 may lead to a sharp intraday bounce.
Any pullback toward 85,453 after breakdown can be used as a selling-on-rise opportunity.
⚙️ Risk Management Tips for Options Traders 🛡️
Avoid trading the first 10–15 minutes on 300+ point gap days.
Never buy options at resistance or sell at support without confirmation.
Use time-based stop-loss (15–20 minutes) if premium does not move.
Risk only 1–2% of total capital per trade.
Prefer ATM options or defined-risk spreads to manage theta decay.
Book partial profits near marked resistance/support levels.
🧾 Summary & Conclusion
Above 85,690: Bulls stay active; targets 85,996 → 86,241.
Between 85,131–85,690: Market remains balanced; patience is key.
Below 85,131: Sellers gain control unless buyers defend 84,918.
Trade price behaviour at levels, not emotions or predictions.
Consistency comes from discipline, confirmation, and risk control.
⚠️ Disclaimer
I am not a SEBI-registered analyst. This trading plan is for educational purposes only and should not be considered financial or investment advice. Please consult your financial advisor before taking any market positions.

NIFTY : Trading levels and Plan for 24-Dec-2025NIFTY Trading Plan for 24-Dec-2025
(Chart reference: 15-min | Gap criteria considered: 100+ points)
Key Levels to Track (from chart)
Opening Resistance: 26,266
Last Intraday Resistance: 26,341
Major Upside Resistance: 26,426
Opening Support / Resistance (Pivot): 26,165
Opening Support (Gap-down reference): 26,098
Last Intraday Support: 26,030
Lower Support: 25,919.85
🟢 1. GAP-UP OPENING (100+ Points)
If NIFTY opens above 26,266, price starts the session near a known supply zone.
🎓 Educational Explanation:
A gap-up above resistance shows bullish sentiment, but supply zones attract profit booking. Professional traders wait for acceptance above resistance or a retest before entering. Chasing price at the open often gives poor risk-reward.
Plan of Action:
If price sustains above 26,266 for 10–15 minutes, look for pullback-based long entries.
First upside target is 26,341 (last intraday resistance).
Acceptance above 26,341 can extend the move toward 26,426.
Rejection or exhaustion near 26,341–26,426 may lead to a pullback toward 26,266.
Option buyers should prefer ATM / ITM Calls only after confirmation, not on opening spikes.
🟡 2. FLAT OPENING
A flat open around 26,140–26,200 keeps NIFTY near the opening pivot (26,165).
🎓 Educational Explanation:
Flat opens indicate balance between buyers and sellers. Direction usually emerges only after the opening range is broken. Trading inside this zone without confirmation often results in whipsaws.
Plan of Action:
Sustaining above 26,165 keeps bullish bias intact, targeting 26,266 → 26,341.
Failure to hold 26,165 increases downside risk toward 26,098.
Bullish rejection near 26,098 offers a low-risk bounce trade back to 26,165.
Breakdown and acceptance below 26,098 shifts momentum toward 26,030.
🔴 3. GAP-DOWN OPENING (100+ Points)
If NIFTY opens below 26,098, early sentiment turns cautious to bearish.
🎓 Educational Explanation:
Gap-down openings are often driven by fear. However, strong demand zones attract short-covering and positional buying. Selling blindly into support increases the probability of getting trapped.
Plan of Action:
First support to watch is 26,030 — observe candle structure and volume.
Breakdown below 26,030 opens the downside toward 25,919.85.
Strong bullish reversal signals near 25,919.85 may lead to a sharp intraday bounce.
Any pullback toward 26,098 after a breakdown can be used as a selling-on-rise opportunity.
⚙️ Risk Management Tips for Options Traders 🛡️
Avoid trading in the first 5–10 minutes during gap openings.
Do not buy options at resistance or sell at support without confirmation.
Use time-based stop-loss (15–20 minutes) if premium doesn’t move.
Risk only 1–2% of capital per trade.
Prefer ATM options or defined-risk spreads to control theta decay.
Book partial profits near key resistance/support levels.
🧾 Summary & Conclusion
Above 26,266: Bulls remain active; targets 26,341 → 26,426.
Between 26,098–26,266: Market remains balanced; patience is essential.
Below 26,098: Sellers gain control unless buyers defend 26,030 / 25,919.85.
Focus on price behaviour at predefined levels, not prediction.
Consistency comes from discipline, confirmation, and risk control.
⚠️ Disclaimer
I am not a SEBI-registered analyst. This trading plan is for educational purposes only and should not be considered financial or investment advice. Please consult your financial advisor before taking any trades.

APOLLOTYRE : adjusting its base.📘 APOLLOTYRE – Technical Analysis & Trading Plan
(Chart timeframe: Daily | Structure & Wave-based analysis)
🔍 Market Structure Overview
APOLLOTYRE has already signaled a Change of Character (CHoCH) after breaking its prior bearish structure, confirming a trend transition from distribution to accumulation. Since then, price has respected higher lows and moved within a rising structure.
Currently, price is correcting within a healthy pullback phase, aligning with a Wave 4 retracement, while the broader trend remains bullish.
📐 Key Technical Zones (From Chart)
• Wave 4 Completion / Demand Zone: 492 – 510
• Invalidation Level / SL: 488.55 (Day close below)
• First Target Zone: 546 – 553
• Second Target: 570
📊 Technical Interpretation
The ongoing decline appears corrective rather than impulsive, suggesting trend continuation bias.
Price is consolidating above the rising trendline, indicating structural strength.
The 492–510 zone overlaps with prior demand and trendline support, making it a high-probability accumulation area.
Holding above 488.55 keeps the bullish structure intact.
A sustained move above recent swing highs confirms Wave 5 activation.
🎯 Prediction / Probable Scenario
If price holds above 492–510, APOLLOTYRE is likely to resume its upward trajectory.
Initial expansion expected toward 546–553, where partial profit booking is advisable.
Acceptance above the first target zone may extend the rally toward 570.
Failure to hold 488.55 would invalidate the bullish count and open room for deeper correction.
🟢 Buying Strategy (Swing / Positional)
Buying Zone: 492 – 510 (on confirmation / bullish price action)
Stop Loss: Day close below 488.55
Target 1: 546 – 553
Target 2: 570
Maintain partial profit booking at Target 1 and trail SL for positional continuation.
This setup offers a favourable risk–reward structure, suitable for capturing a potential impulsive Wave 5 move.
🎓 Educational Notes for Traders
CHoCH (Change of Character) signals early trend reversal before traditional indicators.
Wave 4 corrections are typically sideways or overlapping and should not break key demand zones.
Strong trends correct in price and time, not always deeply in price.
The best trades emerge when structure, trendline, and demand zones align.
Always wait for price confirmation, not prediction.
🧠 Risk Management Reminder
• Avoid over-leveraging during corrective phases
• Respect day-close based stop losses
• Risk only 1–2% capital per trade
• Partial booking improves psychological discipline
⚠️ Disclaimer
I am not a SEBI-registered analyst. This analysis is for educational purposes only and should not be considered financial advice. Please consult your financial advisor before taking any trade.

Price action understanding that will change the way you tradeI make educational content videos for swing trading . In this video I have used concepts like Trendlines, Counter trendlines, zones, Support and Resistance, Market fall, Targets and Exit plan for any trade setup and most importantly use of lines with multi time frame analysis .
Charts used are 3 months or older

XAGUSD (Silver): Impulsive Structure IntactXAGUSD (Silver): Impulsive Structure Intact, Consolidation Before Continuation
Silver continues to trade within a well-defined rising channel on the 3H timeframe, maintaining a clear bullish structure from the November lows. Despite short-term fluctuations, the broader price action remains orderly and directional, showing no signs of structural breakdown.
Elliott Wave Structure
From the base, silver has developed a clean impulsive sequence:
Wave (1): Initial breakout from the base
Wave (2): Shallow pullback, holding above key support — a strength signal
Wave (3): Strong expansion leg, supported by momentum
Wave (4): Currently unfolding as a shallow, time-based consolidation
Wave (5): Projected higher toward the upper channel and Fibonacci extension zone
The preferred count assumes Wave (3) is complete and Wave (4) is in progress. Importantly, this correction is unfolding more through time than price, which is typical of strong trends.
An alternate count is also considered, where the current structure could still be part of an extended Wave (3), followed by a slightly deeper Wave (4). However, this alternate scenario does not negate the bullish structure — it only allows for extended consolidation before continuation.
Channel & Price Structure
Price continues to respect a multi-parallel rising channel:
Wave (2) and Wave (4) align well with the lower channel
Wave (3) reacts near the upper boundary
Current price remains comfortably within the channel
This behavior supports the view that silver is consolidating within trend rather than transitioning into a reversal phase.
Momentum (RSI) Perspective
RSI remains in a bullish regime, holding above the mid-zone and cooling gradually after the prior expansion. There is no meaningful bearish divergence against price, suggesting that momentum is being reset rather than exhausted.
This momentum behavior aligns better with a Wave (4) consolidation than with a completed market top.
Key Conditions to Watch
The bullish structure remains valid as long as:
Price stays within the rising channel
Key support near 62.85 is respected
No overlap occurs into Wave (1) territory
Only a decisive break below channel support, combined with a momentum regime shift, would force a reassessment.
Conclusion
Silver is not showing signs of distribution or trend failure. Both the primary and alternate Elliott counts point toward continuation higher once the current consolidation phase completes. Until structure is proven otherwise, intraday volatility should be treated as noise rather than signal.
Trend remains constructive. Structure remains the guide.
(Educational analysis only. Not a trading recommendation.)

Gold (XAUUSD): RSI Cooling Is Not WeaknessGold’s recent price action may appear volatile on lower timeframes, but structurally the market is behaving exactly as a healthy trend should. The current pause is not a sign of exhaustion — it is a necessary reset within a larger impulsive advance.
The Bigger Picture: Trend Comes First
From the November lows, gold has developed a clear impulsive structure. The advance is directional, non-overlapping, and supported by momentum — all characteristics of a genuine trend rather than a corrective bounce.
Price continues to respect a rising parallel channel drawn from the Wave (2) low, with Wave (3) expanding cleanly toward the upper boundary. This channel behavior alone tells us one thing clearly: the primary trend remains intact.
Elliott Wave Context: Where Are We Now?
The advance from November fits well into a higher-degree impulsive sequence:
Wave (1): Initial breakout from the base
Wave (2): Shallow, sideways correction — a strength signal
Wave (3): Strong expansion leg with momentum confirmation
Wave (4): Currently in progress as a consolidation
Wave (5): Yet to unfold
What matters most is this: Wave (4) is unfolding through time, not through aggressive price damage. That distinction separates healthy trends from failing ones.
RSI Cooling: A Bullish Reset, Not a Warning
RSI reached overbought conditions during the Wave (3) expansion — exactly what strong trends are expected to do. Since then, RSI has begun to cool off, but notably:
It remains above the 50–55 zone
There is no meaningful bearish divergence
Momentum is resetting without price breakdown
This is classic Wave (4) behavior. Strong markets pause to absorb gains; they do not collapse immediately after expansion.
RSI cooling in this context is preparation, not deterioration.
Fibonacci & Structure Alignment
The current consolidation remains well within the ideal retracement zone for a Wave (4), aligning with shallow Fibonacci levels and the channel structure. Price has not violated prior impulse highs, and no overlap is present — both essential conditions for maintaining bullish integrity.
As long as price remains within the channel and above key structural supports, the broader bullish thesis remains valid.
What Would Actually Change the View?
This analysis does not change because of intraday volatility or short-term pullbacks. The structure would only come into question if:
Price breaks decisively below the rising channel
Wave (1) territory is violated
RSI shifts into a sustained bearish regime below 45
None of these conditions are currently in play.
Verdict:
➡️ Trend remains UP.
➡️ Buy-on-dips / hold positions as long as structure holds.
➡️ Avoid reacting to intraday noise.
Invalidation:
Only a decisive break below channel support changes the view.
Final Thought
Markets do not reverse because momentum cools. They reverse when structure breaks.
At present, gold is not breaking structure — it is consolidating within it. Until proven otherwise, this remains a higher-degree bullish trend experiencing a normal, healthy pause.
Ignore the noise. Respect the structure.
⚠️ Disclaimer:
For educational & analysis purposes only. Not a buy/sell recommendation. Trade with proper risk management.

Symmetrical Triangle consolidation pattern1. Market Context: The Consolidation Phase
Gold had a massive run-up (the "pole" of the move) and is now "breathing." The price is getting squeezed between a descending resistance line and an ascending support line.
The Symmetrical Triangle: This indicates indecision. Buyers are stepping in at higher lows, but sellers are capping the price at lower highs.
The Purple Zone (4,480 – 4,487): This is your immediate "Value Area." The price is currently oscillating right in the middle of this zone, meaning there is no clear dominance from either side yet.
RSI Indicator: The RSI at the bottom is hovering near the 50 level. This confirms a neutral momentum; the market isn't overbought or oversold, it's waiting for a catalyst.
2. Potential Scenarios
Symmetrical triangles are generally continuation patterns, meaning there is a higher probability it breaks in the direction of the prior trend (Up). However, they can break either way.
Bullish Breakout (Upper Blue Arrow): If the price closes a 15m candle above the descending white resistance line (approx. 4,490), it signals that the bulls have regained control. The target would be the recent high near 4,500+.
Bearish Breakdown (Lower Blue Arrow): If the price closes below the ascending support line (approx. 4,478), it suggests a deeper correction toward the next major support level at 4,469.
3. Your Next Decision
Since the price is currently at the "apex" (the tip) of the triangle, taking a trade right now is high-risk because you are essentially guessing the direction.
The "Smart Money" Move:
Wait for the Breakout: Do not trade inside the triangle. Wait for a candle to close outside the white trendlines.
Confirm with Volume: Look for an increase in momentum/volume when the break happens.
The Entry:
Long: Enter if Gold breaks and holds above 4,492. Stop loss below 4,480.
Short: Enter if Gold breaks and holds below 4,475. Stop loss above 4,487.
Warning: Gold is highly volatile. Be wary of "Fakeouts," where the price briefly pokes above a line and then crashes back in. Waiting for a full 15-minute candle close is essential for confirmation.

Nifty Analysis for Dec 23, 2025Wrap-up:
Earlier I mention that Nifty forming a wxy pattern in wave 2. Wave w has been completed at 25318 and wave x at 26325 and wave y is in progress of which a is completed at 25891 and wave b is in progress.
In wave b, Nifty again forming a wxy pattern. Wave w has been completed at 26098 and wave x at 25693 and wave y is treated as completed once nifty breaks and sustains below 25994 and then wave b will be completed. Thereafter, Nifty will head towards c.
What I’m Watching for Dec 23, 2025 🔍
Short nifty below 26075 sl 26180 for a target of 26007-25962-25899.
Disclaimer: Sharing my personal market view — only for educational purpose not financial advice.

NMDC: Impulse Holds as Wave (4) Takes ShapeNMDC on the 1H timeframe is shaping up as a clean impulsive advance from the 72.2 lows. The structure from Wave (2) shows clear separation, strong momentum, and minimal overlap , all hallmarks of an impulse. The recent sharp push into 82.30 fits well as a completed Wave (3) , with internal subdivisions aligning cleanly.
Post the Wave (3) high, price has started to ease — without aggressive selling pressure . This keeps the door open for a healthy Wave (4) correction , ideally unfolding as a sideways or shallow pullback. The 0.382–0.5 Fibonacci retracement zone (≈78.83–77.76) remains the ideal cooling area. As long as price holds above the Wave (1) high near 73.22 , the impulsive structure stays valid.
RSI behavior supports this view — momentum peaked during Wave (3) and is now cooling, consistent with a corrective pause rather than a trend reversal. A controlled Wave (4) would set the stage for a final Wave (5) advance , potentially pushing into the mid-80s before a higher-degree pause.
Key Levels to Watch
Support zone: 78.83 – 77.76
Invalidation: Below 73.22
Upside continuation: Post Wave (4) resolution
Bottom line:
Patience over prediction. If Wave (4) remains corrective and contained, Wave (5) remains the higher-probability path .
Disclaimer: This analysis is for educational purposes only and does not constitute investment advice. Please do your own research (DYOR) before making any trading decisions.

Real Knowledge of Candle Patterns CANDLESTICK PATTERNS (Price Action Signals)
Candlesticks reflect short-term price behavior and trader psychology. Each candle shows:
Open
High
Low
Close
Patterns range from single candle to multi-candle structures.
Candlestick patterns show reversal, continuation, or indecision in the market.
Let’s explore major categories.

JSWENERGY 1 Day Time Frame📌 Live Price (Approx Latest)
Current price: ~ ₹478.2 – ₹478.3 per share (latest close/near real‑time) on the NSE.
Today’s range: Low ~ ₹468.3 | High ~ ₹479.9 (intraday range).
📊 Daily Key Levels (1‑Day Time Frame)
🔹 Pivot (Daily Reference)
Pivot Point: ~ ₹475.5 – central reference for daily trend.
📈 Resistance Levels
R1: ~ ₹482.7
R2: ~ ₹487.1
R3: ~ ₹494.3
(Higher resistances mark potential upside targets if the price moves up today.)
📉 Support Levels
S1: ~ ₹471.1
S2: ~ ₹463.9
S3: ~ ₹459.5
(Below these, risk of deeper pullbacks increases.)
📌 What These Levels Mean Today
✅ Bullish scenario:
A sustained trade above ₹482–₹487 could push toward ₹494+ resistance zones.
❌ Bearish scenario:
A break below ₹471 may open the path to ₹464–₹459 support.
📊 Pivot reference:
Trading above the pivot ~₹475–₹476 suggests positive short‑term bias; below it leans bearish.

ELECTHERM 1 Week Time Frame 📌 Current Price (approx as of Dec 23, 2025)
Around ₹927 intraday / ~₹850–₹930 range depending on data source and time.
📊 1‑Week Timeframe Levels (NSE – ELECTHERM)
🟢 Immediate Support Levels
These are the floors where price has tended to bounce within the past week:
1. ₹836–₹840 — strong short‑term support (recent close lows).
2. ₹824–₹830 — secondary support zone below recent trading range.
3. ₹800–₹807 — psychological support and mid‑term pivot cluster.
Break below ₹800 could signal deeper pullback toward longer‑term support near the 52‑week low area.
🔴 Key Resistance Levels
Levels where price may face selling pressure this week:
1. ₹864–₹870 — near short‑term resistance from recent daily highs.
2. ₹882–₹893 — next upper resistance zone (upper pivot levels).
3. ₹900–₹915+ — psychological resistance & intra‑week upper range zone. Based on price action trending above previous range highs.
If price sustains above ₹880–₹890, bullish sentiment is likely to strengthen.
📌 Weekly Pivot (Approx)
Based on technical pivots for short‑term moves:
Pivot ~ ₹853–₹855 — often acts as balance point this week.
Above this pivot → near‑term bullish;
Below this pivot → consolidation/bearish pressure.

How Global Markets Are Creating Unprecedented OpportunitiesMassive Commodity Profits
In recent years, commodities have emerged as one of the most powerful profit-generating asset classes in the global financial markets. From crude oil and natural gas to gold, silver, copper, agricultural products, and industrial metals, commodities have delivered massive profits to traders, investors, corporations, and even governments. These profits are not accidental; they are the result of deep structural changes in the global economy, shifting geopolitics, supply-demand imbalances, inflationary pressures, and evolving investment behavior. Understanding why commodities are producing such large gains—and how long these conditions may last—is essential for anyone involved in financial markets.
The Global Commodity Supercycle Narrative
One of the most talked-about reasons behind massive commodity profits is the idea of a commodity supercycle. A supercycle refers to a long-term period—often lasting a decade or more—during which commodity prices remain elevated due to sustained demand growth and constrained supply. Rapid industrialization in emerging economies, especially Asia, combined with infrastructure spending, urbanization, and energy transitions, has fueled long-term demand for raw materials. At the same time, years of underinvestment in mining, energy exploration, and agriculture have limited supply growth, pushing prices higher.
When demand grows faster than supply over a prolonged period, prices rise sharply, and profit margins expand. Companies involved in extraction, processing, and trading of commodities benefit enormously during such phases, leading to massive profits across the value chain.
Inflation and the Real Asset Advantage
High inflation has been another major driver of commodity profits. Commodities are real assets, and historically they perform well during inflationary environments. As the purchasing power of paper currencies declines, the value of tangible goods such as oil, metals, and food rises. This makes commodities a natural hedge against inflation for investors.
Central banks around the world have engaged in aggressive monetary expansion over the past decade. Low interest rates and excess liquidity pushed capital into real assets, boosting commodity prices. For producers, rising prices often translate directly into higher revenues and profits, especially when production costs rise more slowly than selling prices.
Energy Markets and Geopolitical Shocks
Energy commodities—particularly crude oil, natural gas, and coal—have been at the center of massive profit cycles. Geopolitical tensions, wars, sanctions, and supply disruptions have repeatedly tightened energy markets. When major producing regions face instability or export restrictions, global supply contracts abruptly, causing sharp price spikes.
Energy companies benefit significantly during such periods, as higher prices dramatically improve cash flows. Traders who can anticipate or respond quickly to these shocks often generate extraordinary profits due to increased volatility. The energy transition has added another layer of complexity, as underinvestment in traditional energy sources collides with still-strong global demand.
Industrial Metals and the Green Transition
Industrial metals like copper, aluminum, nickel, lithium, and zinc have become key beneficiaries of the global shift toward renewable energy, electric vehicles, and decarbonization. Electric grids, solar panels, wind turbines, batteries, and electric cars all require large quantities of these metals.
Demand for these materials is growing faster than new supply can be brought online. Mining projects take years to develop, and environmental regulations have made approvals more difficult. This structural mismatch has driven prices higher, generating massive profits for mining companies and investors positioned early in the trend.
Agricultural Commodities and Food Security
Agricultural commodities have also delivered significant profits due to climate change, weather disruptions, and global food security concerns. Droughts, floods, heatwaves, and unpredictable weather patterns have reduced crop yields in many regions. At the same time, population growth and changing dietary habits have increased demand for grains, oilseeds, and soft commodities.
Export restrictions by producing countries and higher input costs such as fertilizers and fuel have further tightened supply. These factors have pushed agricultural prices higher, benefiting farmers, agribusiness firms, and commodity traders who can manage risk effectively.
Financialization of Commodities
Another important factor behind massive commodity profits is the increasing participation of financial investors. Hedge funds, institutional investors, and even retail traders now actively trade commodities through futures, options, ETFs, and commodity-linked stocks. This financialization has increased liquidity but also amplified price movements.
When large pools of capital flow into commodity markets, price trends can accelerate rapidly. Momentum-driven trading often pushes prices well beyond fundamental levels in the short term, creating opportunities for outsized profits—but also increasing volatility and risk.
Role of Currency Movements
Commodities are generally priced in U.S. dollars, making currency movements a critical driver of profits. A weakening dollar tends to push commodity prices higher, as it makes them cheaper for non-dollar buyers. Conversely, a strong dollar can pressure prices. Traders who understand the relationship between currencies, interest rates, and commodities can capitalize on these dynamics to enhance returns.
For producers operating in countries with weaker local currencies, revenues earned in dollars translate into higher profits when converted back to domestic currency, further boosting margins.
Volatility: The Profit Engine
Volatility is the lifeblood of commodity markets. Unlike equities, commodities are directly exposed to physical supply disruptions, weather events, political decisions, and sudden demand shocks. This creates frequent price swings, which skilled traders exploit through short-term strategies such as swing trading, trend following, and arbitrage.
While volatility increases risk, it also creates exceptional profit opportunities for those with disciplined risk management, deep market knowledge, and the ability to act decisively.
Risks Behind Massive Profits
Despite the potential for massive profits, commodity markets are not without risks. Sharp reversals can occur when supply normalizes, demand weakens, or governments intervene through price controls and export bans. High leverage in futures markets can magnify losses as quickly as gains. Additionally, technological innovation or substitution can reduce long-term demand for certain commodities.
Successful participants understand that commodity profits are cyclical. Timing, diversification, and risk control are critical to surviving downturns and preserving capital.
Conclusion: A Powerful but Cyclical Opportunity
Massive commodity profits are the result of powerful global forces—economic growth, inflation, geopolitics, climate change, and the energy transition—all converging in a single asset class. Commodities offer unique opportunities unmatched by most other markets, especially during periods of structural change and uncertainty.
However, these profits do not come easily or permanently. Commodity markets reward those who combine fundamental understanding with technical insight, disciplined risk management, and a long-term perspective. For traders and investors who respect their complexity and volatility, commodities remain one of the most dynamic and potentially lucrative arenas in global finance.

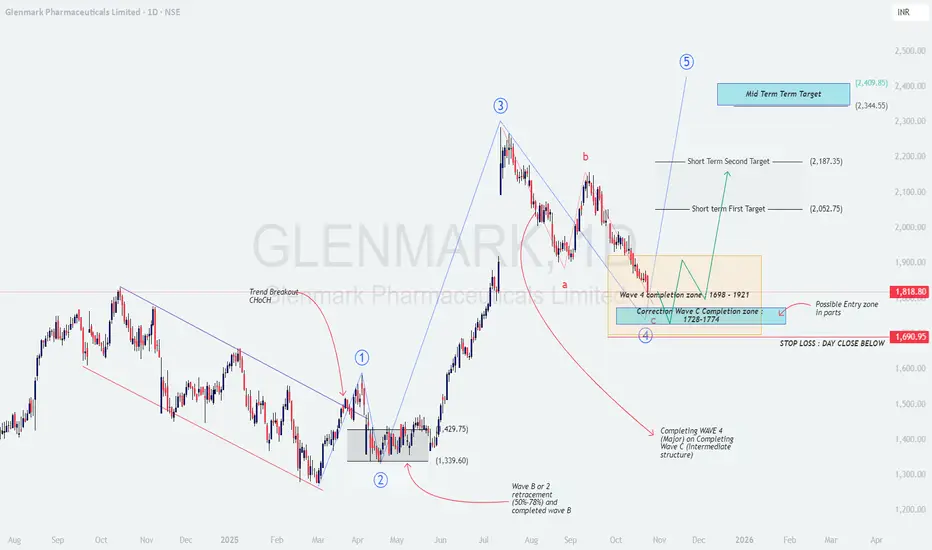
Wave‑C Done? Glenmark Primed for Trend ResumptionGlenmark Pharma (NSE: GLENMARK) – Professional Chart Analysis, Price Path & Trading Advice (educational)
Market structure and thesis
The chart shows a completed impulsive advance into Wave 3, followed by a corrective a‑b‑c decline progressing into the Wave‑4 completion zone 1,698–1,921 that overlaps with a deeper Wave‑C completion band 1,728–1,774 . This clustering of supports, plus a prior change‑of‑character (ChoCH) earlier in the cycle, suggests the correction is maturing and a new advancing leg is probable if price holds above the invalidation.
Candles in the box are showing decelerating downside and overlapping ranges, consistent with late‑stage corrective behavior; a higher low inside 1,74x–1,82x followed by a break of recent swing supply would confirm a trend inflection toward Wave‑5 projections.
Key levels to watch
Demand zones: 1,728–1,774 (C completion), 1,698–1,921 (Wave‑4 box).
Trigger levels: Reclaim and daily close above 1,880–1,900 improves odds; a stronger confirmation is a close above 1,940–1,960 (box top/supply shelf).
Invalidation: Day close below ~1,691 cancels the bullish swing setup and opens risk to lower retracements.
Price movement prediction
Base case (probability favored): Stabilization above 1,74x–1,82x → break and hold above 1,900 → push to Short‑Term T1 ≈ 2,053 , then Short‑Term T2 ≈ 2,187 as supply pockets get cleared. Sustained momentum and broader sector tailwinds can extend toward a mid‑term Wave‑5 objective 2,345–2,410 .
Alternate (bearish): Failure to hold 1,74x–1,80x with a daily close below 1,691 shifts bias to distribution; expect a slide to prior swing supports before a fresh base is attempted. In this path, avoid bottom‑fishing and wait for a new ChoCH and higher‑low structure.
Trade plan ideas
Accumulate in parts: Stagger entries 1,74x–1,82x with a core risk defined by a day‑close stop below 1,691.
Confirmation add: Add on daily close above 1,900–1,920 and again above 1,940–1,960 if volume expands.
Profit taking: Scale 30–40% near 2,05x, another tranche around 2,18x; trail the remainder with a daily/weekly higher‑low stop for a potential run toward 2,35x–2,41x.
Logic and validation checklist
Confluence: Wave‑4 price box overlaps Wave‑C termination band → strong probability of correction end if defended.
Structure: Need a higher low plus break/retest of 1,90x–1,96x to confirm demand dominance.
Momentum: Look for improving RSI/MACD and rising green‑day volume on pushes through supply.
Disclaimer: This post is for education only and not investment advice or a solicitation to buy/sell securities; I am not a SEBI registered analyst .
TRENT : Right Time to Catch Wave?
### 🧠 Chart Context & Wave Overview
The chart of TRENT LTD (Daily Timeframe) displays a strong Elliott Wave corrective setup , where price action seems to have completed an extended retracement (113%–127%) of the previous swing low .
This zone often marks the final leg of a correction and can lead to the start of a fresh impulsive rally — possibly Primary Wave 5 .
📊 Key Observations:
* Price is consolidating inside the Extended Retracement Zone (₹4,249–₹4,357) .
* Intermediate Wave (a-b-c) structure looks complete.
* Breakout above the long-term trendline (Wave 2–4) will confirm bullish reversal.
---
### 📚 Educational Insights
💡 Extended Retracement Zone (113%–127%):
When corrections go beyond the usual 61.8%–78.6% retracement, it often represents an “overshoot flush” — a zone where weak hands exit and institutional buyers enter.
📘 Elliott Wave Psychology Recap:
Wave 4 corrections tend to be complex and deep , but they provide the last strong entry opportunity before the final impulsive move (Wave 5).
🔁 Character Change in Price Action (ChoCH):
A ChoCH above recent highs indicates the first structural shift — confirming that sellers are losing control and accumulation may be underway.
---
### 🎯 Projection & Price Prediction
* 🟢 Primary Support / Entry Zone: ₹4,249 – ₹4,357
* ⚙️ Extended Retracement Base: ₹4,012 – ₹4,261
* 🔴 Stop-Loss (Closing Basis): Below ₹3,929
* 🎯 First Upside Target: ₹5,850 – ₹6,059
* 🚀 Second Target: ₹7,471
Once the structure confirms reversal above ₹4,600–₹4,750, the probability for a Wave 5 impulse toward ₹7,400+ increases substantially.
---
### 💡 Trading Strategy (Educational Purpose Only)
📈 Entry Plan:
Watch for bullish reversal signals (Hammer / Bullish Engulfing / Double Bottom) in ₹4,250–₹4,350 zone.
Aggressive traders can accumulate early with SL below ₹3,929.
Conservative traders can wait for confirmation above ₹4,700.
🎯 Targets:
• Target 1 → ₹5,850 – ₹6,059
• Target 2 → ₹7,471 (Extended Wave projection)
⚖️ Risk Management:
• Risk only 1–2% per trade 💰
• Avoid aggressive averaging during corrections
• Wait for structure + volume confirmation before scaling
---
### 🧩 Educational Takeaways
✅ Extended retracement zones often represent strong demand and accumulation phases.
✅ A ChoCH or structure breakout gives early reversal confirmation.
✅ Wave 5 rallies are often sharp and impulsive — rewarding patient traders.
✅ Combining Elliott Wave + Fibonacci + Price Action improves accuracy and timing.
---
### 📊 Summary & Outlook
TRENT LTD is holding firm within its extended retracement base (₹4,250–₹4,350) , signaling exhaustion of sellers.
A breakout above the trendline resistance could trigger a strong Wave 5 impulse toward ₹5,850 initially and ₹7,400+ eventually.
Patience and confirmation remain key to capturing this move effectively. ⚡
---
### ⚠️ Disclaimer
I am not a SEBI-registered analyst .
This analysis is purely for educational and informational purposes and should not be considered financial advice.
Please consult your financial advisor before taking any trading positions.

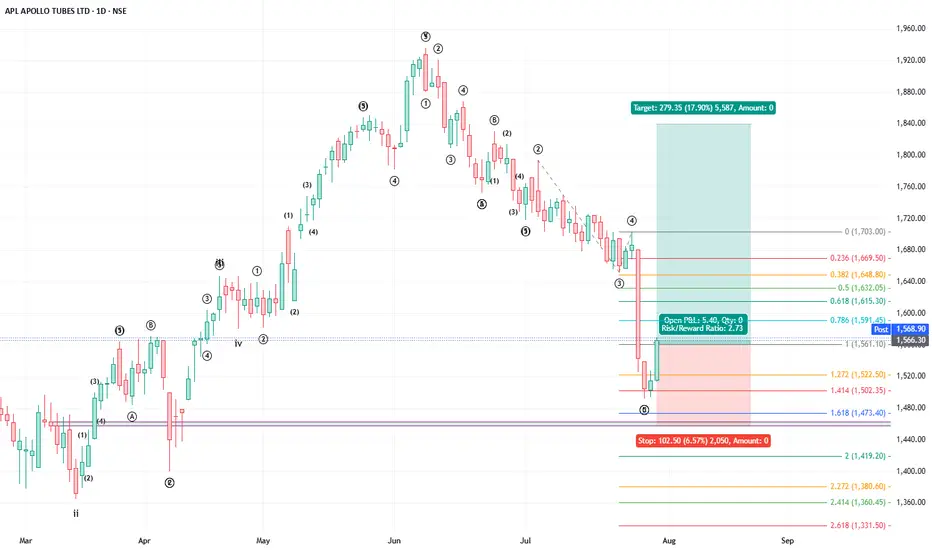
Buy Apollo TubesAPL Apollo Tubes has completed one full motive wave and related corrective wave in the form of a zigzag. All the wave markings are given in the chart.
One may consider going long on the stock with an initial target of 0.786 fibo retracement of the corrective wave. Stop loss is considered below 1.618 fibo retracement of Wave 2-3 to 4 of wave C of the corrective structure providing a risk-reward ratio of over 2.5x.
Will update the further targets as the stock waves unfold.
Happy Trading !!
Reliance(1H) Tests the Zigzag RulebookFrom the 1581.30 high , RIL kicked off a clear corrective phase. The first leg down unfolded in a clean 5-wave impulse , with a sharp Wave 3. That decline bottomed near 1517.60 , marking Wave A.
What followed is where things get interesting. The rebound since then has been overlapping, choppy — classic corrective behavior. This fits well as an internal (A)–(B)–(C) structure, with the current advance shaping up as a possible ending diagonal in Wave (C) , internally subdividing into three waves.
For a zigzag to remain valid , Wave B must stay below the start of Wave A , which sits at 1581.30 . That level also acts as the hard invalidation / stop . With price currently hovering around 1576.60 , this setup is literally hanging by a thread.
Two scenarios from here:
If price rolls over and opens below 1581.30 , the risk-reward improves nicely, opening the door for a Wave C decline toward the support cluster near the Wave A low .
If price pushes above 1581.30 , this entire zigzag thesis gets invalidated immediately . No debate,count gets invalidated.
Bottom line:
This is a conditional setup , not a blind short. Entry only makes sense if tomorrow’s price action stays below the invalidation level .
Disclaimer: This analysis is for educational purposes only and does not constitute investment advice. Please do your own research (DYOR) before making any trading decisions.

BANKNIFTY : Trading levels and Plan for 23-Dec-2025BANK NIFTY Trading Plan for 23-Dec-2025
(Chart reference: 15-min | Gap criteria considered: 200+ points)
Key Levels from Chart
Opening Resistance / Pivot: 59,349
Last Intraday Resistance: 59,632
Major Upside Resistance: 59,746
Opening Support Zone: 59,136 – 59,192
Last Intraday Support: 59,054
Lower Support: 58,857
🟢 1. GAP-UP OPENING (200+ Points)
If BANK NIFTY opens above 59,349, price will immediately face a critical supply and decision zone.
🎓 Educational Explanation:
A 200+ point gap-up usually reflects strong overnight cues, but opening near resistance often invites profit booking by smart money. Sustainable rallies happen only when price accepts above resistance, not just spikes above it.
Plan of Action:
If price sustains above 59,349 for 10–15 minutes, look for pullback-based long entries.
Upside momentum can extend toward 59,632, the last intraday resistance.
Acceptance above 59,632 opens the path toward 59,746 (major supply).
Strong rejection or exhaustion near 59,632–59,746 can trigger a pullback toward 59,349.
Option buyers should avoid chasing CE at the open; confirmation and retest are mandatory.
🟡 2. FLAT OPENING
A flat open near 59,250–59,320 keeps BANK NIFTY inside a consolidation zone.
🎓 Educational Explanation:
Flat openings indicate balanced order flow. In such conditions, institutions wait for liquidity before committing. Direction emerges only after a clear break of the opening range.
Plan of Action:
Sustaining above 59,349 shifts momentum in favour of buyers, targeting 59,632.
Failure to cross 59,349 keeps price vulnerable to pullback moves.
Breakdown below 59,136 signals weakness toward 59,054.
Bullish rejection from 59,136–59,192 can offer low-risk bounce trades.
🔴 3. GAP-DOWN OPENING (200+ Points)
If BANK NIFTY opens below 59,136, early sentiment turns clearly weak.
🎓 Educational Explanation:
Large gap-downs are often emotional. However, strong historical supports attract buyers and short-covering. Selling blindly into support zones increases risk of sharp reversals.
Plan of Action:
First support to observe is 59,054 — watch price behaviour closely.
Breakdown below 59,054 opens the path toward 58,857.
Strong reversal signals near 58,857 may lead to a fast intraday bounce.
Any pullback toward 59,136 after breakdown becomes a selling-on-rise opportunity.
⚙️ Risk Management Tips for Options Traders 🛡️
Avoid trading the first 5–10 minutes during 200+ point gap days.
Never buy options at resistance or sell at support without confirmation.
Use time-based stop loss (15–20 minutes) if premium doesn’t move.
Risk only 1–2% of total capital per trade.
Prefer ATM options or defined-risk spreads to manage theta decay.
Book partial profits near marked resistance/support zones.
🧾 Summary & Conclusion
Above 59,349: Bulls stay active; targets 59,632 → 59,746.
Between 59,136–59,349: Market remains range-bound; patience required.
Below 59,136: Sellers gain control unless buyers defend 59,054 / 58,857.
Focus on price behaviour at levels, not prediction or emotion.
Consistency comes from discipline, not overtrading.
⚠️ Disclaimer
I am not a SEBI-registered analyst. This trading plan is for educational purposes only and should not be considered financial or investment advice. Please consult your financial advisor before taking any trades.

NIFTY : Trading level and Plan for 23-Dec-2025📘 NIFTY Trading Plan for 23-Dec-2025
(Chart reference: 15-min | Gap criteria considered: 100+ points)
Key Levels to Track (from chart)
Opening Resistance: 26,266
Last Intraday Resistance: 26,331
Opening Support Zone: 26,100 – 26,147
Last Intraday Support: 26,010
Lower Support: 25,900
🟢 1. GAP-UP OPENING (100+ Points)
If NIFTY opens above 26,266, price will directly face a strong overhead supply zone.
🎓 Educational Explanation:
Gap-up openings reflect bullish overnight sentiment, but when price opens near resistance, profit booking and supply absorption usually occur. Smart traders avoid chasing and wait for acceptance or retest confirmation before committing.
Plan of Action:
Sustaining above 26,266 for 10–15 minutes allows pullback-based long entries.
Upside potential remains toward 26,331, the last intraday resistance.
Acceptance above 26,331 may extend the rally further; trail stops tightly.
Rejection near 26,266–26,331 can trigger a pullback toward 26,147.
Option buyers should avoid aggressive CE buying at the open; confirmation is key.
🟡 2. FLAT OPENING
A flat open near 26,150–26,200 keeps NIFTY inside the Opening Support Zone.
🎓 Educational Explanation:
Flat opens represent balance between demand and supply. Direction emerges only after a clear breakout or breakdown. Trading inside the range without confirmation often leads to whipsaws.
Plan of Action:
Sustaining above 26,266 turns momentum bullish, targeting 26,331.
Failure to cross 26,266 keeps price vulnerable to consolidation or pullback.
Breakdown below 26,100 shifts control to sellers toward 26,010.
Bullish rejection patterns near 26,100–26,147 provide low-risk bounce trades.
🔴 3. GAP-DOWN OPENING (100+ Points)
If NIFTY opens below 26,100, early sentiment turns cautious.
🎓 Educational Explanation:
Gap-down openings are often driven by fear. However, strong demand zones usually attract short-covering and value buying, leading to intraday reversals. Selling blindly at support increases risk.
Plan of Action:
First support to watch is 26,010 — observe price behaviour carefully.
Breakdown below 26,010 opens the path toward 25,900.
Bullish reversal signals near 25,900 may trigger a sharp bounce.
Any pullback toward 26,100 after breakdown becomes a selling-on-rise opportunity.
⚙️ Risk Management Tips for Options Traders 🛡️
Avoid trading the first 5–10 minutes on gap days.
Never buy options at resistance or sell at support without confirmation.
Use time-based stop-loss (15–20 minutes) if premium stalls.
Risk only 1–2% of capital per trade.
Prefer ATM options or spreads to manage theta decay.
Book partial profits near key resistance/support levels.
🧾 Summary & Conclusion
Above 26,266: Bulls remain active, targeting 26,331.
Between 26,100–26,266: Market stays range-bound; patience required.
Below 26,100: Sellers gain control unless buyers defend 26,010 / 25,900.
Trade price behaviour at levels, not emotions or predictions.
Consistency comes from discipline and risk control.
⚠️ Disclaimer
I am not a SEBI-registered analyst. This trading plan is for educational purposes only and should not be considered financial or investment advice. Please consult your financial advisor before taking any trades.

ASIANPAINT BULLISHASIANPAINT BULLISH
Bullish setup , Upmove to 2900 to 3200
first target 2900
Elliott Wave in Action

Maruti: Rising Flag, Dropping ProbabilityStructure
The decline into Wave W is complete as a Regular Flat.
The rebound is a corrective Wave X, fully overlapping and contained within a rising channel.
Bias remains bearish as long as price trades inside this channel.
Wave Y Setup
Trigger: Breakdown below the channel near 16000.
Entry: Preferable after a break and retest of the lower channel line.
Target: Toward 15,260 to complete Wave Y.
Invalidation: A decisive close above 16,549 invalidates the bearish view.
Summary
The current rise is a corrective phase, not a trend reversal. The higher-probability outcome is a continuation lower into Wave Y unless the channel breaks to the upside.
Disclaimer: This analysis is for educational purposes only and does not constitute investment advice. Please do your own research (DYOR) before making any trading decisions.
This Multi time frame Trick will save you from FAKEOUTSIn this video I am showcasing a daily, weekly and monthly time frame combination - also sharing a trick which can save you a lot of money from those regular sized fakeouts .
Charts used are 3 months old in this video and video is purely educational based .
