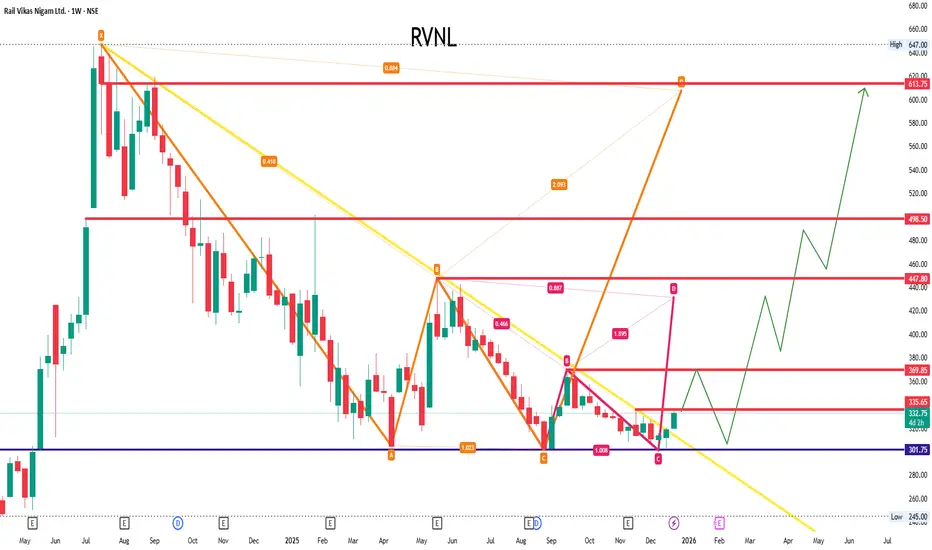
RVNLRVNL
bullish trend is Showing on the chart.
buy signals in
technical indicators and
descending triangle pattern.
BUYING RANGE 325/330
Watch for a breakout above 325/330 to sustain the bullish trend. If the resistance holds, there could be a retest towards 290/300 and an uptrend from here.
Wave Analysis
XAGUSD ANALYSISAs per my analysis we can see correction in both silver and gold and we can see a new last high in upcoming months as per this market can form now abc pattern as a corrective pattern it will takes time. as per my view high is formed of 3rd wave and now silver is in correction.
you can post your comment for more analysis
Thanks
Ishu Prajapati

XAUUSD ANALYSISI am posting a chart of XAUUSD this is the possible outcomes of the wave as per myview
3rd wave is completed and the current xauusd is in correction we can see abc correction on longterm as per trukit last wave now we can see trendline liquidity is need to be taken and in upcoming days we can see gold around 3820 from we can see 4-5wave as per my view.
Thanks

Nifty Analysis for Dec 20, 2025Wrap-up:
In wave y, a is completed at 25904 and b is in progress which is treated as completed once nifty breaks and sustains below 25908. Thereafter, Nifty will head towards c.
What I’m Watching for Dec 20, 2025 🔍
Short nifty below 25908 sl 25993 for a target of 25652-25557.

HCC 1 Week Time Frame 📌 Current Price Context
The stock has recently been trading around ₹18.5–₹20.1 (~Dec 19 close ~₹18.54) on NSE/BSE.
It has also shown strong short‑term momentum due to contract news and market interest.
📊 Weekly Levels (1‑Week Time Frame)
🟢 Resistance Levels – Where price may face selling pressure
These are potential upside barriers within the week:
R1: ~₹18.8–₹19.0 — First resistance band seen across pivot and short‑term technical data.
R2: ~₹19.0–₹19.4 — Stronger resistance from pivot clusters and 1‑week range highs.
R3: ~₹19.4+ — Next higher resistance level (weekly context).
👉 Bullish weekly break above ₹19.0–₹19.4 could open scope for further follow‑through.
🔵 Support Levels – Where price may find buying support
Areas where pullbacks may slow or reverse:
S1: ~₹18.15–₹18.20 — Immediate first support zone.
S2: ~₹17.75–₹17.80 — Next short‑term support (close to recent lows).
S3: ~₹17.50–₹17.55 — Key weekly base support range — a break below this could shift weekly structure.
📉 Weekly Pivot Reference
Weekly Pivot area: ~₹17.7–₹17.8 — often used as the short‑term balance zone.

ARSSBL is bouncing off Fibonacci levelARSSBL is bouncing off Fibonacci level. Can be a good swing opportunity if market supports

MUTHOOTFIN 1 Week Time Frame 📊 Current Price Context
Recent price is around ₹3,780–₹3,790 (mid‑Dec 2025) on NSE.
📈 Weekly Technical Levels (1‑Week TF)
📍 Major Resistance Levels
These are levels where the price may face selling pressure:
~₹3,805–3,810 — immediate resistance area.
~₹3,830–3,835 — next resistance / short‑term upside barrier.
~₹3,880–3,900 — stronger resistance zone (near recent highs).
📉 Support Levels
These are levels where the stock could find buying interest on a pullback:
~₹3,740–3,750 — short‑term support.
~₹3,690–3,700 — secondary support zone.
~₹3,650–3,670 — deeper zone of buyers.
📌 Pivot (Weekly)
Pivot ~₹3,770–₹3,775 — a key mid‑point level that often acts as support/resistance on weekly charts.
📅 What This Means for the Coming Week
Bullish scenario:
If price sustains above ₹3,805, look for a move toward ₹3,830–₹3,880.
Bearish scenario:
Break below ₹3,740 could expose supports around ₹3,690 and then ₹3,650+.
Neutral range:
Expect sideways oscillation between ₹3,740–₹3,830 if volume remains soft.

TCS 1 Day time Frame 🔹 Current Live Price (Approx)
₹3,280 ~ ₹3,290 range (today’s live market price) — indicative based on multiple live quotes
📊 Daily Pivot & Key Levels (1‑Day Timeframe)
Pivot (Daily Central Reference)
Pivot Point (Classic): ~ ₹3,209.7 (daily pivot)
📈 Resistance Levels (Upside Targets)
R1 ~ ₹3,233.8 — First resistance (daily)
R2 ~ ₹3,247.0 — Second resistance (daily)
R3 ~ ₹3,271.1 — Third resistance (daily)
(Some brokers also cite nearby resistances ~₹3,307/3,332/3,346)
📉 Support Levels (Downside Protection)
S1 ~ ₹3,196.5 — First support (daily)
S2 ~ ₹3,172.4 — Second support (daily)
S3 ~ ₹3,159.2 — Third support (daily)
(Brokers also show support area ~₹3,267/3,253/3,228 levels)
🕒 Intraday Range (Recent)
Day’s high ~ ₹3,317
Day’s low ~ ₹3,278
(Indicative intraday swing today)

XAUUSD Bulls Dominate – Breakout Holds Strong Above Supply📈 Gold has confirmed a strong bullish breakout after clearing the 4355–4375 supply zone, turning it into solid demand. Price is holding well above EMA & VWAP bands, signaling sustained buying momentum and trend continuation.
🔹 Trend: Bullish (HH–HL structure intact)
🔹 Momentum: Healthy consolidation after impulse move
🔹 RSI (14): Near 52–55, cooling but supportive
🔹 Volume: Breakout backed by strong participation
📌 Key Levels
🟢 Support: 4400 – 4390, then 4375 – 4360
🔴 Resistance/Targets: 4425 → 4450 → 4475
🎯 Bias: Buy on dips above 4390
❌ Invalidation: Below 4360
📊 Conclusion: As long as price holds above the breakout zone, bulls remain in control and higher targets stay in focus.

Momentum Trading SecretsHow Traders Capture Powerful Market Moves
Momentum trading is one of the most popular and effective trading styles in financial markets. It is based on a simple but powerful idea: stocks, indices, or other assets that are moving strongly in one direction tend to continue moving in that direction for some time. Momentum traders do not try to predict bottoms or tops; instead, they ride the strength of an existing trend and exit when momentum weakens. Below is a detailed explanation of momentum trading secrets, strategies, and mindset, explained in depth.
1. Understanding the Core Concept of Momentum Trading
Momentum trading focuses on price strength, not valuation. Unlike value investors who look for underpriced stocks, momentum traders look for assets that are already performing well. The logic behind this approach is rooted in market psychology. When prices rise, more traders notice the move, news coverage increases, and buying pressure intensifies, creating a self-reinforcing cycle.
Momentum can exist in:
Stocks
Indices (like Nifty or Bank Nifty)
Commodities
Currencies
Cryptocurrencies
The key secret is recognizing that price action reflects collective market belief, and momentum traders align themselves with that belief rather than fighting it.
2. Identifying High-Momentum Stocks and Assets
One of the biggest secrets of successful momentum trading is stock selection. Not all assets move with strong momentum. Traders often scan the market for:
Stocks making new 52-week highs
Assets breaking above key resistance levels
Strong volume expansion alongside price movement
Sectors showing relative strength compared to the broader market
Momentum traders often focus on sector leadership. For example, if banking or IT stocks are outperforming the market, chances are that the strongest momentum trades will be found within those sectors.
3. Role of Volume: The Fuel Behind Momentum
Price alone is not enough. Volume is the fuel that confirms momentum. A price breakout with low volume may fail, while a breakout with high volume often signals strong institutional participation.
Key volume-based insights include:
Rising prices + rising volume = healthy momentum
Rising prices + falling volume = weakening momentum
Sudden volume spikes often indicate the start of a new momentum phase
Experienced momentum traders always check volume before entering a trade. This is one of the most overlooked but powerful secrets.
4. Technical Indicators That Reveal Momentum
Momentum trading heavily relies on technical analysis. Some of the most commonly used indicators include:
Relative Strength Index (RSI): Helps identify strong momentum when RSI stays above 60–70 during an uptrend.
Moving Averages: Price staying above short-term and medium-term moving averages indicates strength.
MACD: Confirms momentum shifts and trend continuation.
Rate of Change (ROC): Measures how fast price is moving.
The real secret is not using too many indicators but understanding how price behaves around them. Indicators should support price action, not replace it.
5. Entry Timing: Buying Strength, Not Weakness
A common mistake beginners make is trying to buy at the lowest price. Momentum traders do the opposite: they buy strength. Typical momentum entries occur:
On breakouts above resistance
After short consolidations in an uptrend
On pullbacks to moving averages within a strong trend
Patience is critical. Momentum traders wait for confirmation rather than guessing. Entering too early often leads to false breakouts and losses.
6. Risk Management: Protecting Capital Is the Real Secret
Momentum trading can generate large profits, but it also comes with sharp reversals. This is why risk management is the biggest secret behind long-term success.
Key principles include:
Always using stop-loss orders
Risking only a small percentage of capital per trade
Exiting quickly when momentum fails
Never averaging down on losing momentum trades
Successful traders understand that small losses are part of the game, but big losses are unacceptable.
7. Riding Winners and Letting Profits Run
Momentum traders differ from short-term scalpers because they allow winners to grow. Once momentum is established, the goal is to stay in the trade as long as the trend remains intact.
This often involves:
Trailing stop-losses
Partial profit booking
Holding positions until momentum indicators weaken
One of the biggest secrets is emotional discipline. Many traders exit winning trades too early due to fear, while momentum traders trust their system and let the market reward them.
8. Market Psychology and Crowd Behavior
Momentum trading works because markets are driven by human emotions like fear and greed. When prices rise, fear of missing out (FOMO) pushes more participants to buy. When prices fall, panic accelerates selling.
Understanding crowd psychology helps traders:
Avoid chasing extended moves blindly
Recognize exhaustion points
Stay calm during pullbacks
Momentum traders do not react emotionally; they react systematically.
9. Adapting Momentum Strategies to Market Conditions
Momentum does not work equally well in all market phases. Strong trending markets favor momentum strategies, while sideways or choppy markets reduce their effectiveness.
Smart momentum traders:
Reduce position size during volatile periods
Avoid overtrading in range-bound markets
Focus on fewer, high-quality setups
Adaptability is a hidden secret that separates consistent traders from inconsistent ones.
10. Discipline and Consistency: The Ultimate Momentum Secret
The final and most important secret is discipline. Momentum trading success does not come from one big trade but from repeating the same process over and over.
This includes:
Following predefined rules
Maintaining a trading journal
Reviewing mistakes regularly
Staying patient and focused
Momentum trading rewards those who are consistent, emotionally stable, and process-driven.
Conclusion
Momentum trading is not about predicting the future; it is about aligning with the present strength of the market. By focusing on strong price moves, confirming them with volume, managing risk carefully, and maintaining emotional discipline, traders can unlock the true potential of momentum strategies. The real secrets are not hidden indicators or complex systems, but clarity, patience, and discipline. When applied correctly, momentum trading can become a powerful tool for consistent growth in any market environment.

NIFTY 50 – Breakout Holds | Structure Supports Further UpsideNIFTY has broken above the previous swing high and is holding above the breakout zone.
Price is advancing within a rising channel, and recent gaps appear to be trend-continuation gaps rather than exhaustion signals.
Momentum remains constructive, with RSI holding in a neutral-positive range and no divergence visible at this stage.
The broader structure continues to favor upside as long as price remains above the highlighted support band and trendline.
An alternate corrective scenario (Alt 2) has been marked for risk awareness, but it remains a low-probability path unless key supports are violated.
No prediction — structure and levels will guide the next move.
Structure intact. Levels decide.
Previous Analysis:

USDINR VIEWUsdInr Cmp 89.67
Wave 4 88.30 , 87.60 took support
wave 5 92.50 , 94.00
wave 5 97.70 , 99.30 , 101.00
86.70 below Sustain or close below invalidation
View is for study purpose only , we are not recommend any trade or investment
Always do your own analysis

Gold 1H – CPI Ambiguity Sets Liquidity Traps Near 4400🟡 XAUUSD – Intraday Smart Money Plan | by Ryan_TitanTrader (22/12)
📈 Market Context
Gold is trading near the upper boundary of a well-defined bullish channel as markets react to renewed uncertainty surrounding U.S. inflation data and the Fed’s policy outlook.
Recent CPI-related commentary has reignited debate over whether inflation is cooling fast enough to justify near-term easing, keeping USD flows unstable and risk sentiment mixed.
This macro backdrop favors liquidity engineering over clean continuation, with Smart Money likely targeting both premium and discount extremes to induce breakout traders before the next directional expansion.
🔎 Technical Framework – Smart Money Structure (1H)
Current Phase: Bullish structure approaching premium exhaustion
Key Idea: Expect liquidity interaction at 4400–4402 (premium) or 4340–4338 (discount) before meaningful displacement
Structural Notes:
• Higher-timeframe bullish BOS remains valid
• Price is pressing into buy-side liquidity near channel highs
• Clear impulsive leg up created an unmitigated FVG above 4370
• Rising structure shows signs of short-term distribution, not confirmed reversal
• Liquidity rests clearly above 4400 and below 4340
Liquidity Zones & Triggers:
• 🔴 SELL GOLD 4400 – 4402 | SL 4410
• 🟢 BUY GOLD 4340 – 4338 | SL 4330
🧠 Institutional Flow Expectation:
Liquidity sweep → MSS / CHoCH → BOS → displacement → FVG / OB retest → expansion
🎯 Execution Rules (matching your exact zones)
🔴 SELL GOLD 4400 – 4402 | SL 4410
Rules:
✔ Sweep above psychological 4400 buy-side liquidity
✔ Bearish MSS / CHoCH on M5–M15
✔ Clear downside BOS with impulsive displacement
✔ Entry via bearish FVG refill or refined supply OB
Targets:
1. 4370
2. 4350
3. 4340 – extension if USD strengthens on CPI reassessment
🟢 BUY GOLD 4340 – 4338 | SL 4330
Rules:
✔ Liquidity grab into discount and channel support
✔ Bullish MSS / CHoCH confirms demand control
✔ Upside BOS with strong bullish displacement
✔ Entry via bullish FVG fill or demand OB retest
Targets:
1. 4360
2. 4385
3. 4400 – extension if USD weakens amid CPI doubt
⚠️ Risk Notes
• CPI-driven uncertainty increases fake breakouts
• No entry without MSS + BOS confirmation
• Expect volatility during U.S. session
• Reduce risk around unexpected Fed or inflation headlines
📍 Summary
Gold is trading at a decisive premium within a bullish structure, but CPI ambiguity keeps conviction fragile. Smart Money is likely to engineer liquidity at the extremes before committing:
• A sweep above 4400 may fade toward 4350–4340, or
• A liquidity grab near 4340 could reload bullish flow toward 4385–4400+
Let structure confirm — Smart Money reacts, retail anticipates. ⚡️
📌 Follow @Ryan_TitanTrader for daily Smart Money gold breakdowns.

Elliott Wave Analysis – XAUUSD Week 4 of December
1. Momentum Overview
Weekly (W1)
Weekly momentum is currently preparing to reverse to the downside. If a confirmation candle appears next week, a weekly bearish trend is likely to be established. This would indicate the beginning of a multi-week corrective phase.
Daily (D1)
Daily momentum has already confirmed a bearish reversal. Therefore, the downside bias is expected to dominate in the coming week.
H4
H4 momentum is approaching bearish confirmation. This suggests that selling pressure may begin to emerge as early as the Asian session at the start of the week.
2. Elliott Wave Structure
Weekly (W1)
The price structure on W1 clearly shows that the market is positioned at the top of Wave 3 (yellow). Combined with the weekly momentum preparing to reverse, the market is likely to continue into Wave 4 (yellow), developing as a flat corrective structure.
After Wave X is completed, price is expected to decline in line with weekly momentum to complete Wave Y. The completion of Wave Y may take several weeks, until weekly momentum reaches the oversold zone.
Daily (D1)
Within the purple Wave X structure, price is forming a red ABC corrective pattern.
Inside red Wave C, we observe a five-wave impulse structure (1–2–3–4–5) in blue.
At present, price is trading in blue Wave 5. With daily momentum already reversing to the downside, I expect blue Wave 5 to be complete, which implies:
- Red Wave C has finished
- Purple Wave X has also completed
Following this, the market should enter a declining phase to form Wave Y.
Regarding time symmetry:
- Wave W previously took approximately 3 weeks to complete
- Therefore, Wave Y is expected to last at least a similar duration
In the coming week, I want to see strong selling pressure, with sharp downside movement, forming a clear five-wave bearish structure.
H4 Structure
Looking at the blue Wave 5, we can identify an internal five-wave red structure (1–2–3–4–5).
The breakout above 4365 suggests that the price objective of red Wave 5 has already been achieved.
Currently:
- Daily momentum has reversed bearish
- H4 momentum is also turning bearish
- Price failed to break and hold above 4365
- The latest candle closed below 4348
Based on these combined signals, I expect the top of Wave 5 to be in place.
3. Volume Profile & Price Scenarios
From the Volume Profile perspective:
- 4348 is a high-liquidity zone acting as a strong resistance
- Price has not yet been able to break decisively above this area
Primary bearish scenario:
If price closes below 4317 (a low-liquidity void) at the start of the next session, the market is likely to move quickly through this area and decline toward the next high-liquidity zone near 4215.
This scenario would provide strong confirmation that Wave 5 has completed.
Alternative scenario:
If price breaks above and holds above 4348, Wave 5 may extend further, potentially forming a terminal triangle. In that case, I will continue to monitor higher target zones and provide updates once additional data becomes available.
4. Trading Plan
At current levels, this is a potentially strong sell zone.
However, to define a precise entry plan, I need additional confirmation from price action at the market open tomorrow. Once clearer signals appear, I will update the trading plan accordingly.

NIFTY : Trading levels and Plan for 22-Dec-2025NIFTY Trading Plan for 22-Dec-2025
(Chart reference: 15-min | Gap criteria considered: 100+ points)
Key Levels from Chart
Opening Pivot (Support / Resistance): 25,985
Opening Support Zone: 25,858 – 25,891
Last Intraday Support: 25,808
Buyer’s Support Zone: 25,640 – 25,672
Last Intraday Resistance: 26,100 – 26,137
🟢 1. GAP-UP OPENING (100+ Points)
If NIFTY opens above 25,985, price enters a positive momentum structure but near overhead supply.
🎓 Educational Explanation:
A gap-up above a key pivot reflects bullish overnight sentiment. However, markets often pause near prior resistance zones as early longs book profits. A sustained move above resistance is healthier than a straight vertical rally.
Plan of Action:
If price sustains above 25,985 for 10–15 minutes, look for pullback-based long entries.
Upside momentum can extend toward 26,100 – 26,137, a strong supply zone.
Acceptance above 26,137 may trigger trend continuation; manage trades with trailing SL.
Rejection from 26,100 – 26,137 can lead to a pullback toward 25,985.
Option buyers should avoid chasing CE at the open; enter only after retest confirmation.
🟡 2. FLAT OPENING
A flat open near 25,940 – 25,980 keeps NIFTY inside the balance zone.
🎓 Educational Explanation:
Flat opens indicate equilibrium between buyers and sellers. Direction emerges only after a breakout or breakdown of the opening range. Trading without confirmation in such conditions often leads to whipsaws.
Plan of Action:
Sustaining above 25,985 turns sentiment bullish, targeting 26,100 – 26,137.
Failure to hold 25,985 keeps price vulnerable to a decline toward 25,891 – 25,858.
Strong bullish rejection near 25,858 – 25,891 offers low-risk bounce trades.
Breakdown below 25,858 shifts control to sellers for a move toward 25,808.
🔴 3. GAP-DOWN OPENING (100+ Points)
If NIFTY opens below 25,858, early sentiment turns weak.
🎓 Educational Explanation:
Gap-down openings often trigger emotional selling. However, strong demand zones frequently attract buyers and short-covering. Selling blindly into support increases risk.
Plan of Action:
First support to watch is 25,808 — observe price behaviour closely.
A breakdown below 25,808 exposes the Buyer’s Support Zone: 25,640 – 25,672.
Bullish reversal patterns in 25,640 – 25,672 can lead to a recovery toward 25,858.
Any pullback toward 25,858 after breakdown becomes a selling-on-rise opportunity.
⚙️ Risk Management Tips for Options Traders 🛡️
Avoid trading the first 5–10 minutes during gap days.
Do not buy options near resistance or sell near support without confirmation.
Use time-based stop loss (15–20 minutes) if the premium doesn’t move.
Risk only 1–2% of capital per trade.
Prefer ATM options or spreads to reduce theta decay.
Book partial profits near marked resistance/support zones.
🧾 Summary & Conclusion
Above 25,985: Bulls stay active; targets 26,100 – 26,137.
Between 25,858 – 25,985: Market remains range-bound; patience is key.
Below 25,858: Sellers gain control unless buyers defend 25,808 / 25,640–25,672.
Focus on price behaviour at levels, not prediction.
Consistency comes from discipline, not over-trading.
⚠️ Disclaimer
I am not a SEBI-registered analyst. This trading plan is for educational purposes only and should not be considered financial or investment advice. Please consult your financial advisor before taking any trades.

TITAN UPMOVE COMING TITAN upmove coming
After long consolidation, showing upmove
Look for Increase in volume , prices will increase with increasing volumes

19 Dec 2025 - Nifty still long, but hurting our PnLs + PostMorteNifty Stance Bullish 🐂
Nifty has been in a consolidation mode since the last week of October, and that's really hunting trend-following traders. One of these days, Nifty will have to breakout and the only question remains - when?
Nifty has been in this cycle of going short on Tuesdays and going long on Fridays. The sad part is that there is no follow-up buying or selling. The only way for a trend follower to survive is to reduce position size and keep following the system.
This is the consolidation I am talking about, from 20th Oct to date. The good thing for the bulls is that the supports are really holding up well; every time we go hitting them, the bounces are coming. The sad part is that, even without resistance, Nifty is unable to go up.
This is where a little good news can do wonders. If the central government is considering reducing the burden of LTCG or STT, this is the right time, as such a move, when combined with a reduction of GST and increases in tax slabs, can have an avalanche effect on consumption. Traders are watching, so are the economists, because all of us know that there could be a lag of 6 to 9 months for the GST reduction to trickle down to the bottom level.

USOIL Short Idea Elliot WaveI'm eyeing a retracement on USOIL down to around $55.60. If it hits, the structure looks good for a 1:2 RR play. Just sharing my view—make sure to check the charts yourself before jumping in..

Shriramfin - Good possibility stock has topped for now.
There is a good possibility that Shriramfin has completed / completing Wave 5 as a 5th wave extension.
W1 = W3 (equality)
W5 = 1.618 x of W1-3
Internal wave counts match.
Book profits / Exit.

XAUUSD (H4) – Weekly Outlook (Dec 22–26)Buy the dip inside the channel, watch for a short-term correction after Wave 5
Strategy summary for next week
On the H4 chart, gold is still trading inside a mid-term rising channel. However, the wave structure suggests Wave 5 is likely finished, so next week I’m focusing on two main ideas:
Mid-term BUY bias, but only if price pulls back to a better liquidity area.
Short-term SELL correction, triggered only with confirmation (break below 4309) on the lower timeframe.
1) Technical view: Uptrend channel holds, but a correction is likely
Price is currently in the upper half of the channel → not an ideal spot to chase buys.
The chart highlights two key liquidity areas:
Liquidity Sell Zone near 4433 (upside target, only valid if price builds a clean path higher).
Strong Liquidity around 4254 (the area where I want to reload mid-term buys).
Meaning: The channel is still the main framework, but if Wave 5 has finished, a pullback/correction is normal before the next directional leg.
2) Mid-term plan (priority): BUY at channel liquidity
✅ Buy zone: 4250 – 4255
SL: 4240
Expectation: A rebound back toward the channel’s midline, and if momentum returns, continuation toward 4433.
Logic: This is the “better price” area aligned with the channel structure + key liquidity. Risk-reward is far cleaner than buying at the highs.
3) Short-term plan: SELL the correction only after confirmation
Because Wave 5 looks completed, a corrective sell is valid — but I only want to sell after the market confirms on the lower timeframe:
✅ Bearish confirmation: break below 4309
After the break, prefer a sell on retest (no chasing).
A realistic correction target is a move back toward the 425x liquidity zone.
Note: This is a short-term correction trade and doesn’t conflict with the mid-term buy bias.
4) Fundamentals next week: Holiday liquidity = more sweeps
Dec 22–26 includes multiple European holidays, which often means thin liquidity: price may not trend hard, but it can still wick and sweep stops.
Geopolitical risk remains elevated: Israeli officials plan to brief Trump on potential new strikes on Iran — this can trigger sudden safe-haven flows into gold.
Action: Trade smaller, trade cleaner, and avoid getting trapped in abnormal volatility.
5) Execution checklist
Mid-term BUY: wait for 4250–4255, SL 4240.
Short-term SELL: only activate if 4309 breaks, then sell the retest on lower TF.
No FOMO in a low-volume holiday week.
Which scenario are you leaning into next week: buying 425x, or waiting for a 4309 breakdown to sell the correction?

BANKNIFTY - ELLIOTT WAVE ANALYSIS - DAILY TF.Hallo Investors/Traders today analysis of bank nifty indices now is going wave 5 super cycle degree its ending diagonal pattern forming cycle degree wave 3 completed soon then 4, 5 next possible big correction so plan your position carefully

Nifty for long The market moves in a very simple way, like impulse or correction. When we traders start understanding impulse or correction, it becomes very easy to anticipate the market movement. However, some traders become too complex and start bringing complexity in the market movement. If we do not become complex and understand the market in impulse or correction, even in the present time frame of hours, then after creating an impulse wave, a correlative wave such as WXY wave is created, in which two possible structures can be formed in the market, either WXY is a complete correction in itself or another wave WXYXZ can be formed. We have to answer this first, whether WXY is a complete correction Let's cross a key level 25946. The market will form the next impulse wave above this key level. Now let's answer the second one. Below 25946, the market can form a lower Z wave. Now we have answered both of them. Now the market itself will tell at which level it is trading. As you and all of us know that after completing a corrective wave, the market forms the next impulse wave. So here the market will form the next impulse wave above the level of 25946 for a new high. That is the simple answer for all traders.
Thanks

Part 4 Learn Institutional Trading Factors Affecting Option Prices
Option pricing is influenced by several variables, commonly explained through models like the Black-Scholes model:
Price of the underlying asset
Time to expiration (time decay or theta)
Volatility (implied volatility plays a crucial role)
Interest rates
Dividends
