NAS100 buy setupThere is a good opportunity to go long in Nas100, if it gets LTF confirmation then it will be great, always keep your risk under control.
Wave Analysis

US30 buy setupThere is only one zone near US30 from where it can be bought, you can take a good trade by taking confirmation in LTF timeframe.

Artificial Intelligence Is Transforming Modern Financial MarketsAI Trading Secrets:
The Evolution from Human Trading to AI-Driven Trading
Traditional trading relied heavily on human judgment, technical indicators, and fundamental analysis. While effective to a degree, human traders are limited by emotions such as fear and greed, slower reaction times, and the inability to process vast datasets simultaneously. AI trading systems emerged to overcome these limitations. By using algorithms trained on historical and real-time data, AI systems can identify patterns, trends, and anomalies that are often invisible to the human eye. This evolution has shifted trading from being experience-based to intelligence-based.
Data Is the Core Secret of AI Trading
One of the most critical secrets behind AI trading success is data. AI thrives on data—price movements, volume, order flow, news, earnings reports, macroeconomic indicators, social media sentiment, and even geopolitical developments. Unlike traditional analysis that may focus on limited indicators, AI integrates structured and unstructured data to build a holistic market view. The more high-quality data an AI system processes, the more accurate and adaptive its predictions become.
Machine Learning and Pattern Recognition
At the heart of AI trading lies machine learning. These models learn from historical market behavior and continuously refine themselves as new data becomes available. Instead of using fixed rules like “buy when RSI is below 30,” AI systems detect complex, non-linear relationships between variables. For example, they may recognize that a specific price pattern combined with volume spikes and sentiment changes often precedes a breakout. This adaptive learning capability is a major edge that AI traders possess.
Algorithmic Speed and High-Frequency Trading
Another powerful AI trading secret is speed. AI-driven algorithms can execute trades in milliseconds or even microseconds. In high-frequency trading (HFT), profits are made from very small price differences repeated thousands of times a day. Humans cannot compete at this level. AI systems monitor multiple markets simultaneously, react instantly to price changes, and execute trades without hesitation. This speed advantage is especially crucial in volatile markets where delays can lead to missed opportunities or losses.
Emotion-Free Decision Making
One of the biggest weaknesses of human traders is emotional bias. Fear causes premature exits, greed leads to overtrading, and hope results in holding losing positions too long. AI eliminates these emotional errors entirely. It follows predefined logic and statistical probability, executing trades based purely on data and strategy. This discipline is a hidden but extremely powerful secret behind consistent AI trading performance.
Risk Management and Capital Protection
AI trading is not just about maximizing profits; it is equally focused on minimizing risk. Advanced AI systems dynamically adjust position sizes, stop-loss levels, and exposure based on market volatility and probability analysis. They can detect when market conditions change—such as during news events or sudden trend reversals—and reduce risk automatically. This intelligent risk management often protects traders from catastrophic losses that occur due to emotional or impulsive decisions.
Predictive Analytics and Market Forecasting
AI excels at predictive analytics. By analyzing historical cycles, correlations, and behavioral patterns, AI models can estimate the probability of future price movements. While no system can predict markets with 100% accuracy, AI improves the odds by identifying statistically favorable setups. These predictions are constantly updated, making AI strategies flexible rather than rigid. This adaptability is a key reason why AI systems remain effective even as market conditions evolve.
Sentiment Analysis and Alternative Data
Modern AI trading goes beyond charts and financial statements. Natural Language Processing (NLP) allows AI to analyze news articles, earnings call transcripts, social media posts, and even government announcements. By gauging market sentiment—whether investors are optimistic or fearful—AI systems can anticipate market reactions before prices fully reflect the information. This use of alternative data provides a significant informational edge.
Retail Traders and AI Accessibility
Previously, AI trading was limited to hedge funds and institutional investors due to high costs and technological barriers. Today, cloud computing, open-source libraries, and AI-powered trading platforms have made these tools accessible to retail traders. While retail traders may not match institutional-level infrastructure, they can still benefit from AI-driven indicators, automated strategies, and decision-support systems. This democratization of AI is reshaping market participation globally.
Limitations and the Importance of Human Oversight
Despite its power, AI trading is not foolproof. AI models depend on historical data, which may not fully account for rare “black swan” events. Over-optimization, poor data quality, or incorrect assumptions can lead to losses. Therefore, the real secret to successful AI trading lies in combining AI intelligence with human oversight. Traders must understand the strategy, monitor performance, and intervene when necessary.
The Future of AI Trading
The future of trading is undeniably intertwined with AI. As computing power increases and data sources expand, AI systems will become even more sophisticated. We can expect deeper integration of real-time global data, improved predictive accuracy, and more personalized trading strategies. However, markets will always remain competitive, and no AI system will guarantee profits. Continuous learning, discipline, and adaptation will remain essential.
Conclusion
AI trading secrets are rooted in data mastery, machine learning, speed, emotional neutrality, and intelligent risk management. Artificial Intelligence does not replace traders; it empowers them with tools that enhance decision-making and consistency. Those who understand and responsibly use AI in trading gain a significant edge in modern financial markets. In an era where information moves faster than ever, AI is not just an advantage—it is becoming a necessity for sustainable trading success.

The Resurgence of India’s Public Sector Banking PowerHistorical Challenges Faced by PSU Banks
For a long time, PSU banks struggled under the weight of stressed assets, particularly after the corporate lending boom of the mid-2000s. Aggressive lending to infrastructure, power, steel, and telecom sectors, combined with economic slowdowns and policy bottlenecks, led to a sharp rise in NPAs. Weak credit appraisal systems, governance challenges, and limited autonomy further constrained performance. As a result, profitability declined, capital adequacy weakened, and market valuations remained subdued compared to private sector banks.
Government-Led Reforms and Recapitalization
A major catalyst behind the rise of PSU banks has been decisive government intervention. Large-scale recapitalization programs injected much-needed capital into banks, strengthening their balance sheets and enabling them to meet regulatory requirements. The government also initiated governance reforms, including improved board oversight, professional management practices, and performance-linked accountability. These steps restored stability and provided PSU banks with the confidence to resume lending activity.
Resolution of NPAs and Improved Asset Quality
One of the most significant contributors to the revival of PSU banks is the sharp improvement in asset quality. The introduction of the Insolvency and Bankruptcy Code (IBC) created a structured mechanism for resolving stressed assets. Through recoveries, write-offs, and better provisioning practices, gross and net NPAs declined substantially across major PSU banks. Improved asset quality reduced credit costs, directly boosting profitability and strengthening investor sentiment.
Robust Credit Growth and Economic Recovery
India’s economic recovery and sustained growth momentum have provided a favorable backdrop for PSU banks. Rising demand for credit from infrastructure, manufacturing, MSMEs, agriculture, and retail segments has supported healthy loan growth. Government-led capital expenditure on roads, railways, defense, and renewable energy has especially benefited PSU banks, given their strong presence in project financing and public sector lending. This renewed credit cycle has translated into higher interest income and better utilization of capital.
Digital Transformation and Operational Efficiency
PSU banks have made significant strides in digital transformation, narrowing the gap with private sector peers. Investments in core banking systems, digital payment platforms, mobile banking apps, and fintech partnerships have improved customer experience and operational efficiency. Automation and data analytics have enhanced risk management and credit monitoring, reducing the likelihood of future asset quality stress. These technological upgrades have helped PSU banks remain competitive in an increasingly digital financial ecosystem.
Improved Profitability and Financial Metrics
As asset quality improved and credit growth picked up, PSU banks began reporting strong financial results. Many leading PSU banks have posted record profits, supported by lower provisioning requirements, stable net interest margins, and improved cost management. Capital adequacy ratios have strengthened, return on assets has improved, and balance sheets appear more resilient. This financial turnaround has been a key driver behind the rising stock market performance of PSU bank shares.
Investor Confidence and Market Re-Rating
The improved fundamentals of PSU banks have not gone unnoticed by investors. After years of underperformance, PSU bank stocks have seen significant re-rating in the equity markets. Domestic institutional investors and retail participants have shown renewed interest, attracted by improving earnings visibility, reasonable valuations, and strong dividend potential. The rising performance of PSU banks has also contributed positively to broader banking and financial sector indices.
Strategic Role in Financial Inclusion and Social Objectives
Beyond profitability, PSU banks continue to play a vital role in financial inclusion and social development. They are instrumental in implementing government schemes such as Jan Dhan Yojana, Direct Benefit Transfers (DBT), Mudra loans, and agricultural credit programs. Their extensive branch network in rural and semi-urban areas enables them to support inclusive growth while simultaneously expanding their customer base. This dual role of commercial performance and social responsibility strengthens their long-term relevance.
Challenges That Remain
Despite the impressive rise, PSU banks still face challenges. Competition from agile private banks and fintechs remains intense. Maintaining asset quality during rapid credit expansion requires disciplined risk management. Governance reforms must be sustained to ensure autonomy, transparency, and accountability. Additionally, global economic uncertainties, interest rate volatility, and sector-specific stress could test the resilience of PSU banks in the future.
Outlook: A Sustainable Revival
The rise of PSU banks marks a structural shift rather than a short-term recovery. With cleaner balance sheets, stronger capital positions, improved governance, and supportive macroeconomic conditions, PSU banks are well-positioned to sustain growth. Their role in financing India’s infrastructure push, supporting MSMEs, and expanding financial inclusion will remain crucial in the coming years. If reforms continue and risk management remains prudent, PSU banks are likely to emerge as stable, profitable, and trusted institutions in India’s financial landscape.
Conclusion
The resurgence of PSU banks represents one of the most significant success stories in India’s financial sector in recent times. From grappling with severe stress to delivering strong financial performance, PSU banks have demonstrated resilience and adaptability. Their rising trajectory reflects the combined impact of policy reforms, economic recovery, and internal transformation. As they continue to evolve, PSU banks are set to play a central role in shaping India’s growth story, reinforcing confidence in the public sector banking system, and contributing to long-term economic stability.

Completion of 5 wavesPower India has completed 5 waves where wave 1 is the longest . It is in the form of a diagonal. The correction is still unfolding and should end i the vicinity of wave 2 , preferably near it low around 10000-11000. It is still making red candles . Correction will be over then we get a good green candle who top should be traded by another green candle or appearance of 3 white soldier in the vicinity of wave 2.

Nifty Looks ChoppyThough Nifty is reacting from a big timeframe’s demand area, on smaller timeframe things are very choppy and confusing.
However, this looks good. We have taken out most recent liquidity sweep, but enough demand comes, we can see a reversal.

Silver is also reactingSame as Gold, reacting from an early but strong zone with pending liquidity and demand below.
Worth taking a small risk right now to rise the rally if it starts early
Otherwise can as well wait for the unmitigated area below for full size position.

Gold is strongGold is bullish in all sense as of now
Currently reacting from previous higher timeframe high, decent demand area
If price doesn’t sustain we have better unmitigated demand zones below

ETH is holding upJust like BTC, ETH is not in not in a discount area
But showing strong support near break block
Structure Shift on Smaller Timeframe
Can expect prices to go up from here itself, otherwise will wait for reaction from unmitigated demand zone

BTC Reacting From DemandBTC showing decent bullish signs
Got structure shift on smaller timeframe
Got liquidity sweep and support from demand zone on Current timeframe
Got Bullish ChOCh on Higher Timeframe
Only point of discomfort is we didn’t come in discount zone and prices are technically overvalued
If price decide to travel down to mitigate that demand and give a solid reaction then a positional size entry cane be made.

Part 10 Trade Like Institutions Open Interest (OI) – The Most Important Tool
OI reveals:
Where option writers (big money) are active
Market expectations
Support and resistance zones
CE OI Buildup
Resistance zone
Option sellers expect market to stay below these strikes.
PE OI Buildup
Support zone
Sellers expect market to stay above these strikes.
OI Shift
When PE writers exit and CE writers build → Trend reversal.

Part 9 Trading Master Class With Experts How Institutions Trade Options
Institutions focus on:
Selling premium (because they have capital)
Hedged positions
Large OI levels
Neutral strategies like condors and spreads
Market-making
Risk-neutral trades using delta-neutral strategies
Retail traders tend to chase:
Lottery OTM options
Low probability trades
News-based speculation
Institutions focus on consistency.

Angel One: Power Bounce or Wave 4 Noise?Since its inception low near ₹222 , Angel One Limited has delivered a strong multi-year advance. The initial rally into ₹1,689 is best viewed as Wave 1 , followed by a deep yet corrective decline toward ₹990.50, forming Wave 2 . This laid the foundation for an extended Wave 3 , which accelerated sharply and culminated near ₹3,896 .
Following the Wave 3 peak, price action transitioned into a sideways and overlapping phase , characteristic of a complex Wave 4 correction rather than the start of a fresh impulsive advance. The correction so far appears to be unfolding as a W–X–Y-type structure , with scope for further extension if price continues to face resistance. Crucially, Wave 1 remains intact , preserving the broader impulsive framework — though it remains unconfirmed at this stage.
The latest +17.94% weekly candle highlights strong reactionary demand . However, price continues to trade below the descending trendline resistance , and a clear impulsive breakout has yet to emerge. With the Union Budget (Feb 1) approaching, event-driven volatility remains a key near-term risk.
Bottom line:
Wave 3 stands extended.
Wave 4 is likely still in progress.
Wave 5 will only be considered on a clean impulsive breakout and a sustained close above descending trendline resistance.
Disclaimer: This analysis is for educational purposes only and does not constitute investment advice. Please do your own research (DYOR) before making any trading decisions.

Gold weekly rotation between 4682 supply and 4420 demand🟡 XAUUSD – Weekly Smart Money Plan | by Ryan_TitanTrader (17/01)
📈 Market Context
Gold remains structurally bullish on the higher timeframe, but weekly price action has clearly transitioned into a controlled Smart Money rotation. After delivering buy-side liquidity into premium, continuation has stalled.
This week’s hot drivers — USD volatility, U.S. yield repricing, and renewed Fed rate-cut expectations amid sticky inflation data and geopolitical hedging flows — are creating ideal conditions for inducement and liquidity engineering rather than clean trend expansion.
With risk sentiment fragile and positioning crowded, Gold is behaving typically at extremes: sweeps, fake breaks, and mean reversion, not impulsive continuation.
🔎 Technical Framework – Smart Money Structure (H4–H1)
Current Phase:
HTF bullish bias remains valid, but internal structure shows distribution from premium after liquidity delivery.
Key Idea:
Sell reactions from premium supply, or wait patiently for a deeper pullback into HTF demand to reload longs.
Structural Notes:
• HTF BOS confirms bullish dominance
• Buy-side liquidity already taken above highs
• Clear rotation channel forming
• Liquidity shortage zone acting as magnet
• Discount demand aligns with prior OB + channel support
💧 Liquidity Zones & Key Levels
• 🔴 SELL GOLD 4680 – 4682 | SL 4690
• 🟢 OB BUY GOLD 4420 – 4418 | SL 4410
🧠 Institutional Flow Expectation
Liquidity sweep → MSS / CHoCH → BOS → displacement → OB / FVG retest → expansion or deeper rotation
🎯 Execution Rules
🔴 SELL GOLD 4680 – 4682 | SL 4690
Rules:
✔ Price taps premium channel supply
✔ Buy-side liquidity taken above recent highs
✔ Bearish MSS / CHoCH on H1–M15
✔ Downside BOS confirms distribution
✔ Entry via bearish FVG or supply OB
Targets:
• 4620 — internal reaction
• 4560 — liquidity shortage
• 4480 — deeper weekly rotation
• Trail aggressively (distribution play)
🟢 OB BUY GOLD 4420 – 4418 | SL 4410
Rules:
✔ Sweep into weekly discount zone
✔ Strong confluence: HTF OB + channel support
✔ Bullish MSS / CHoCH on M15–H1
✔ Impulsive BOS with displacement
✔ Entry via refined bullish OB
Targets:
• 4560 — first reaction
• 4620 — mid-range liquidity
• 4680+ — continuation if expansion resumes
⚠️ Risk Notes
• Premium zones = liquidity traps
• Expect false breaks during macro headlines
• No entry without MSS + BOS
• Reduce risk near HTF extremes
📍 Summary
Gold is bullish by structure, but this week is about precision execution, not prediction:
• Premium may deliver a Smart Money sell from 4680–4682, or
• Discount at 4420–4418 may reload longs for the next impulsive leg.
Let liquidity move first.
Let structure confirm second.
Smart Money controls — patience pays. ⚡️
📌 Follow @Ryan_TitanTrader for weekly Smart Money gold breakdowns.

Gold fluctuates between 4672 resistance and 4560 support.🟡 XAUUSD – Intraday Smart Money Plan | by Ryan_TitanTrader (16/01)
📈 Market Context
Gold remains structurally bullish on the higher timeframe, but intraday price action has shifted into controlled rotation. With today’s hot drivers — USD volatility, U.S. yield fluctuations, and ongoing Fed rate-cut speculation — Smart Money is no longer pushing continuation. Instead, liquidity is being engineered around premium and discount zones.
Ahead of U.S. macro headlines and inflation-linked expectations, Gold is behaving typically at extremes: inducement, stop-hunts, and mean reversion rather than impulsive trend extension.
🔎 Technical Framework – Smart Money Structure (H1–M15)
Current Phase:
HTF bullish bias intact, while intraday structure shows corrective rotation after buy-side liquidity was taken.
Key Idea:
Look for distribution from premium supply or a deeper pullback into discount demand for buying/entry reloads.
Structural Notes:
• HTF BOS confirms bullish dominance
• Buy-side liquidity already delivered
• Price rotating, not expanding impulsively
• Internal FVG acting as downside magnet
• Discount demand aligns with prior OB support
💧 Liquidity Zones & Triggers
• 🔴 SELL GOLD 4670 – 4672 | SL 4680
• 🟢 BUY GOLD 4561 – 4559 | SL 4551
🧠 Institutional Flow Expectation
Liquidity sweep → MSS / CHoCH → BOS → displacement → OB/FVG retest → expansion
🎯 Execution Rules
🔴 SELL GOLD 4670 – 4672 | SL 4680
Rules:
✔ Price taps premium supply
✔ Buy-side liquidity taken above highs
✔ Bearish MSS / CHoCH on M5–M15
✔ Clear downside BOS
✔ Entry via bearish FVG or supply OB
Targets:
• 4620 — internal reaction
• 4585 — liquidity pool
• Trail aggressively (distribution play)
🟢 BUY GOLD 4561 – 4559 | SL 4551
Rules:
✔ Sweep into discount demand
✔ Confluence with OB + FVG
✔ Bullish MSS / CHoCH on M5–M15
✔ Strong upside BOS with displacement
✔ Entry via refined bullish OB
Targets:
• 4620 — first reaction
• 4670 — internal liquidity
• 4700+ — continuation if expansion resumes
⚠️ Risk Notes
• Premium zones = liquidity traps
• Expect fake breaks during news volatility
• No entry without MSS + BOS
• Reduce size near extremes
📍 Summary
Gold is bullish by structure, but today is about execution, not prediction:
• Premium may deliver a Smart Money sell from 4670–4672, or
• Discount at 4561–4559 may reload buying/entry for the next leg higher.
Let liquidity move first.
Let structure confirm second.
Smart Money controls — patience pays. ⚡️
📌 Follow @Ryan_TitanTrader for daily Smart Money gold breakdowns.

Candle Patterns How Candle Patterns Work with Market Structure
Candles do not work well in isolation. Their true power emerges when aligned with:
Support/Resistance Levels
Trend Direction
Breakouts and Pullbacks
Volume Profile Zones (HVN, LVN)
For example:
A Hammer at support = reliable reversal.
A Doji at resistance = caution for buyers.
Engulfing pattern after liquidity sweep = strong reversal.
Market structure helps validate candlestick signals and improve accuracy.

TECHM 1 Day Time Frame 📍 Latest Price Range (Today on NSE):
• Low ~ ₹1,600 and High ~ ₹1,681 (intraday range) from current data today.
🔁 Key Levels for 1‑Day Timeframe
Immediate Resistance Levels
These are zones where price may face selling pressure if it rises:
R1: ~ ₹1,700 – ₹1,702
R2: ~ ₹1,731 – ₹1,732
R3: ~ ₹1,781 – ₹1,782
Pivot
Daily Pivot Point: ~ ₹1,659 – ₹1,660 (indicative mid‑point of the current range)
Support Levels
These are zones where price may find demand on declines:
S1: ~ ₹1,620 – ₹1,621
S2: ~ ₹1,569 – ₹1,570
S3: ~ ₹1,539 – ₹1,540
📊 Technical Indicators Snapshot
(Not direct price levels, but useful context on daily price behavior)
Moving averages (20/50/100/200) are in the ~₹1,530‑₹1,590 range, offering dynamic support/resistance clusters.
RSI & momentum oscillators on some indicators show mixed to neutral momentum on daily charts — suggesting a range‑bound bias unless there’s a breakout.
📌 How Traders Use These Levels
Bullish scenario: A sustained close above ₹1,700 could open upside to ₹1,730/₹1,780.
Bearish scenario: Breakdown below ₹1,620 and ₹1,570 may head toward ₹1,540 support.
Pivot area (~₹1,660) acts as a short‑term balance zone: above it favors buyers, below it favors sellers.

BTCUSD — Long-Term Structural Context (Monthly)Bitcoin continues to trade within a well-defined long-term rising structure on the monthly timeframe.
Price remains above the primary structural pivot, indicating that the broader uptrend is intact, despite intermediate volatility.
Key Observations:
• Long-term rising channel remains respected
• Recent price action reflects structural digestion, not trend reversal
• No higher-timeframe invalidation observed at present
Key Levels (Structural Reference):
• 69,000 — Major regime / structural pivot
• 15,479 — Cycle-degree base support
• 3,122 — Long-term historical support
• 152 — Extreme tail reference (legacy)
Structural Invalidation:
• A sustained break below 15,479 would question the long-term bullish structure
• Above this level, pullbacks remain corrective in nature
Context Note:
This chart reflects structural positioning , not short-term trading signals.
#Bitcoin #BTCUSD #CryptoMarket #MarketStructure #ElliottWave #LongTermTrend #TechnicalAnalysis #MarketOmorph

PIDILITIND 1 Week Time Frame 📌 Current Weekly Price Context (as of 16‑17 Jan 2026)
Last seen price: ~₹1,475 on NSE (latest technical snapshot)
Weekly momentum on short/medium averages is neutral (no strong trend bullish or bearish on EMA/SMA clusters)
RSI and other oscillators are also neutral to modestly positive — not extreme.
📈 Weekly Pivot & Key Levels (classic weekly pivot analysis)
Resistance Zones
1. R1: ~₹1,498–₹1,500
2. R2: ~₹1,507–₹1,520
3. R3: ~₹1,520+ (next cluster)
(Weekly pivot resistances based on recent price action)
Pivot Point
Weekly Pivot: ~₹1,484–₹1,486
Above this pivot → slightly bullish bias; below → slightly bearish
Support Zones
1. S1: ~₹1,476–₹1,478
2. S2: ~₹1,462–₹1,470
3. S3: ~₹1,453–₹1,456
(Weekly pivot support levels)
📅 Weekly Levels Summary (Rounded)
Level Price Zone (Approx)
R3 ₹1,520+
R2 ₹1,507–₹1,520
R1 ₹1,498–₹1,500
Pivot ₹1,484–₹1,486
S1 ₹1,476–₹1,478
S2 ₹1,462–₹1,470
S3 ₹1,453–₹1,456

RBLBANK 1 Day Time Frame 📊 Daily Support & Resistance Levels
Immediate resistances:
~₹315–₹318 area — observed short-term resistance zone and recent highs.
~₹325–₹330 — upper resistance band near recent 52-week highs.
Immediate supports:
~₹300–₹295 — important short-term support zone on daily charts.
~₹285–₹280 — next support cluster if breakdown below ₹295 occurs.
📉 Pivot & Intraday Levels (Indicative)
(These are based on typical pivot calculations from recent sessions — actual values will vary daily)
Pivot: around ₹290–₹295.
R1: ~₹295–₹300
R2: ~₹300–₹305
S1: ~₹285–₹280
S2: ~₹280–₹275
(Pivot-based levels give clues for intraday trading and are often recalculated each day.)
📈 Technical Indicator Context (Daily)
RSI (~50) — neutral momentum, neither overbought nor oversold.
Short MA structure shows mixed signals; some shorter SMAs/EMAs near current price.
MACD slightly bearish to neutral on some sources.
🧠 Notes for Daily Traders
Bullish break above ~₹318–₹320 with volume can open up short-term upside towards ₹325–₹330+.
A daily close below ~₹295 may signal short-term weakness and can expose deeper support around ₹285–₹280.

Indian Trading Market Reports: Trends and PerformanceStructure of the Indian Trading Market
India’s trading market is primarily driven by its two major stock exchanges: the National Stock Exchange (NSE) and the Bombay Stock Exchange (BSE). These exchanges facilitate trading in equities, derivatives, currencies, and commodities. Equity markets form the backbone of trading activity, while derivatives such as futures and options contribute significantly to daily volumes, particularly in indices like NIFTY 50 and BANK NIFTY.
Market reports usually begin by outlining index performance. Benchmark indices such as the NIFTY 50, Sensex, NIFTY Bank, and sectoral indices are closely monitored to gauge overall market sentiment. A rising index typically reflects optimism and economic strength, while a declining index may signal caution, uncertainty, or external pressures.
Role of Market Reports in Trading
Indian trading market reports act as a bridge between raw market data and actionable insights. They consolidate vast amounts of information—price movements, volumes, volatility, and technical indicators—into a structured narrative. These reports help traders identify trends, key support and resistance levels, momentum shifts, and potential breakout or breakdown zones.
For investors, market reports provide a broader view of economic health, corporate earnings, and policy developments. Long-term participants rely on these reports to assess valuation levels, sector rotation, and growth opportunities. In essence, trading market reports transform complex market behavior into understandable analysis.
Market Trends and Sentiment Analysis
A major component of Indian trading market reports is trend analysis. Trends can be short-term (intraday or weekly), medium-term (monthly), or long-term (yearly). Reports often highlight whether the market is in an uptrend, downtrend, or consolidation phase.
Sentiment analysis is equally important. Indian markets are influenced by both domestic and global cues. Positive sentiment may arise from strong GDP growth, declining inflation, stable interest rates, or robust corporate earnings. Negative sentiment can be triggered by geopolitical tensions, global market sell-offs, rising crude oil prices, or currency volatility.
Market reports frequently classify sentiment as bullish, bearish, or neutral, helping traders align their strategies accordingly.
Sectoral Performance Insights
Indian trading market reports place strong emphasis on sectoral analysis. Sectors such as banking, information technology, pharmaceuticals, metals, energy, FMCG, and infrastructure are tracked individually. Sectoral indices reveal where money is flowing and which areas are under pressure.
For example, strong performance in banking and financial stocks often indicates confidence in economic growth and credit expansion. A rally in IT stocks may be driven by currency depreciation or strong global demand. Conversely, weakness in metal stocks could reflect declining global commodity prices or reduced industrial demand.
By studying sectoral trends, traders can identify leadership sectors and laggards, enabling better capital allocation and risk management.
Derivatives and F&O Market Overview
Derivatives play a significant role in Indian trading, and market reports dedicate special sections to futures and options (F&O) data. Open interest, option chain analysis, put-call ratios, and rollover data are commonly analyzed.
These indicators help traders understand institutional positioning and market expectations. High call open interest at a particular strike price may indicate resistance, while high put open interest can suggest support. Changes in open interest along with price movements reveal whether positions are being built or unwound.
F&O insights are especially valuable for short-term traders who rely on volatility and momentum.
Influence of Macroeconomic Factors
Indian trading market reports closely track macroeconomic variables such as inflation, interest rates, fiscal deficit, industrial production, and trade data. Announcements by the Reserve Bank of India (RBI), Union Budget, and government policy reforms have immediate and sometimes long-lasting impacts on the market.
Global factors also play a vital role. Movements in US markets, Federal Reserve decisions, crude oil prices, and global risk sentiment significantly influence Indian markets. Market reports integrate these factors to explain sudden spikes or declines in prices.
Technical and Fundamental Perspectives
A comprehensive Indian trading market report balances both technical and fundamental analysis. Technical analysis focuses on charts, indicators, patterns, and price action to forecast short-term movements. Fundamental analysis evaluates company earnings, balance sheets, management quality, and growth prospects to assess intrinsic value.
By combining both approaches, reports cater to a wide range of market participants—from day traders to long-term investors.
Risk Factors and Volatility
Volatility is an inherent part of trading, and Indian market reports emphasize risk awareness. Sudden news events, policy changes, or global shocks can increase volatility sharply. Reports often include volatility index (India VIX) analysis to indicate expected market fluctuations.
Understanding risk factors helps traders position themselves prudently, use stop-loss strategies, and avoid emotional decision-making.
Future Outlook and Conclusion
Indian trading market reports usually conclude with a forward-looking outlook. This section highlights key levels to watch, upcoming economic events, earnings schedules, and potential risk triggers. While no report can predict the market with certainty, a well-structured outlook prepares traders for multiple scenarios.
In conclusion, Indian trading market reports are indispensable tools in today’s fast-moving financial environment. They provide clarity, structure, and perspective amid market noise. By analyzing trends, sectors, derivatives, and macroeconomic factors, these reports empower market participants to make informed, disciplined, and strategic trading decisions.
Smart Money SecretsHow Institutional Investors Really Win in Financial Markets
In financial markets, the term “smart money” refers to capital controlled by institutions, professional traders, hedge funds, banks, and experienced investors who possess deep knowledge, superior resources, and disciplined strategies. Unlike retail traders, smart money does not chase headlines or react emotionally to short-term price fluctuations. Instead, it moves markets quietly, strategically, and with a long-term perspective. Understanding smart money secrets can help individual traders and investors align themselves with market strength rather than fight against it.
Understanding Who Smart Money Is
Smart money represents participants with access to advanced research, large capital, insider-level understanding of market mechanics, and professional risk management systems. These include mutual funds, pension funds, insurance companies, proprietary trading desks, and seasoned investors. Their decisions are not impulsive; they are based on data, probability, and macro-to-micro analysis. While retail traders often focus on indicators alone, smart money focuses on price behavior, liquidity, and market structure.
Smart Money Thinks in Probabilities, Not Predictions
One of the biggest secrets of smart money is that it never tries to predict the market with certainty. Instead, it operates on probabilities. Every trade is viewed as a calculated risk where losses are controlled and profits are allowed to grow. Smart money accepts losses as part of the game and avoids emotional attachment to any single position. This mindset allows institutions to survive long-term, even through volatile market conditions.
Liquidity Is the Real Target
Smart money does not enter or exit trades randomly. It seeks liquidity—areas in the market where many orders are placed, such as stop-loss zones above resistance or below support. These zones provide enough volume for large players to enter or exit positions without causing extreme price disruption. Many sudden price spikes or sharp reversals occur because smart money is collecting liquidity from retail traders who place predictable stop losses.
Market Structure Over Indicators
Retail traders often overload charts with indicators, while smart money primarily studies market structure—higher highs, lower lows, break of structure (BOS), and change of character (CHOCH). Institutions analyze how price moves from one liquidity zone to another. Indicators may lag, but structure reveals the true intent of price movement. Smart money enters trades during consolidation phases and exits during expansion phases, when retail traders are just entering.
Accumulation and Distribution Phases
A key smart money secret lies in understanding accumulation and distribution. During accumulation, institutions quietly build positions while price moves sideways and volatility remains low. Retail traders often get bored and exit during this phase. Once accumulation is complete, price expands rapidly, attracting retail participation. At the top, smart money distributes its holdings while retail traders buy aggressively, believing the trend will continue forever.
Time Is a Strategic Weapon
Smart money is patient. It can wait weeks, months, or even years for the right opportunity. Retail traders, on the other hand, often feel pressure to trade daily. Institutions understand that not trading is also a position. They focus on high-quality setups aligned with broader trends rather than constant activity. This patience allows smart money to enter at optimal prices and avoid unnecessary losses.
Risk Management Is Non-Negotiable
Another powerful secret is strict risk management. Smart money never risks a large percentage of capital on a single trade. Position sizing is calculated precisely, ensuring survival even during losing streaks. Institutions focus more on capital preservation than on making quick profits. This approach allows compounding to work over time, which is the true source of long-term wealth in markets.
Emotions Are Removed From Decisions
Smart money operates through systems, rules, and predefined strategies. Emotional trading—driven by fear, greed, or revenge—is eliminated as much as possible. Decisions are made before entering a trade, including entry, stop-loss, and exit points. Retail traders often react emotionally to market noise, while institutions remain calm and disciplined.
News Is Used, Not Followed
While retail traders often react to news events, smart money prepares in advance. Institutions understand that markets often price in news before it becomes public. By the time headlines appear, smart money may already be exiting positions. News is used as a liquidity event rather than a signal to enter blindly. This is why markets sometimes move opposite to expectations after major announcements.
Following Smart Money Instead of Fighting It
The most valuable lesson for retail traders is not to compete with smart money, but to align with it. This means trading with the trend, respecting key levels, understanding volume and price behavior, and avoiding overtrading. Observing how price reacts at support and resistance, how breakouts behave, and where false moves occur can offer clues to smart money activity.
Conclusion: Turning Knowledge Into Advantage
Smart money secrets are not about hidden tricks or insider information; they are about discipline, patience, structure, and risk control. Institutions win because they think differently, manage risk professionally, and understand how markets truly function. Retail traders who adopt these principles—focusing on probability, liquidity, market structure, and emotional control—can dramatically improve their performance.
Ultimately, the goal is not to outsmart smart money, but to trade alongside it. When you stop chasing the market and start understanding how and why price moves, you shift from being liquidity for smart money to becoming a more informed and strategic market participant.

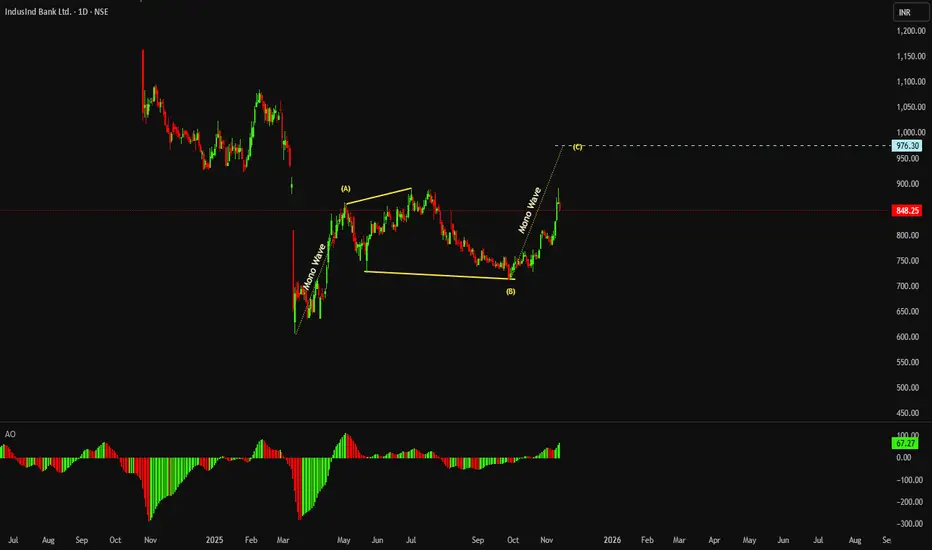
Mono Wave In This Chart Pattern Example I have Visually Represented Mono Wave identification
Friends its Important to note the behavior of Price along the side of its movement is
important , as a single strong move on daily suggest the movement is Mono Wave or Representation of fast displacement of price
Now its also important to note which part of the move is not having the character of Mono wave
That part should be considered as time consuming pattern or ideally know as correction in between the momentum
They also represent the expansion making new high with evidence of weak price move
suggesting its an weak move before the required time bond correction complete
This is education content
I hope you like it if you do then please hit the like button stay tuned subscribe to get more such content
Good luck