IDEA 1 Day Time Frame 📌 Current Price (Daily)
₹11.27–₹11.30 approx (trading near this level today)
📈 Daily Support & Resistance Levels (1-Day Time Frame)
🚀 Immediate Resistance
R1: ~₹11.44 — first resistance level for today
R2: ~₹11.64 — mid-term breakout zone
R3: ~₹11.81–₹11.85 — higher resistance, break above signals strength
Major Horizontal Resistance: ~₹11.80-₹12.00 — past multiple rejections zone
📉 Immediate Support
S1: ~₹11.07 — first line of support intraday
S2: ~₹10.90 — short-term support band
S3: ~₹10.70 — deeper support for stronger pullbacks
💡 Quick Summary (1-Day)
Level Type Price
Resistance 3 ~₹11.81 – ₹11.85
Resistance 2 ~₹11.64
Resistance 1 ~₹11.44
Current ~₹11.27 – ₹11.30
Support 1 ~₹11.07
Support 2 ~₹10.90
Support 3 ~₹10.70
Wave Analysis

Gold 1H – Fed Chair Speculation Drives Smart Money Flow🟡 XAUUSD – Intraday Smart Money Plan | by Ryan_TitanTrader (16/12)
📈 Market Context
Gold is trading in a liquidity-driven range as markets focus on today’s hot topic: NFP expectations and Fed rate-path uncertainty.
Recent NFP previews highlight divergence between slowing headline job growth and still-sticky wage components, keeping DXY flows unstable. This environment typically favors stop-hunts and liquidity sweeps rather than clean directional moves ahead of confirmation.
As a result, Smart Money is likely to engineer price into clear premium and discount zones before committing to expansion.
🔎 Technical Framework – Smart Money Structure (1H)
Current Phase: Post-expansion, consolidating after a CHoCH within a broader bullish context
Key Idea: Expect a sweep into premium (4352–4354) or discount (4272–4270) before the next impulsive move
Structural Notes:
• Higher-timeframe BOS keeps bullish bias intact
• Recent pullback reflects distribution/profit-taking, not a confirmed reversal
• Equal highs above 4350 and sell-side liquidity below 4270 are clearly exposed
Liquidity Zones & Triggers:
• 🔴 SELL GOLD 4352 – 4354 | SL 4362
• 🟢 BUY GOLD 4272 – 4270 | SL 4262
Institutional Flow Expectation:
sweep → MSS / CHoCH → BOS → displacement → FVG / OB retest → expansion
🎯 Execution Rules (matching your exact zones)
🔴 SELL GOLD 4352 – 4354 | SL 4362
Rules:
✔ Liquidity sweep above recent highs into premium
✔ Bearish MSS / CHoCH on M5–M15
✔ Downside BOS with strong bearish displacement
✔ Entry via bearish FVG refill or refined supply OB
Targets:
1. 4325
2. 4300
3. 4285 – extension if momentum accelerates
🟢 BUY GOLD 4272 – 4270 | SL 4262
Rules:
✔ Liquidity grab below equal lows / dynamic support
✔ Bullish MSS / CHoCH confirms demand takeover
✔ Upside BOS with impulsive displacement
✔ Entry via bullish FVG fill or demand OB retest
Targets:
1. 4285
2. 4310
3. 4350 – extension if USD weakens post-data
⚠️ Risk Notes
• NFP-related positioning can cause false breaks — wait for structure, not the first spike
• Avoid trades without clear MSS + BOS confirmation
• Expect higher spreads and volatility during the U.S. session
• Reduce risk if entering close to major data releases
📍 Summary
Today’s gold setup is defined by NFP-driven rate uncertainty:
• A sweep into 4354 may invite bearish structure back toward 4300–4285
or
• A liquidity grab near 4270 could reload bullish flow toward 4310–4350
Let structure confirm — Smart Money reacts, retail anticipates. ⚡️
📌 Follow @Ryan_TitanTrader for daily Smart Money gold breakdowns.

PEL : Golden Retracement • Demand Reaction • Risk-Defined Trade📊 PRIMAL ENTERPRISES | 2H STRUCTURE-BASED SWING SETUP
Golden Retracement | Demand Reaction | Risk-Defined Trade
📌 Chart Context & Market Structure
Price has completed a strong impulsive decline from the prior swing high and is now reacting from the Golden Retracement Zone (Fib 50%–78%), which historically acts as a decision area between trend continuation and deeper correction.
This zone also overlaps with a higher timeframe demand pocket, increasing its technical significance.
Key observations from the chart:
Strong bearish impulse followed by slowing downside momentum
Price testing Fib 50%–78% retracement → value re-assessment zone
Clear invalidation level marked via hourly close below demand
🔍 Why This Zone Matters (Educational Insight)
📌 The golden retracement zone represents an area where:
Smart money evaluates whether the prior trend is still valid
Late sellers get absorbed by institutional demand
Failed demand here often leads to accelerated downside due to liquidity vacuum
If buyers defend this zone, price usually transitions into a corrective → impulsive recovery.
If demand fails, price seeks the next high-liquidity support below.
📈 Bullish Projection (Primary Scenario)
If price:
Holds above the golden retracement zone
Forms higher lows on lower timeframes
Shows acceptance above the immediate resistance
➡️ Expect a structural recovery phase.
Upside Path (Projection):
Near-term resistance breakout → momentum pickup
Sustained move above 1,237 confirms strength
Swing expansion toward 1,274 – 1,289 zone
This aligns with a mean-reversion + trend resumption structure.
📉 Bearish Risk Scenario (If Demand Fails)
If price:
Fails to attract buying interest within Fib 50%–78%
Breaks demand with an hourly close below 1,082
📌 It signals demand exhaustion and breakdown of value perception, increasing the probability of a deeper corrective leg toward the next higher-timeframe demand zone below.
This is why risk is clearly defined, not assumed.
🎯 Trade Strategy (Educational, Not Advisory)
Bullish Swing Strategy:
Entry: Demand hold + bullish structure confirmation
Stop Loss: Hourly close below 1,082
Targets: Partial near resistance → Swing target 1,274 – 1,289
Risk Management Logic:
Trade is invalid if demand fails — no hope-based holding
Position sizing based on SL distance
Patience required; no chasing breakouts
🧠 Key Learning Takeaway
📌 When price reacts at the golden retracement:
Acceptance = trend continuation
Rejection = deeper correction
The goal is not prediction — it is preparing for both outcomes with clarity and discipline.
🧾 Conclusion
This setup offers:
Clear structure
Defined risk
Favorable risk-reward if demand holds
Let price confirm. Let structure guide. Let risk stay controlled.
⚠️ Disclaimer
I am not a SEBI-registered analyst. This analysis is for educational purposes only. Please conduct your own analysis or consult a qualified financial advisor before taking any trades.

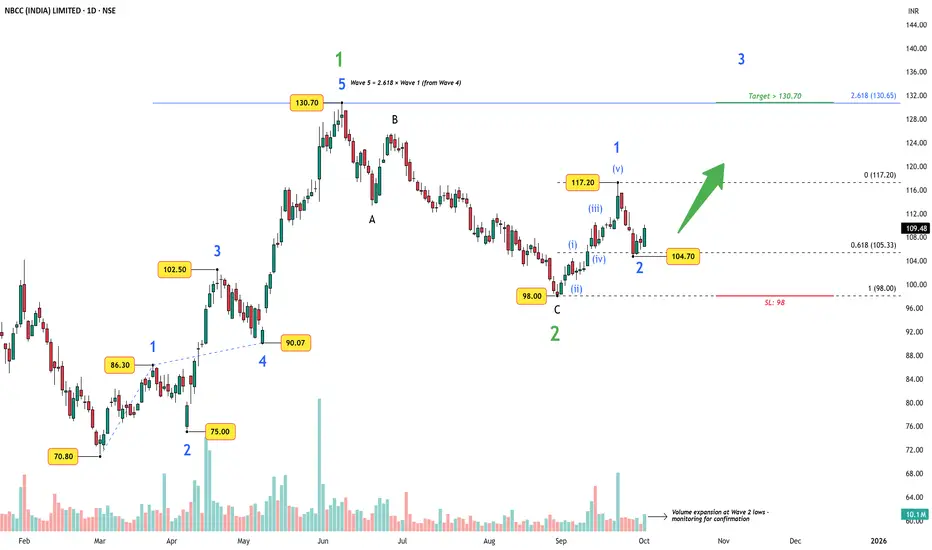
NBCC (India) – Wave 3 Setup Backed by Strong Project PipelineAfter completing a textbook 5-wave advance into 130.70 , where Wave 5 aligned exactly with the 2.618 extension of Wave 1 projected from Wave 4, NBCC corrected into 98. That low now marks a clean green Wave 2.
The recent bounce to 117.20 formed Wave 1 of a higher-degree Wave 3.
Price has retraced into the 104–105 zone (0.618 Fib) with visible volume expansion, suggesting accumulation.
Invalidation/SL sits at 98 , making risk well-defined.
Breakout above 117.20 opens the path toward 130.70+ and potentially much higher, in line with the 2.618 Fib target around 130.65.
Fundamentals in Brief
Market cap: ₹295.9B
P/E ratio: ~50.8, indicating premium valuation but supported by steady order book growth.
Revenue (FY24): ~₹115.9B, with Project Management Consultancy (PMC) as the major contributor.
Debt: Effectively zero – NBCC runs a net cash balance sheet, giving it flexibility.
Dividend yield (TTM): ~0.8% – small, but consistent payouts.
Margins: Net margin steady around 5–6%.
NBCC’s fundamentals support its technical setup: low leverage, steady revenues, and government backing in project management give confidence that the bullish Elliott Wave count has room to play out.
Disclaimer: This analysis is for educational purposes only and does not constitute investment advice. Please do your own research (DYOR) before making any trading decisions.
XAUUSD – 15M | SMC-Based Trade PlanGold is currently in a corrective phase after a strong impulsive move to the upside. Price has delivered a clear displacement, followed by a pullback into a refined demand zone, highlighted on the chart. This area aligns with prior bullish order flow and acts as a discount zone within the higher-timeframe range.
The current sell-off appears corrective, not impulsive. Expectation is for price to mitigate demand, sweep weak lows if needed, and then resume the primary bullish structure.
Execution Plan (Important):
➡ No blind entries.
➡ Entry will be taken only if LTF confirms bullish intent (CHoCH, BOS, displacement from demand).

S&P 500: Positioned for a Santa Rally?While tracking the global markets — especially the US indices — one thing stood out clearly.
The rally from 6521.92 to 6895.78 unfolded as a clean impulsive move , not a corrective grind. That structural behavior is what made me treat this leg as an impulsive rally (Wave 1/A) rather than just another bounce.
Since then, price action has cooled into a Wave 2/B reset , pulling back towards key Fibonacci retracement pocket . Structurally, this looks more like a pause before continuation than the start of a larger breakdown.
From a broader sentiment perspective, the backdrop remains supportive. The Fed’s recent rate cut continues to favor risk assets, NVIDIA’s staggering earnings have reinforced confidence in the AI-led growth narrative, and the CBOE Volatility Index remaining subdued suggests markets are not in a fear-driven regime.
So… will Santa deliver a rally — or even deliver early?
At the moment, the market appears to be positioning itself towards key Fibonacci retracement levels , creating a favorable setup for a potential Santa rally . If the structure holds, Wave 3/C could be the move where Santa shows up with the goods.
And if the US index does start unwrapping a rally, history suggests Indian markets rarely stay on the sidelines — definitely something to keep on the radar.
Disclaimer: This analysis is for educational purposes only and does not constitute investment advice. Please do your own research (DYOR) before making any trading decisions.

ANGELONE Classical Textbook Elliott waveIf you don't believe, see it yourself
Classical Textbook Elliott wave forming in ANGELONE
Contracting Triangle
Descending
(Top declining, bottom flat)

Nifty further correction?NIFTY – Post-Diagonal Price Behaviour (Daily)
After completing a terminal structure, NIFTY has moved into a corrective phase, which is evident from the current overlapping and range-bound price action. Such behaviour is typical once momentum exhausts near the upper boundary.
The ongoing retracements suggest that the correction is still evolving, and price has not yet reached a point of structural clarity.
At this stage, multiple corrective paths remain open, and directional conviction would be premature.
It is advisable to focus on risk management and confirmation, rather than anticipation, until price resolves this phase.Please like this post if it helps you.follow me to get updates

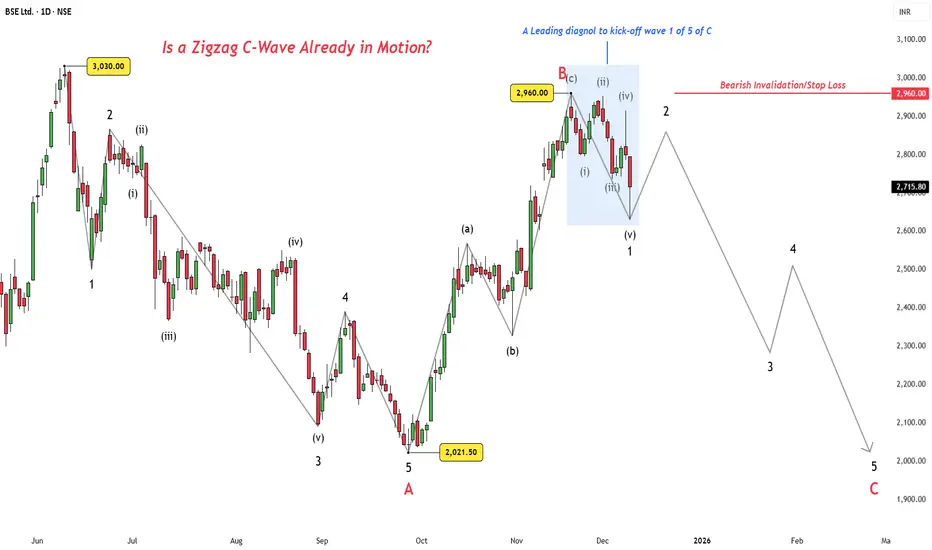
BSE: Wave B Topped, C-Wave Path in FocusContext
BSE looks like it topped out at Wave B, and the price action since then is starting to align with a fresh downside leg.
Wave Count View
Wave A completed in five waves with extended wave 3, Wave B retraced as a controlled three, and the drop from 2960 fits the profile of a leading diagonal for Wave 1 of C.
Bearish Case
As long as 2960 holds, the bias stays firmly on the downside. A proper C-wave should unfold in five legs, and the early structure is already pointing that way.
Conclusion
Momentum favours the bearish interpretation unless the invalidation level is violated. Wave 2 will tell us whether the market wants to continue this decline or flip the script.
Disclaimer: Edu Only. DYOR.
BANKNIFTY : Trading levels and Plan for 17-Dec-2025📘 BANK NIFTY Trading Plan for 17-Dec-2025
Key reference levels (from chart):
Opening Resistance: 59,173
Last Intraday Resistance: 59,257
Major Upside Level: 59,416
Opening Support Zone: 58,958 – 59,043
Last Intraday Support (Buyers Must Try): 58,592 – 58,712
Gap consideration: 200+ points
🟢 1. GAP-UP OPENING (200+ points)
If Bank Nifty opens above 59,173, it directly enters the supply region, where sellers may attempt profit-booking.
🎓 Educational Explanation:
A large gap-up suggests overnight optimism. However, immediate breakout trades are risky because:
Early buyers may exit at resistance
Liquidity is low in the first few minutes
Pullback to retest breakout levels is common
Professional traders always wait for structure confirmation, not emotion-driven entries.
Plan of Action:
Above 59,173, wait for a retest and a bullish candle before considering long entries.
Next target becomes 59,257. Watch for reactions here—this is a key supply zone.
Clear breakout above 59,257 with volume may extend toward 59,416.
Price rejection at 59,257 can create a good pullback trade back toward 59,173.
Option buyers should avoid chasing CE at resistance; wait for dips near retest zones.
🟡 2. FLAT OPENING
A flat open near 59,066 – 59,100 brings Bank Nifty inside the equilibrium zone, where market direction is decided after observing the early order flow.
🎓 Educational Explanation:
In a flat open, price is not influenced by gap sentiment. This is where Opening Range (ORH/ORL) becomes extremely important.
Breakout of ORH = trend strength
Breakdown of ORL = weakness
Avoid guessing direction — let structure form first.
Plan of Action:
If price sustains above 59,100–59,173, buyers may gain control, targeting 59,257.
Rejection from 59,173 can send price back into the Opening Support Zone (58,958–59,043).
If price dips into support and forms bullish rejection (pin bar / engulfing), it becomes a high-probability bounce zone.
Breakdown below 58,958 opens the path to 58,592 – 58,712 support.
🔴 3. GAP-DOWN OPENING (200+ points)
If Bank Nifty opens below 58,900, we enter the fear-zone where sellers may dominate early.
🎓 Educational Explanation:
Gap-downs typically trigger panic selling, but smart traders avoid shorting at the open. Why?
Market often gives a mean reversion bounce
Weak sellers exhaust quickly
Reversal from strong support zones is common
Patience > Speed.
Plan of Action:
First reaction zone: 58,712 – 58,592 (Buyers Must Try) — watch for reversal candles.
If price holds here, expect a recovery back to 58,958–59,043.
Breakdown below 58,592 with strong follow-through = trending bearish session. Avoid catching falling knives.
Any pullback toward 58,712 after breakdown becomes a safe shorting opportunity for option sellers.
⚙️ Risk Management Tips for Option Traders 🛡️
Never buy options within resistance zones—wait for breakout + retest.
For gap openings, avoid trading the first 5–10 minutes; volatility is unnatural.
Keep SL based on structure, not emotions.
Use time-based stop-loss: If your option premium doesn’t move for 15–20 min, exit.
Follow the 1–2% capital rule per trade.
Track IV during gap days—high IV inflates premiums; avoid chasing far OTM options.
🧾 Summary & Conclusion
Gap-Up: Watch 59,173 → 59,257 → 59,416. Avoid chasing; trade break–retest.
Flat Open: Opening Range decides trend; 58,958–59,043 remains the key support.
Gap-Down: Buyers must watch 58,592–58,712 for reversal setups. Breakdown brings deeper weakness.
Successful trading comes from confirmation-based entries, risk control, and not trading emotional spikes.
⚠️ Disclaimer
I am not a SEBI-registered analyst. This analysis is for educational purposes only and should not be considered investment advice. Please consult your financial advisor before taking any market positions.

NIFTY : Trading levels and Plan for 17-Dec-2025📘 NIFTY Trading Plan for 17-Dec-2025
(Based on key levels: 25,953 – 26,011 – 26,111 (resistances) and 25,874 – 25,747 – 25,771 – 25,647 (supports))
Gap criteria considered: 100+ points
🔵 1. GAP-UP OPENING (100+ Points)
If NIFTY opens above 25,953, it directly enters the resistance territory visible on the chart, where the market often tests supply zones.
🔍 Educational Logic:
When the index opens significantly higher, early buyers from the previous session tend to book profits. Hence the market may retest the breakout zone before showing a directional move. Understanding this behaviour prevents traders from chasing breakouts blindly.
Plan of Action:
If price opens above 25,953 and sustains for 15-min, look for long entries toward 26,011.
If 26,011 breaks with volume, expect a momentum push toward 26,111, the major intraday resistance.
A rejection wick or bearish Engulfing pattern at 26,011 = ideal for a small pullback trade back to 25,953.
For option buyers: Prefer CE entries only after a retest & confirmation; avoid buying at resistance.
🟠 2. FLAT OPENING
A flat open near the 25,874–25,880 zone places NIFTY exactly at the Opening Support/Resistance line.
🔍 Educational Logic:
Here the market is neutral, and the first 30 minutes typically decide the trend. The concept of "Opening Range" becomes very important—break of ORH/ORL gives a cleaner directional move. Avoid predicting the direction—wait for confirmation.
Plan of Action:
If price holds above 25,874, buyers may take charge and lead a move toward 25,953.
A breakout above 25,953 can extend quickly toward 26,011.
If NIFTY slips below 25,851, that becomes a weak sign → expect a move toward 25,771–25,747 support zone.
Watch for bullish reversal candle at 25,747–25,771 (buyers must try zone).
🔴 3. GAP-DOWN OPENING (100+ Points)
If NIFTY opens below 25,771, we enter a sentiment-driven weak zone.
🔍 Educational Logic:
Large gap-downs often occur due to overnight negative cues. The initial volatility is usually created by fear-based reactions. A structured trader waits for stability before entering. Many reversals also begin after a gap-down because early sellers exhaust quickly.
Plan of Action:
First support comes at 25,747–25,771 — monitor for a reversal setup.
If price fails to hold this zone, next downside target becomes 25,647, the major support.
A break below 25,647 with strong candles = trending bearish day; avoid bottom-fishing.
If reversal occurs near 25,747, expect a recovery toward 25,851 and later 25,874.
⚙️ Risk Management Tips for Option Traders
📌 These principles protect your capital and sustain long-term trading:
Never buy options at major resistance or support — wait for confirmation.
Follow time-stop: if your option doesn't move in 15–20 minutes despite the index moving, exit.
Maintain a fixed risk: reward of at least 1:2 on every directional trade.
Avoid trading in the first 5 minutes during 100+ point gaps — volatility is artificially high.
Define your loss level before entering; never widen your SL emotionally.
Scale-in only after the trade moves in your favour, not before.
🧾 Summary & Conclusion
A Gap-Up above 25,953 demands patience for a retest before long entries.
A Flat Open near 25,874 is a neutral scenario — rely on Opening Range breakout.
A Gap-Down below 25,771 invites caution; watch for reversal patterns at support zones.
Market structure is more important than prediction. Stick to confirmation-based entries and disciplined exits.
For option buyers, momentum zones and retest confirmations are crucial for high-quality trades.
⚠️ Disclaimer
I am not a SEBI-registered analyst. This trading plan is for educational purposes only and should not be considered financial advice. Please consult your financial advisor before making trading decisions.

NAS100 Preparing for Wave 3 Rally After Healthy PullbackThe NAS100 chart shows that a larger corrective move has likely finished at the (Y) / C low, after which price started a new upward impulsive structure. The recent decline looks like a normal Wave 2 pullback, which has already reacted from the 0.5–0.618 Fibonacci support zone, a common area for corrections to end. This suggests buyers are stepping back in and the market is preparing for Wave 3, which is usually the strongest upward move. As long as price stays above the invalidation level near 23,836, the bullish Elliott Wave setup remains valid. Overall, the structure favors further upside toward new highs once Wave 3 gains momentum.
Stay tuned!
@Money_Dictators
Thank you :)

Clean Trendline Respect on Weekly Chart – 500 DaysPattern Context
Price has been respecting a well-defined descending trendline on the weekly timeframe, with each rally stalling below the previous swing high and reinforcing the broader lower‑high, lower‑low sequence.
Candlestick Behavior
Showing how supply continues to respond at the same diagonal zone. This reaction visually confirms how aggressively the market has been defending the pattern’s upper boundary without implying what comes next, keeping the focus strictly on how price has behaved historically around this line.
Observational Takeaway
This chart serves as a clear example of how a simple, clean trendline can organize price behavior over multiple months and frame where participation repeatedly shifts. The emphasis here is on observing how consistently the structure has been respected and how each touch has shaped the ongoing sequence, allowing traders to study price interaction with a dominant trend rather than anticipate future outcomes.
Disclaimer
This post is for educational and informational purposes only and is not investment advice, stock tips, or a recommendation to buy or sell any security. Readers should do their own research, consider their personal risk tolerance, and consult a registered financial professional if needed before making any trading or investment decisions.
Crude oil break trand line lowerI think this is bounce back time this pattern all time repet 2021 to 2024 oct , nov dec down jan go gap next 3 candle is go up side next target and liquid is 5400,5600,6000 .

Elliott Wave Analysis XAUUSD – December 16, 2025
1. Momentum
D1 (Daily):
Daily momentum is showing signs of a bearish reversal. However, we must wait for today’s D1 candle to close to confirm this signal. This is a critical confirmation, as it will determine whether the market has formed a medium-term top.
H4:
H4 momentum is currently in the oversold zone and is preparing for a bullish reversal. Once confirmed, we can expect a technical rebound lasting approximately 4–5 H4 candles.
H1:
H1 momentum remains bearish and is moving toward the oversold area. We will wait for price to reach oversold conditions and for momentum to confirm a bullish reversal, which would signal a short-term H1 corrective rally.
---
2. Elliott Wave Structure
D1:
With D1 momentum turning down, if today’s daily candle confirms the reversal, price is likely forming the top of the purple wave X. After wave X completes, the market may enter purple wave Y, which is most likely developing as a Flat correction.
→ The projected target for wave Y is near the 3888 zone.
H4:
Price is currently trading within green wave 5. Once this wave 5 completes, it will also mark the completion of wave C and wave X on the higher timeframe.
Given that H4 momentum is oversold, a short-term upward move is expected before the broader structure completes.
H1:
The current decline is likely forming a red 1–2–3–4–5 structure within green wave 5. At this stage, price is developing red wave 4.
This red wave 4 is unfolding as a Flat corrective structure, consistent with the scenario outlined in yesterday’s plan.
Target for red wave C: around 4260
Above this level, 4274 represents a high-liquidity / low-liquidity boundary
Therefore, when price reaches the 4260–4274 zone, we will combine this area with H1 momentum bullish confirmation to look for long entries.
Expected targets for red wave 5:
Target 1: 4365
Target 2: 4393
3. Key Notes
As discussed in previous plans, the recent rebound did not reach the 4353 level. This does not invalidate the scenario in which green wave 5 completes near this area (refer to the weekly plan).
Therefore, if:
D1 momentum confirms a bearish reversal at today’s close, and
The upcoming H4 rebound fails to break above 4353,
→ We must be prepared for the scenario in which purple wave Y on the D1 timeframe has already begun.
4. Trading Plan
Buy Zone: 4261 – 4259
Stop Loss: 4240
Take Profit 1: 4286
Take Profit 2: 4319
Take Profit 3: 4365

Gold 1H – NFP in Control: 4355 Cap or 4260 Hold?🟡 XAUUSD – Intraday Smart Money Plan | by Ryan_TitanTrader (16/12)
📈 Market Context
Gold is trading inside a high-volatility liquidity environment as markets digest the NFP Preview: Rate Path Divergence & Implications for DXY and Gold.
With the upcoming U.S. labor data set to shape expectations for the Fed’s 2026 rate path, USD flows remain unstable. Any surprise in employment or wage components could trigger sharp repricing in rate-cut expectations, directly impacting gold through DXY volatility.
In this context, institutions are unlikely to commit direction early. Instead, liquidity engineering and stop-hunts around key premium/discount zones are favored ahead of true displacement.
🔎 Technical Framework – Smart Money Structure (1H)
Current Phase: Post-expansion, now rotating inside a rising channel and pausing near equilibrium
Key Idea: Expect a liquidity sweep into premium (4353–4355) or discount (4262–4260) before the next impulsive move
Structural Notes:
• Prior BOS confirms bullish higher-timeframe context
• Recent pullback signals profit-taking, not full reversal
• Equal highs above 4350 and sell-side liquidity below 4260 are clearly exposed
Liquidity Zones & Triggers:
• 🔴 SELL GOLD 4353 – 4355 | SL 4363
• 🟢 BUY GOLD 4262 – 4260 | SL 4272
Institutional Flow Expectation:
sweep → MSS / CHoCH → BOS → displacement → FVG / OB retest → expansion
🎯 Execution Rules (matching your exact zones)
🔴 SELL GOLD 4353 – 4355 | SL 4363
Rules:
✔ Liquidity sweep above recent highs into premium
✔ Bearish MSS / CHoCH on M5–M15
✔ Downside BOS with strong bearish displacement
✔ Entry via bearish FVG refill or refined supply OB
Targets:
1. 4325
2. 4300
3. 4285 – extension if momentum accelerates
🟢 BUY GOLD 4262 – 4260 | SL 4272
Rules:
✔ Liquidity grab below equal lows / channel support
✔ Bullish MSS / CHoCH confirms demand takeover
✔ Upside BOS with impulsive displacement
✔ Entry via bullish FVG fill or demand OB retest
Targets:
1. 4280
2. 4310
3. 4350 – extension if USD weakens post-data
⚠️ Risk Notes
• NFP-related positioning can cause false breaks — wait for structure, not the first spike
• Avoid trades without clear MSS + BOS confirmation
• Expect spreads and volatility to expand during U.S. sessions
• Reduce risk if entering close to news releases
📍 Summary
Today’s gold narrative is driven by NFP-led rate path uncertainty:
• A sweep into 4355 may invite bearish structure back toward 4300–4285
or
• A liquidity grab near 4260 could reload bullish flow toward 4310–4350
Let structure confirm — Smart Money reacts, retail anticipates. ⚡️
📌 Follow @Ryan_TitanTrader for daily Smart Money gold breakdowns.

S&P 500 – Structural Roadmap & Macro ContextIntroduction
The S&P 500 remains one of the most important global risk benchmarks, influencing capital flows, sentiment, and cross-asset behavior.
This analysis focuses on the structural and wave-based framework of the index, shared strictly for macro context and market understanding, not for short-term trading or execution.
Key Observations
1. Wave Structure (The Roadmap)
The index has respected its broader Elliott Wave structure well. The recent dip toward the 6,600 zone appears to have completed the corrective Wave (4) (Blue), aligning precisely with the lower boundary of the rising channel.
Price behavior since then suggests the market is transitioning into the early phase of Wave (5) — typically the final bullish leg of the cycle, subject to continued structural validation.
On the internal degree, the market appears to have completed a short-term 1–2 setup, with price beginning to initiate a potential Wave 3 extension within Wave (5).
2. Key Support Zones (The Floor)
6,600 – Structural support and Wave (4) low, aligned with channel support
Invalidation Level: A daily close below 6,500 would invalidate this specific wave interpretation and require reassessment
The bounce from this zone reinforces the bullish structural framework.
3. Key Resistance & Reference Targets
6,925 – 6,985: Immediate resistance zone (previous highs)
7,497: Projection zone for the developing internal wave extension
7,734 – 7,900: Broader reference zone for Wave (5) completion, based on channel and wave projections
These levels act as structural reference zones, not execution targets.
4. RSI and Momentum
RSI (Daily): ~49.75
Momentum has reset to neutral territory, neither overbought nor exhausted. Historically, such conditions allow room for trend continuation without immediate momentum constraints.
5. My Final View
The primary trend remains bullish, with the recent correction appearing mature rather than trend-breaking.
View: Structure favors continuation over reversal
Approach: Trend-following bias rather than counter-trend positioning
Risk Note: Structural validity holds as long as price remains above channel support
Disclaimer
This analysis is shared strictly for educational and macro-structural purposes.
It does not constitute trading advice or investment recommendations. Always apply appropriate risk management.
#SP500
#SPX
#USMarkets
#MacroAnalysis
#MarketStructure
#GlobalMarkets
#IntermarketAnalysis
#RiskSentiment
#TechnicalAnalysis
#TradingView

Part 3 Learn Institutional Trading Spread Strategies (Risk-Defined Trades)
Spread strategies reduce risk by combining buy and sell options.
Bull Call Spread
Concept: Buy lower strike call + Sell higher strike call.
Profit: Limited
Risk: Limited
Best Market Condition: Moderate uptrend
Benefit:
Lower cost than buying a naked call.

US Dollar Index (DXY / USDX) – Long-Term Structure & Macro ConteUS Dollar Index (DXY / USDX) – Long-Term Structure & Macro Context
Introduction
The US Dollar Index (DXY) plays a central role in shaping global liquidity, commodity cycles, and risk sentiment.
This analysis focuses on the long-term structural framework of the Dollar and is intended strictly for macro and inter-market context, not for FX trading or execution.
Key Observations
1. Wave Structure (Structural Transition Phase)
The Grand Super Cycle peak near 114.78 marked a major long-term resistance zone. Since that high, price behaviour suggests the Dollar has transitioned into a broader corrective regime, consistent with an A-B-C type structure.
The initial decline (Wave A) and subsequent relief rally (Wave B) appear mature. The current price action exhibits characteristics of a developing Wave C, though confirmation depends on sustained acceptance below key structural supports.
This phase reflects trend digestion rather than a sudden collapse.
2. Key Resistance Zones (The Ceiling)
105.00 – 107.00 remains the dominant lower-high resistance zone.
As long as price remains below this band, the broader bias stays corrective / bearish.
The rejection and breakdown from recent consolidation further indicate that upside strength is limited at this stage.
3. Key Support & Reference Zones (The Floor)
96.73 – Immediate structural support within the corrective channel
91.55 – Intermediate psychological and structural support
87.55 – 83.64 – Major corrective reference zone, aligned with long-term trendline support
This lower zone represents a high-importance area where the correction could mature, not a guaranteed destination.
4. RSI & Momentum Perspective
Monthly RSI has slipped below the neutral 50 zone, confirming loss of long-term upside momentum.
The absence of bullish divergence suggests downside pressure may persist, though momentum should be monitored closely as price approaches major support regions.
5. Final View (Macro & Inter-Market Context)
The US Dollar Index appears to be entering a medium- to long-term corrective phase following an extended secular advance. While the broader structural framework remains intact, upside progress is likely to remain uneven and selective.
Historically, sustained Dollar weakness acts as a tailwind for commodities and selective risk assets. DXY should therefore be used as a confirmation tool rather than a standalone directional instrument.
If the corrective structure continues to unfold, the 87–84 region becomes a logical medium-term reference zone over the coming quarters.
Inter-Market Implication
Supportive for Gold & Silver
Constructive for Copper & Base Metals
Positive confirmation for risk assets, when aligned with structure
Disclaimer
This analysis is shared strictly for educational and macro-advisory purposes.
It does not constitute FX trading advice, execution guidance, or investment recommendations.

Exit the rallyRBL Bank CMP 299.20
Elliott- the entire rally is a zig zag corrective pattern and is complete.
Fib - the rally to 38.2% is weakness.
Conclusion - generally wave A and wave C of the zig zag are equal. Hence to me this rally is over and is an opportunity to exit.

Nifty Analysis for Dec 16, 2025Wrap-up:
As predicted Nifty achieved its wave 2 target at 25904 and now, heading towards its 3.
What I’m Watching for Dec 16, 2025 🔍
Sell Nifty if it breaks 26013 sl 26047 for a target of 25947-25959.
and, Buy nifty if it comes near 25947-25959 sl 25904 or if it does not come then buy above 26025 SL 26013 for a target of 26149-26174.
Disclaimer: Sharing my personal market view — only for educational purpose not financial advice.

Part 2 Ride The Big Moves Iron Condor Strategy
Concept: Combination of bull put spread + bear call spread.
Profit: Limited
Risk: Limited
Best Market Condition: Range-bound market
Use Case:
Preferred by professional traders due to defined risk.

Part 1 Ride The Big Moves Short Strangle Strategy
Concept: Sell out-of-the-money Call and Put.
Profit: Premium
Risk: Unlimited
Best Market Condition: Sideways market with limited range
Advantage over Straddle:
Lower margin and lower risk compared to straddle.
