12 Dec 2025 - Nifty playing with our emotions, breaking out?Nifty Stance Bullish 🐂
Five consecutive stop loss hits, and everything is in place to play with the emotions of a professional trader. Remember the beautiful one-way journey in October? November and December are nothing like that, and that is quite usually so. Whenever Nifty goes raging in a month, it consolidates for a month or two so that the fundamentals can catch up.
After the last EMA crossover, we are long and expecting Nifty to stay close to 26200 in the current weekly series. And if we do not run into another stop loss, we expect Nifty to break past 26600 over the week after that.
As you all know, we have no more resistance left, so it should be a quick and smooth journey to the top; the only hindrances could be the bad news, which could creep in at any moment. The India-US trade deal is still in play and could create ample choppiness.
Wave Analysis

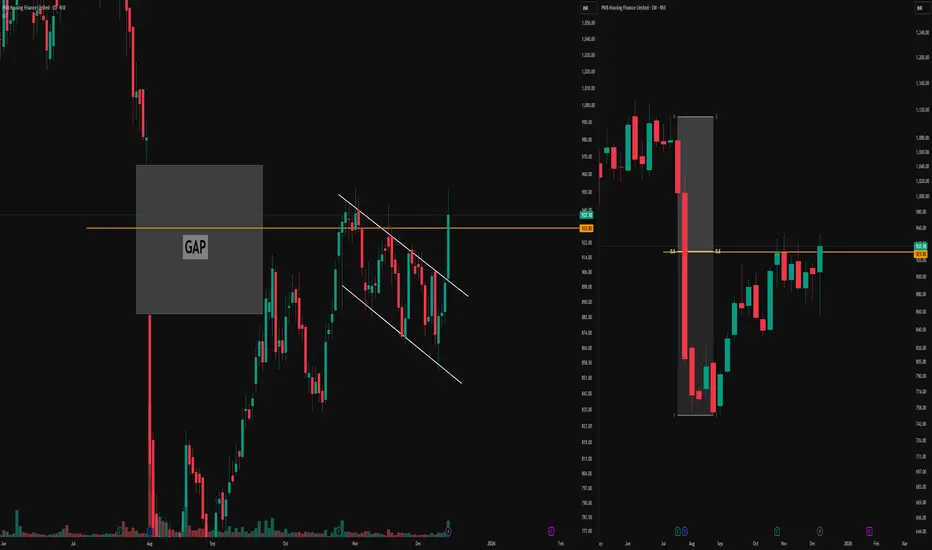
Parallel Channel, Stubborn Gap & 0.5 Equilibrium RejectionDaily Timeframe Details
The left chart on the daily timeframe displays a parallel channel structure forming after an initial one-sided move.
A significant gap emerged within this leg, which price has approached multiple times—first entering the gap area from below but rejecting sharply to form a higher low, then pushing toward a higher high without fully filling it.
This illustrates how gaps often resist easy fills from either direction, acting as persistent reference zones that demand confluence for interaction.
Weekly Timeframe Context
The right chart provides the weekly timeframe for the same instrument, highlighting repeated rejections at the 0.5 equilibrium level.
These weekly rejections align precisely with the daily gap interactions and channel boundaries, demonstrating how higher-timeframe equilibrium can underpin lower-timeframe price behavior without implying direction.
Such multi-timeframe alignment offers educational insight into structural references in market analysis.
This post serves purely educational and observational purposes and does not constitute buy, sell, or investment advice. Always conduct your own research.
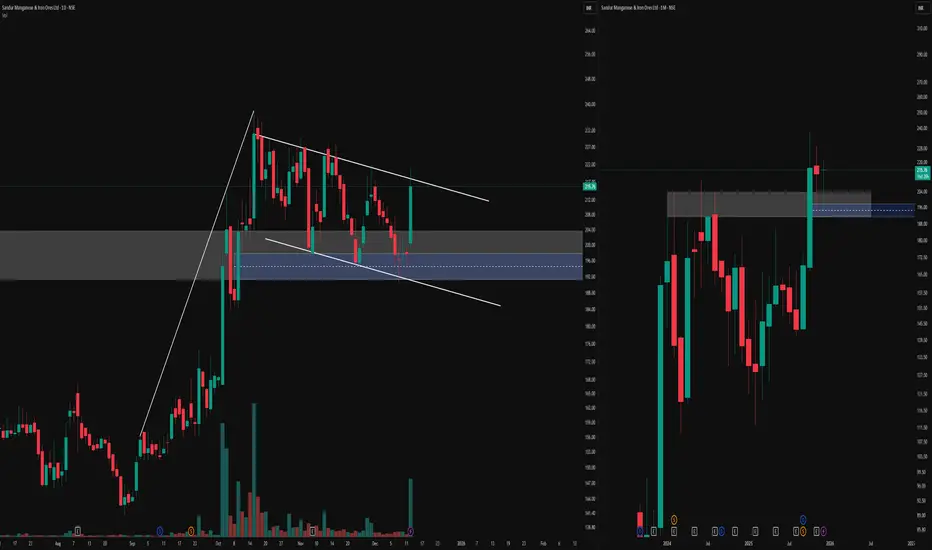
Multi‑Timeframe Flag & Fair Value Gap ObservationOn the left, the daily timeframe is highlighting a potential flag‑and‑pole structure after a strong one‑sided move.
Within this leg, a blue fair value gap has been marked, which price has interacted with multiple times, illustrating how an imbalanced area can act as a reference zone over time.
On the right, the monthly timeframe of the same instrument is added to provide broader structural context to the daily pattern.
This multi‑timeframe layout is meant purely to show how a lower‑timeframe pattern and an identified fair value gap can be viewed alongside the higher‑timeframe trend without attaching any directional bias.
Disclaimer: This post is for educational and illustrative purposes only and does not constitute investment, trading, or financial advice. Always do your own research and consult a registered financial professional before making any trading decisions.
Seeing vs Believing: Multi-Pattern Structure vs Single-Line BOOn the left, the weekly chart is mapped as a full A+ type setup, where multiple structural elements work together instead of relying on a single, convenient line.
-A red counter trendline marks a series of lower-high rejection points, visually defining the “least liquidity” supply line that price has repeatedly respected.
-A dotted parallel channel outlines a broader multi-pattern context.
-A dashed hidden line adds another layer of structure, hinting at less obvious inflection zones that are not visible at first glance but often align with prior reactions.
-Finally, an orange line represents a higher time frame resistance level, bringing in a top-down perspective so that the current weekly price action is seen in relation to a dominant, bigger-picture barrier.
On the right, by contrast, the chart is reduced to a single white line drawn in a way that “forces” the candles to appear as if they are breaking out.
This is a great example of chart psychology in action: instead of objectively mapping all relevant patterns, many traders draw what they want to see—one clean breakout line—ignoring hidden structures, multi-timeframe confluence, and complex pattern overlap.
The intention of this post is purely observational and educational, not forecasting.
It aims to show how a professional, multi-pattern approach (CT lines, channels, hidden lines, and higher timeframe levels) can radically change the way a chart is interpreted compared to the simplistic, single-line breakout mindset that dominates retail thinking.
Disclaimer: This post is for educational and illustrative purposes only and does not constitute investment, trading, or financial advice. Always do your own research and consult a registered financial professional before making any trading decisions.

Bitcoin - Elliott Wave Analysis - weekly TFHallo crypto traders bitcoin completed Expanding leading diagonal pattern in grand super cycle degree now in correction phase so wait for long fib ret 61.8% level then big move starts (wave 3)

FLAIR LONGThe Elliott Wave Theory's description of the structure and pattern of price movements in financial markets is known as the Elliott Wave Structure.
The Elliott Wave analysis indicates that the stock has completed waves (i),(ii), (iii), and (iv), which are shown as blue numbers on the daily chart. Wave (v) appears to be underway at this time.
It is anticipated that wave (v) will have about five subdivisions shown in red colour.
Wave i and ii in red colour of wave (v) is completed and wave iii in red colour is unfolding.
Wave levels shown on chart.
Level of Invalidation
The Wave (i) has been identified as the invalidation level at 289.9 because wave (iv) do not enter in the wave(i). If the price falls below this level, it can indicate that the expected Elliott Wave pattern is not as it seems.
I am not a registered Sebi analyst. My research is being done only for academic interests.
Please speak with your financial advisor before trading or making any investments. I take no responsibility whatsoever for your gains or losses.
Regards
Dr Vineet

" NAUKRI " consolidation range will break on this week" NAUKRI " consolidation range will break on this week, and i hope this stock will reach to 1750/- by Aprile 2026. thanks

Part 7 Trading Master ClassIntermediate Strategies
1. Bull Call Spread
Buying a call at a lower strike and selling another at a higher strike. This reduces cost but limits maximum profit.
2. Bear Put Spread
Buying a higher strike put and selling a lower strike put. It profits from moderate downside movement with controlled risk.
3. Straddle
Buying a call and a put at the same strike and expiry. This strategy profits from high volatility regardless of direction.
4. Strangle
Similar to a straddle but uses different strike prices, making it cheaper but requiring larger price movement.

Retail Trading vs Institutional Trading1. Who Are Retail Traders?
Retail traders are individual participants who trade financial instruments such as stocks, commodities, forex, cryptocurrencies, or derivatives using their own capital. They usually trade through online brokerage platforms and operate independently.
Key Characteristics of Retail Trading
Capital Size: Small to medium. Most retail traders trade with limited funds compared to institutions.
Access to Markets: Via discount brokers, trading apps, and online platforms.
Decision Making: Personal judgment, often influenced by technical analysis, news, social media, and market sentiment.
Time Horizon: Ranges from intraday trading to long-term investing.
Technology: Basic charting tools, indicators, and retail-level analytics.
Retail trading has grown rapidly due to easy internet access, low brokerage fees, mobile trading apps, and financial education available through online platforms.
2. Who Are Institutional Traders?
Institutional traders are large organizations that trade on behalf of clients or for their own accounts. These include mutual funds, hedge funds, pension funds, insurance companies, banks, proprietary trading firms, and foreign institutional investors (FIIs).
Key Characteristics of Institutional Trading
Capital Size: Very large, often running into millions or billions.
Access to Markets: Direct market access (DMA), dark pools, and over-the-counter (OTC) markets.
Decision Making: Team-based, involving analysts, economists, risk managers, and traders.
Time Horizon: From high-frequency trading (milliseconds) to long-term investing (years).
Technology: Advanced algorithms, high-frequency trading systems, AI models, and proprietary data.
Institutions are the dominant force in most financial markets and are responsible for the majority of trading volume.
3. Capital and Position Size Differences
One of the most significant differences between retail and institutional trading is capital size.
Retail traders typically trade small quantities due to limited funds and higher risk exposure.
Institutional traders trade in large volumes, which can influence price movements, liquidity, and volatility.
Because of their size, institutions must be careful when entering or exiting positions. They often break large orders into smaller ones to avoid moving the market too aggressively, a process known as order slicing.
4. Information and Research Access
Retail Traders
Depend on publicly available information: news, earnings reports, charts, and social media.
Use standard indicators like RSI, MACD, moving averages, and candlestick patterns.
Often react to market news after it becomes public.
Institutional Traders
Have access to deep research, including industry reports, macroeconomic models, and company management interactions.
Employ dedicated research teams and sometimes alternative data such as satellite data, supply chain analysis, or consumer behavior data.
Can anticipate trends earlier due to superior information processing.
This information asymmetry gives institutions a strong edge over retail participants.
5. Trading Strategies and Styles
Retail Trading Strategies
Intraday trading
Swing trading
Positional trading
Options buying (calls and puts)
Momentum and breakout strategies
Retail traders often focus on short-term price movements and technical patterns. Emotional decision-making and overtrading are common challenges.
Institutional Trading Strategies
Long-term portfolio allocation
Arbitrage strategies
Statistical and quantitative trading
Market making
Hedging using derivatives
High-frequency trading (HFT)
Institutions focus heavily on risk-adjusted returns, diversification, and consistency rather than frequent speculative trades.
6. Risk Management Practices
Risk management is another major area of difference.
Retail traders often risk a large percentage of their capital on single trades, sometimes due to lack of discipline or experience.
Institutional traders follow strict risk management rules, including position limits, stop-loss frameworks, portfolio diversification, and regulatory compliance.
Institutions prioritize capital preservation, whereas many retail traders focus primarily on profit, sometimes ignoring downside risk.
7. Emotional vs Systematic Trading
Retail traders are more prone to:
Fear and greed
Revenge trading
Overconfidence after wins
Panic during drawdowns
Institutional trading is largely systematic and rule-based. Decisions are backed by models, committees, and predefined rules, reducing emotional bias.
This psychological discipline is a major reason institutions outperform most retail traders over the long term.
8. Market Impact and Liquidity
Retail traders usually have negligible market impact due to small trade sizes. Their trades rarely move prices significantly.
Institutional traders, on the other hand:
Create liquidity in some cases (market makers).
Cause sharp price movements when large orders hit the market.
Influence trends, breakouts, and major support-resistance levels.
Many price movements that retail traders react to are actually initiated by institutional activity.
9. Costs, Fees, and Execution
Retail traders:
Pay brokerage fees, taxes, and slippage.
Often experience slower execution and wider spreads.
Institutional traders:
Enjoy lower transaction costs due to high volumes.
Get better execution quality and tighter spreads.
Use smart order routing to minimize costs.
Lower costs significantly improve institutional profitability over time.
10. Regulatory Environment
Institutional traders operate under strict regulatory oversight, including reporting requirements, compliance audits, and risk disclosures.
Retail traders face fewer regulations but also have fewer protections in terms of information and execution advantages.
11. Why Retail Traders Often Lose
Studies across global markets show that a large percentage of retail traders lose money. Key reasons include:
Lack of education and realistic expectations
Poor risk management
Emotional trading
Overtrading
Competing against well-capitalized institutions
This does not mean retail traders cannot succeed, but success requires discipline, patience, and continuous learning.
12. How Retail Traders Can Compete Smarter
Retail traders can improve their chances by:
Following institutional footprints like volume, open interest, and price action
Focusing on risk management over profits
Trading fewer, high-quality setups
Avoiding excessive leverage
Aligning trades with higher-timeframe trends
Instead of fighting institutions, smart retail traders try to trade alongside institutional direction.
Conclusion
Retail trading and institutional trading operate in the same markets but under vastly different conditions. Retail traders bring flexibility, speed, and independence, while institutional traders dominate with capital, technology, research, and discipline. Markets are largely shaped by institutional behavior, and retail traders who understand this dynamic stand a better chance of survival and success.

HINDALCO – Weekly Chart | Long-Term Bull Market IntactHindalco continues to trade within a structural long-term bull market on the weekly timeframe.
The advance from the 2020 low unfolded as a clear impulsive sequence, with an early leading diagonal followed by a strong trend phase. The recent decline appears corrective in nature and has respected key Fibonacci and structural supports.
Price has rebounded from the 0.236 retracement (~₹788), suggesting the larger trend remains intact. As long as this level holds on a weekly closing basis, the probability favors continuation toward higher wave targets.
The current structure indicates we may be in the later stages of a corrective phase, preparing for the next impulsive leg in the broader cycle. Any short-term pullbacks should be viewed in the context of a buy-on-dips market, not trend reversal.
Key levels to watch:
Support: ₹780–800 (weekly)
Resistance: ₹900+, then ₹1,020–1,200 zone in the higher timeframe
Trend remains bullish unless the weekly structure breaks.
Elliott Wave analysis | Educational view, Please like this post if it helps you.Folloe me to get updates

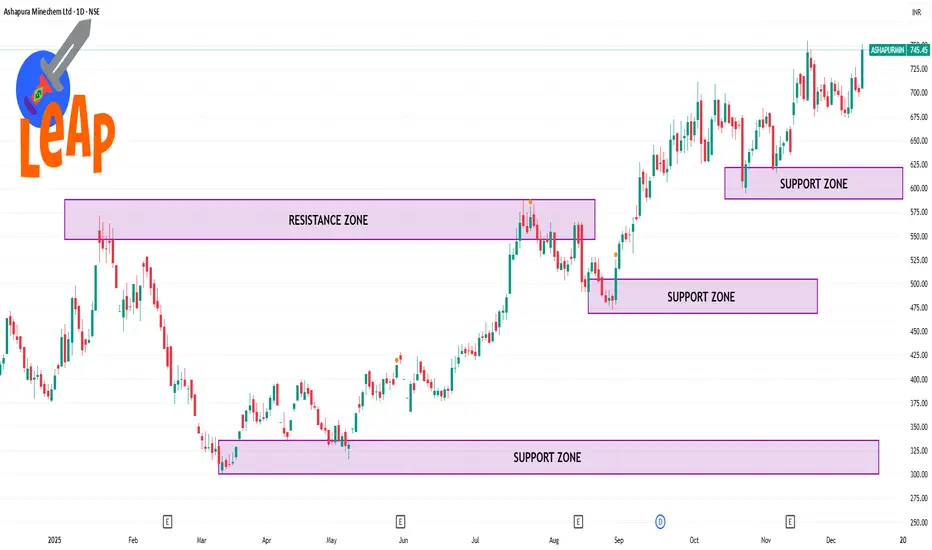
ASHAPURMIN 1 Day Time Frame 📌 Current Live Price (Daily)
Approx ₹745.4 on NSE at latest available update.
This reflects the recent trading session where the stock moved between ~₹705 (low) and ~₹751 (high) before settling near ₹745.45.
📊 Daily Technical Levels (Pivot / Support / Resistance)
🔹 Pivot Point Levels (based on yesterday’s range)
(These can be used for today’s intraday bias)
Daily Pivot: ~₹733.8
Support 1: ~ ₹716.6
Support 2: ~ ₹687.8
Support 3: ~ ₹670.6
Resistance 1: ~ ₹762.6
Resistance 2: ~ ₹779.8
Resistance 3: ~ ₹808.6
(Classic pivot method daily)

Option Trading Strategies Basic Directional Option Strategies
1.1 Long Call Strategy
A long call involves buying a call option with the expectation that the underlying asset will rise significantly before expiration.
Market View: Bullish
Risk: Limited to premium paid
Reward: Unlimited
Best Used When: Strong upward momentum is expected
This strategy benefits from rising prices and increasing volatility. Time decay works against the buyer, so timing is crucial.
1.2 Long Put Strategy
A long put involves buying a put option expecting the price to fall sharply.
Market View: Bearish
Risk: Limited to premium paid
Reward: Substantial if price falls sharply
Best Used When: Strong downtrend or breakdown expected
Long puts are also used as insurance against falling markets.

Gold Forecast Weekly (Updated)Hallo investors / traders gold trend bullish now may be this Extended wave 13th wave competed possible at April 6-10 in 2026 Price reaching 5150 - 5450 level so go long as now best buy at 4100-4050 level risk reward is good 1:3 Happy Trading Journey

Volatility Index Trading: Understanding and Strategies1. Introduction to the Volatility Index
A volatility index, commonly known as the VIX, is often referred to as the “fear gauge” of the market. It measures the expected price fluctuation of a stock market index over a specific period, usually 30 days. For instance, the most widely recognized VIX is the CBOE Volatility Index, which tracks the implied volatility of the S&P 500 index options.
Implied volatility is derived from option prices and reflects the market’s expectations of future market movements rather than historical price changes. When markets are calm, the VIX tends to be low, suggesting minimal expected price swings. Conversely, during periods of market stress, uncertainty, or geopolitical tension, the VIX often spikes, signaling heightened investor fear.
The concept of trading the volatility index appeals to investors because it provides opportunities to profit in both rising and falling markets, especially during high volatility periods when traditional strategies may struggle.
2. How Volatility Index Trading Works
Unlike conventional assets, the volatility index is not directly tradable. Traders cannot buy or sell the VIX itself; instead, they use derivative instruments such as futures, options, and exchange-traded products (ETPs) based on the VIX.
VIX Futures: These are contracts that speculate on the future value of the VIX. Each futures contract has an expiration date, and traders can profit from changes in the VIX level. The futures market allows for hedging and speculation in anticipation of market turbulence.
VIX Options: Similar to options on stocks or indices, VIX options give traders the right, but not the obligation, to buy or sell VIX futures at a predetermined strike price. Options offer flexibility to construct sophisticated strategies, including spreads and hedges against market downturns.
Exchange-Traded Products (ETPs): ETPs, such as VIX ETFs and ETNs, provide exposure to the volatility index without directly trading futures. These instruments are popular among retail investors due to their accessibility and simplified trading mechanics.
3. Characteristics of Volatility Trading
Volatility trading has unique characteristics that differentiate it from traditional asset trading:
Inverse Correlation with Equities: Typically, the VIX rises when stock markets fall and decreases when markets are bullish. This negative correlation allows traders to use the VIX as a hedge against market downturns.
Mean-Reverting Nature: The VIX generally exhibits mean-reverting behavior, meaning extreme spikes or dips tend to normalize over time. Traders often use this feature to design strategies that anticipate the index returning to its average level.
High Sensitivity to Market News: Economic data releases, central bank policies, geopolitical conflicts, and corporate earnings can trigger rapid VIX movements. Traders must stay informed to capture opportunities effectively.
Time Decay in Derivatives: Since VIX derivatives are tied to futures contracts, the value of options and ETPs is affected by contango (when future prices are higher than the spot) or backwardation (when future prices are lower). Understanding this is crucial for timing trades.
4. Common VIX Trading Strategies
Volatility index trading requires specialized strategies, as it behaves differently from equities. Here are several popular approaches:
a) Hedging Strategies
Investors use VIX instruments to protect their portfolios from sudden market declines. By taking a long position in VIX futures or ETFs, traders can offset losses in equities during market crashes. This is particularly effective for institutional investors holding large stock positions.
b) Directional Trading
Traders can take positions based on anticipated market volatility:
Long Volatility: Buy VIX futures or options expecting an increase in market volatility, often during economic uncertainty or political events.
Short Volatility: Sell VIX derivatives anticipating low volatility or market stability, profiting from premium decay.
c) Spread Strategies
Traders often use calendar spreads and straddles to exploit VIX volatility patterns:
Calendar Spread: Buying a longer-dated VIX future while selling a shorter-dated one to benefit from convergence or divergence in contract prices.
Straddle/Strangle: Buying options with the same strike (straddle) or different strikes (strangle) to profit from significant volatility swings, regardless of direction.
d) Mean Reversion Plays
Since the VIX is mean-reverting, traders may buy when the index is unusually low and sell when it spikes excessively. Technical analysis indicators like Bollinger Bands or moving averages are commonly applied to identify entry and exit points.
5. Advantages of VIX Trading
Diversification: VIX derivatives allow investors to diversify portfolios beyond traditional asset classes.
Risk Management: Provides an effective hedge against market downturns.
Profit in Bear Markets: Unlike long-only equity strategies, VIX trading offers profit potential even when markets decline.
Leverage Opportunities: Futures and options allow for amplified returns, although with increased risk.
6. Risks in Volatility Index Trading
Despite its benefits, trading the VIX carries significant risks:
Complexity: Derivatives on volatility are highly complex and require deep understanding of futures markets and options pricing.
Time Decay and Roll Costs: Long-term VIX strategies may incur costs due to contango and options’ theta decay.
Rapid Price Swings: The VIX can spike dramatically in minutes due to news or market panic, leading to sudden losses.
Liquidity Issues: Some VIX derivatives may have lower liquidity compared to underlying equity markets, affecting trade execution.
7. Tools and Analysis Techniques
Successful VIX trading relies on a combination of technical analysis, fundamental insights, and sentiment monitoring:
Technical Indicators: Moving averages, Bollinger Bands, RSI, and Fibonacci levels help identify mean-reversion points and breakout signals.
Macro Analysis: Monitoring interest rates, inflation, central bank announcements, and global events provides context for expected volatility.
Market Sentiment: Tracking option volumes, put-call ratios, and equity flows gives insight into fear or complacency levels among investors.
8. Practical Considerations
Before entering VIX trading, investors should:
Understand Derivative Mechanics: Ensure familiarity with futures contracts, option greeks, and leverage.
Set Risk Management Rules: Use stop-losses, position sizing, and diversification to manage extreme market swings.
Stay Updated: Monitor economic calendars, geopolitical news, and market sentiment indicators.
Start Small: Begin with limited positions in ETFs or options before scaling to larger futures trades.
9. Conclusion
Volatility index trading represents a sophisticated approach to financial markets, offering opportunities to hedge risk, diversify portfolios, and profit from market uncertainty. While the VIX does not trade like conventional assets, futures, options, and ETPs provide avenues for speculation and risk management. Its unique characteristics, such as negative correlation with equities, mean-reversion tendencies, and sensitivity to macro events, make it both an attractive and challenging instrument.
Traders must combine technical and fundamental analysis with disciplined risk management to navigate VIX trading effectively. Those who master it gain a powerful tool to capitalize on market volatility and protect their investments during periods of uncertainty.
In essence, VIX trading is not just a speculative activity—it is a strategic approach to understanding and navigating the psychology of the markets, turning fear into opportunity.

Index Rebalancing Impact 1. What Is Index Rebalancing?
An index is a benchmark that tracks the performance of a selected group of securities, such as the Nifty 50, Sensex, S&P 500, or MSCI indices. Each index follows predefined rules regarding:
Number of constituents
Eligibility criteria (market capitalization, liquidity, free float)
Weighting methodology (market-cap weighted, equal-weighted, factor-based)
Index rebalancing occurs at regular intervals—quarterly, semi-annually, or annually—when the index provider reviews and updates its constituents and weights. Stocks may be added, removed, or reweighted based on changes in market capitalization, liquidity, corporate actions, or methodology updates.
2. Why Index Rebalancing Is Necessary
Markets are dynamic. Company valuations, liquidity profiles, and business fundamentals change over time. Without rebalancing, an index could become outdated or misrepresentative. Rebalancing ensures:
The index remains aligned with its objective
Accurate representation of the market or sector
Consistency and credibility for benchmark users
For example, if a fast-growing company’s market cap increases significantly, its index weight must rise. Conversely, declining or illiquid companies may be removed.
3. Role of Passive Investing in Rebalancing Impact
The rise of passive investing has dramatically increased the importance of index rebalancing. Exchange-Traded Funds (ETFs), index mutual funds, and pension funds replicate indices mechanically. When an index changes, these funds must buy or sell stocks to match the new composition—regardless of price or fundamentals.
This forced buying and selling creates predictable demand and supply shocks, leading to:
Sudden price movements
Volume spikes
Temporary mispricing
As passive assets grow, rebalancing effects have become stronger and more visible.
4. Impact on Stock Prices
a) Stocks Added to an Index
When a stock is added:
Passive funds must buy the stock
Demand increases sharply
Prices often rise before and on the rebalancing date
This phenomenon is known as the “index inclusion effect.” In many cases, the price rally begins after the announcement and peaks near the effective date.
b) Stocks Removed from an Index
When a stock is removed:
Passive funds are forced sellers
Supply increases suddenly
Prices often decline
This is referred to as the “index exclusion effect.” The negative impact may persist for some time due to reduced visibility and lower institutional ownership.
5. Liquidity and Volume Effects
Index rebalancing days are among the highest-volume trading sessions in markets. Key impacts include:
Sharp increase in traded volumes
Higher market depth in index-heavy stocks
Temporary liquidity stress in smaller stocks
Large-cap stocks usually absorb flows smoothly, while mid-cap and small-cap stocks may experience exaggerated price moves due to thinner liquidity.
6. Volatility During Rebalancing
Rebalancing can increase short-term volatility, especially:
Near the closing session on the effective date
In stocks with large weight changes
In indices with high passive ownership
Intraday price swings, large block trades, and closing-auction imbalances are common. However, this volatility is usually event-driven and short-lived, not necessarily a reflection of fundamental risk.
7. Impact on Index Weights and Sector Allocation
Rebalancing does not only change individual stocks—it also affects sectoral exposure. For example:
Higher weight to IT or banking if those sectors outperform
Reduced weight to underperforming sectors
This has a cascading effect:
Sector ETFs must rebalance
Portfolio asset allocation changes
Relative sector performance may shift temporarily
8. Effects on Active Investors and Traders
a) Arbitrage Opportunities
Active traders often try to profit from predictable rebalancing flows:
Buying stocks expected to be added
Short-selling stocks likely to be removed
However, these strategies are competitive and require precise timing, cost control, and liquidity management.
b) Tracking Error Considerations
Active funds benchmarked to indices must manage tracking error. Sudden index changes can:
Increase deviation from benchmark
Force portfolio realignment
Impact short-term performance metrics
9. Long-Term Fundamental Impact
A key debate is whether index rebalancing has lasting fundamental effects. Research suggests:
Short-term price impact is strong
Long-term impact is mixed
Inclusion can improve:
Analyst coverage
Institutional ownership
Corporate visibility
However, it does not automatically improve business fundamentals. Over time, stock prices tend to realign with earnings, growth, and balance-sheet strength.
10. Market Efficiency and Criticism
Index rebalancing has raised concerns about market efficiency:
Prices move due to flows, not fundamentals
Passive investing may amplify bubbles
Overcrowding in index heavyweights
Critics argue that excessive index concentration can distort capital allocation. Supporters counter that rebalancing improves transparency, discipline, and cost efficiency for investors.
11. Indian Market Perspective
In India, index rebalancing of Nifty 50, Nifty Bank, Nifty Next 50, Sensex, and MSCI India has significant impact due to:
Rising ETF and FPI participation
Increasing passive AUM
Lower liquidity in mid-cap stocks
MSCI rebalancing, in particular, attracts large foreign flows and often causes sharp price and volume changes in affected stocks.
12. How Investors Should Approach Rebalancing Events
Long-term investors should avoid emotional reactions and focus on fundamentals
Short-term traders should be cautious of volatility and execution risks
Portfolio managers should plan transitions early to reduce market impact
Understanding announcement dates, effective dates, and expected flows is crucial.
13. Conclusion
Index rebalancing is far more than a technical adjustment—it is a powerful market-moving event. Driven by the growth of passive investing, rebalancing influences prices, liquidity, volatility, and investor behavior across global and Indian markets. While the immediate impact is often mechanical and temporary, the broader implications for market structure, efficiency, and capital allocation are profound.
For anyone active in financial markets, understanding index rebalancing is no longer optional—it is essential for informed decision-making, risk management, and opportunity identification.

This stock can be the first casualtyThis stock can just be the first casualty. The rally from 200 odd to 300 odd is corrective in nature and had to be sold. This is a zig zag corrective pattern where both A and C will have 5 waves of their own. The i st wave of C has been deep. Hence the iiird wave will be much more devastating.
Conclusion - It may be AI or Trumps policies or both, this sector is about to take another hit. I will suggest to keep away from IT.

BTC/USD 1 Day Time Frame Live intraday BTC/USD price (1‑day timeframe): ~$90,368 USD (with a high near ~$92,705 and low near ~$89,560 today) — updated in real‑time.
Real‑time exchange aggregator sites also show similar live ranges:
• BTC ranges roughly $89,500 – $92,700 (24h low/high) on major exchanges.
• Live price data from CoinMarketCap & CoinGecko shows ~$90,100 – $92,300 in recent pricing.
📊 Daily (1D) Key Levels — BTC/USD
Support Levels (bullish buffers where price may bounce):
S1: ~$90,200 – $90,300 — near current trading zone and pivot support.
S2: ~$87,600 – $88,000 — secondary support zone from recent range structure.
S3: ~$85,500 – $86,000 — stronger support if sellers push deeper.
Resistance Levels (sell pressure zones / breakout targets):
R1: ~$94,800 – $95,000 — first upside resistance from pivot targets.
R2: ~$97,000 – $97,500 — medium‑term resistance from recent range highs.
Psychological / higher area: ~$100,000 round number. Traders watch this as a big breakout level if BTC climbs above R2. (Observed market behavior)
📈 Daily Price Range (Current 24h)
Approximate intraday price band:
Low: ~$89,500
High: ~$92,700
This defines today’s 1‑day candle range — useful for intraday support/resistance decisions.

SUZLON 1 Day Time Frame 📈 Live Price Snapshot (Today)
Current price: ~₹53.0 per share (approx latest NSE market data).
Today’s range: roughly ₹52.50 – ₹53.10 so far.
📊 Daily Pivot, Support & Resistance Levels
🔹 Daily Pivot (Reference Level)
Pivot Point: ~₹52.03 — this is the key central level to gauge bias.
📉 Support Levels — Daily
S1: ~₹51.24 – ₹51.44 (first support)
S2: ~₹50.69 – ₹50.86
S3: ~₹49.81 – ₹49.01
(Breaks below these are bearish on the daily chart)
📈 Resistance Levels — Daily
R1: ~₹52.67 – ₹53.21
R2: ~₹53.55 – ₹53.88
R3: ~₹54.10 – ₹54.98
(Closes above these points signal short‑term bullish strength)
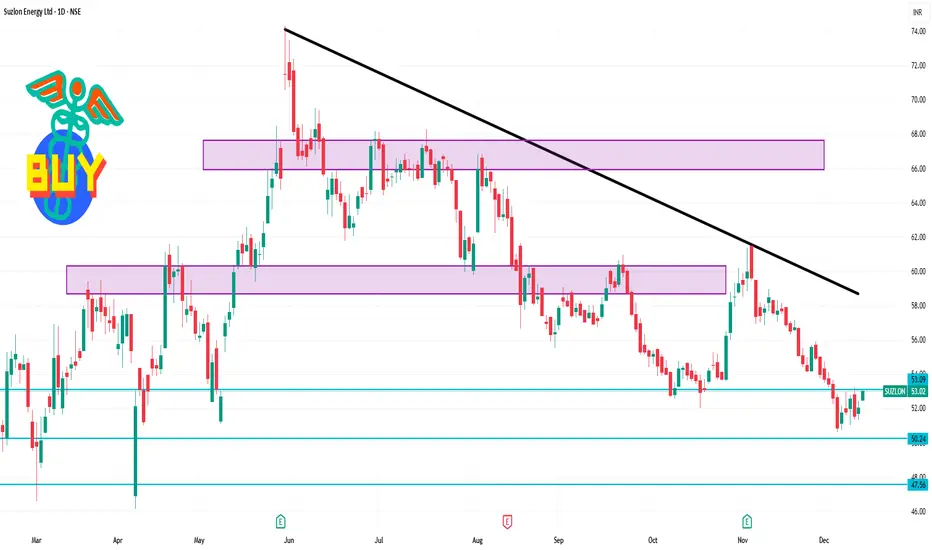
ABB 1 Day Time Frame 📍 Current Price (as of latest market update)
• Around ₹5,278 on NSE/BSE today (Mid-day/last traded level) — up ~0.68% vs previous close.
🔁 Daily Pivot, Support & Resistance Levels (1-Day Frame)
These are dynamic levels derived from recent trades & pivot formulas used by traders to gauge likely intraday turning points:
📊 Standard Daily Pivot Levels (based on recent data):
Level Approx Value
R3 (Strong Resistance) ₹5,377
R2 (Secondary Resistance) ₹5,338
R1 (First Resistance) ₹5,308
Pivot Point (Central) ~₹5,269
S1 (First Support) ₹5,239
S2 (Secondary Support) ₹5,200
S3 (Strong Support) ₹5,170

$TWT at a Major Decision Zone | Accumulation or Distribution?CRYPTOCAP:TWT at a Major Decision Zone | Accumulation or Distribution?
CRYPTOCAP:TWT has been range-bound between $0.65 – $1.55 for nearly 3 years, signaling a long-term consolidation. This structure usually precedes a big directional move, the only question is which side breaks first.
Bullish Structure (Accumulation Case)
🔹 Primary accumulation zone: $0.92 – $0.72
🔹 Key condition: Price must hold above $0.70
🔹 If support holds Upside expansion targets: $2 → $5 → $10 (only after confirmed breakout)
Bearish Structure (Distribution Case)
🔹 $0.70 = critical long-term support
🔹 A clean breakdown below $0.70 confirms bearish market structure
🔹 Downside Targets: $0.20 – $0.10 (70–80% potential drawdown)
Key Technical Levels
Strong Resistance: $1.72
Major Support: $0.70
FVG / Demand Zone: $0.23 – $0.17
Technical Conclusion
CRYPTOCAP:TWT is compressing inside a multi-year range. No bias until breakout or breakdown.
Trade only confirmed setups, manage risk tightly, and let price decide the direction.
NFA & DYOR

DIXON 1 Week Time Frame 📌 Live Price Snapshot (Approx)
Current price: ~₹13,300–₹13,400 (today range ~₹13,005–₹13,422) — confirms the recent trading zone.
📊 1-Week Pivot / Key Levels
From pivot analysis based on weekly range (TSR pivot data):
Weekly Pivot Levels: (Standard pivot)
Weekly Pivot: ~~₹14,526**
Resistance:
R1: ~₹14,850
R2: ~₹15,388
R3: ~₹15,712
Support:
S1: ~₹13,987
S2: ~₹13,664
S3: ~₹13,125**
These levels are for the entire trading week and act as reference points.
Important intraday/short-term pivot reactions (classic):
R1: ~₹13,673
R2: ~₹13,829
R3: ~₹14,028
S1: ~₹13,318
S2: ~₹13,119
S3: ~₹12,963**
Useful for shorter term intra-week trading thresholds.

Gold Strengthening as Bullish Structure FormsOANDA:XAUUSD is beginning to present a noticeably stronger bullish tone as the underlying price structure shifts upward.
The most recent market interaction is particularly noteworthy as an early recovery phase has emerged, bearish momentum has weakened, and a series of low-volume candles highlights clear seller exhaustion. These characteristics often signal the early stages of a new bullish movement.
From the current structure, my upside target remains the 4,330 region, a logical and well-aligned level within this developing trend. If price continues to build on this momentum, the next leg could become a clean and convincing extension of the broader bullish narrative we have been following on Gold.
This setup stands out as highly compelling. The story is unfolding, yet it still requires patience and a confirmed signal to validate the upward potential.
Although a deeper pullback cannot be completely ruled out due to the defined support zone below, I continue to favor bullish continuation as the forming structure clearly supports the upside scenario.
Wishing you a strong and profitable trading session.
