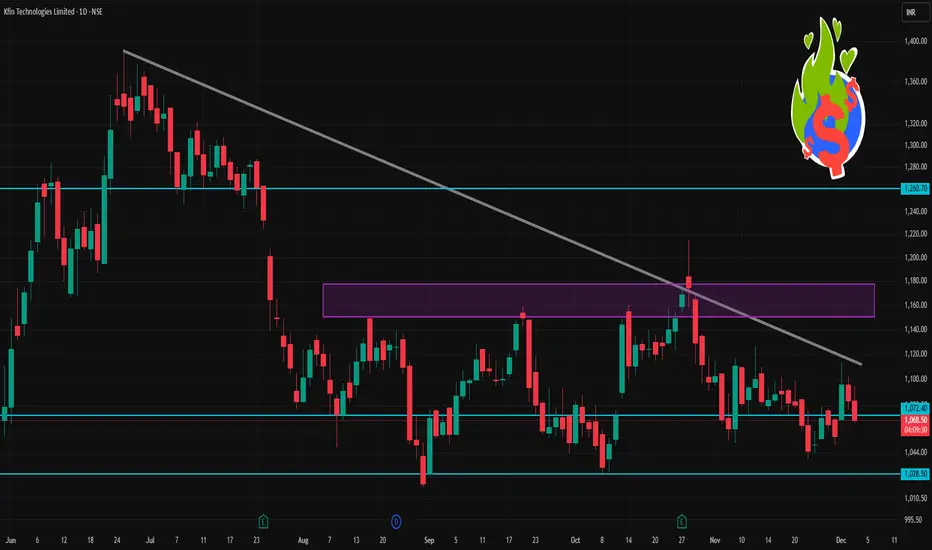
KFINTECH 1 Day Time Frame 📊 Current Snapshot (as of right now)
Reported day’s trading‑range so far: ~ ₹ 1,066.70 (low) to ~ ₹ 1,095.00 (high)
Opening price: ~ ₹ 1,083.80
Previous close: ~ ₹ 1,083.40
Market‑wide context: 52‑week high ~ ₹ 1,641.35, 52‑week low ~ ₹ 784.15
📌 Key Intraday / Short‑Term Levels (Classic Pivot‑Style)
Using the standard pivot‑point formula (Pivot = (High + Low + Close)/3) plus support/resistance calculations.
Here’s what that yields roughly for today — with High = 1,095.00, Low = 1,066.70, Close (yesterday) ≈ 1,083.40:
Level Approximate Price (₹)
Pivot (PP) ~ 1,081.70
Support 1 (S1) ~ 1,068.40
Support 2 (S2) ~ 1,050.40
Resistance 1 (R1) ~ 1,108.90
Resistance 2 (R2) ~ 1,131.00
Interpretation:
If the price stays above PP (~1,082) — bullish bias; otherwise, cautious/bearish.
S1 (~1,068) may act as “first floor”: if price drops near there and holds, watch for bounce.
A break below S2 (~1,050) might lead to deeper correction or volatility.
On upside, a strong move above R1 (~1,109) could challenge R2 (~1,131).
Wave Analysis
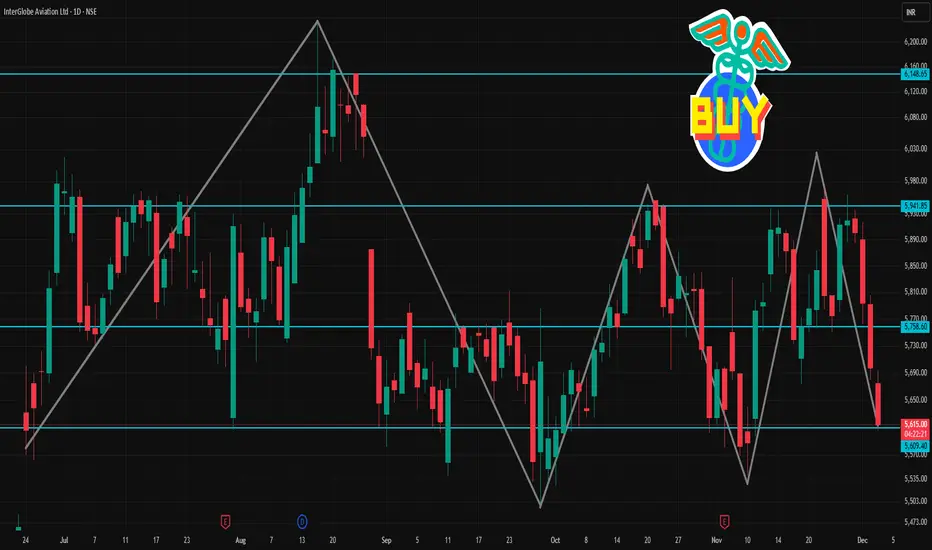
INDIGO 1 Day Time Frame 📌 Latest Price Snapshot & Context
On a recent trading day, the stock’s day’s range was ~ ₹ 5,626 – ₹ 5,694.
The 52-week range remains ₹ 3,945 – ₹ 6,232.50.
Recent closing / quoted prices have been around ₹ 5,900 – ₹ 5,913 (though there are multiple sources — price may fluctuate intraday).
🔄 Daily Pivot & Key Intraday Levels (Standard + Camarilla/Fibonacci from a common pivot-level table)
From a recent pivot-level analysis for “daily” timeframe:
Level Type / Label Price (Approx, ₹)
Pivot (standard daily) ₹ 5,672.33
Support 1 (S1) ₹ 5,634.67
Support 2 (S2) ₹ 5,599.33
Support 3 (S3) ₹ 5,561.67
Resistance 1 (R1) ₹ 5,707.67
Resistance 2 (R2) ₹ 5,745.33
Resistance 3 (R3) ₹ 5,780.67
For “Camarilla” variant on same day: pivot also ₹ 5,672.33, with S- and R- levels slightly tighter: e.g. S1 around ₹ 5,663, R1 around ₹ 5,677.
Some alternate analyses cite supports around ₹ 5,733 / ₹ 5,671 / ~₹ 5,579, and resistances ~ ₹ 5,804 / ₹ 5,832 / ~₹ 5,978 depending on timeframe/ method.
usdinr alert for long sideusdinr wonderful monthly weekly illiot 5th wave completion stage , 5th wave might goes upto 90.57 level .. keep 91 as sl ..nd sell with every rise .. till 90.57 ..day close above 91 sl.... target 86/80/76/69... it might be temporary pose of usd era nd inr uprise we might see... jai hind..this is purely study purpose

Gold H1 – Will 4278–4280 Trigger a Drop Into 4170 Today?🟡 XAUUSD – Intraday Smart Money Plan | by Ryan_TitanTrader (01/12)
📈 Market Context
Gold continues its impressive rally as markets price in a potential rate cut by the Federal Reserve (Fed) in December. Spot gold recently surged past $4,230/oz — hitting a multi-week high — as the US Dollar Index (DXY) weakened.
The backdrop is increasingly dovish: fading USD strength, soft U.S. macro data, and dovish comments from Fed officials have fueled speculative buying in gold.
Technically, gold remains elevated, hovering inside a rising channel — similar to what’s shown on your chart. Price compression following strong displacement suggests a consolidation before the next institutional move.
🔎 Technical Framework – Smart Money Structure (H1)
Current state = Accumulation / Distribution within rising channel
Liquidity zones & key triggers
• Premium liquidity zone (sell-opportunity): ~ 4278–4280 (near upper channel resistance) — aligns with your SELL zone.
• Discount liquidity zone (buy-origin / re-entry zone): ~ 4172–4170 (near lower channel support / trendline) — aligns with your BUY zone.
• Equilibrium / chop zone: mid-channel / recent consolidation zone — avoid trading blindly here unless structure breaks.
Expected Smart Money sequence
Sweep → CHoCH/MSS → BOS → Displacement → Retest (FVG/OB) → Expansion
Given the macro tailwinds (weak USD, rate-cut odds), gold remains primed for a directional move once structure confirms.
🎯 Trade Plans for Today
🔴 SELL GOLD 4278 – 4280 | SL 4288
• Thesis: A liquidity sweep at channel top / premium zone followed by engineered bearish displacement — capturing liquidity before a reversal.
• Entry rules (must wait for confirmation):
• Price touches 4280 zone
• Bearish CHoCH / MSS + BOS down on M5–M15
• Entry ideally on FVG fill or after order-block retest post-BOS
• Targets:
1. 4245 – 4240 area (first reaction)
2. 4225 – 4215 (mid-channel retest)
3. 4175 – 4172 (lower channel + buy zone)
🟢 BUY GOLD 4172 – 4170 | SL 4162
• Thesis: Discount-origin tap near lower channel support / trendline — smart money likely to accumulate for next leg up, especially amid dovish Fed sentiment.
• Entry rules (must wait for confirmation):
• Price dips into 4170 zone
• Bullish CHoCH / MSS + BOS up on M5–M15
• Strong bullish wick + FVG fill or OB retest confirmation
• Targets:
1. 4225 – 4230 (first reaction / mid-channel)
2. 4255 – 4265 (upper mid-channel)
3. 4278 – 4280+ (premium liquidity retest)
⚠️ Risk Management & Notes
• Avoid trading inside the mid-channel chop zone without structural confirmation — no “blind” entries.
• Do not treat sweeps (top or bottom) as trend entries — these are often traps.
• Use tight SL (structure invalidation), avoid averaging in consolidation.
• Given potential volatility from macro headlines or a USD bounce, consider reducing lot size.
Summary
Gold is currently riding macro tailwinds — weak USD + Fed rate-cut odds — but from a technical perspective, it’s compressed inside a rising channel. The day’s price action may be a classic Smart Money liquidity hunt: either a sweep at 4278–4280 leading to a sharp drop toward 4170, or a retracement to 4170 that sets up a fresh bull leg.
Only trade after structural confirmation (CHoCH / BOS + retest) — avoid “trend-hop” entries.
📍 Follow @Ryan_TitanTrader for daily Smart Money updates.

NIFTY Elliott Wave Analysis – 1H - 03-DEC-2025Price is currently reacting inside the support zone and may be completing Wave (ii) within Wave 3. As long as the support region holds, bullish continuation toward Wave (iii) and beyond remains valid.
Key Support Zone
🔹 25,855 – 25,713
🔹 Major support / invalidation: 25,313
Bullish Wave Structure
Wave 1 completed, Wave 2 bottomed at 25,313
Current decline is likely forming Wave (ii) pullback
Expected rise into Wave (iii) once support holds
Target zone for Wave iii = 27,050 – 27,500
Wave 3 larger target = 27,821 – 28,255 / 28,434 / 28,834
Trading Plan
📌 Bullish above 25,855 – buy on dips
🎯 Targets: 26,377 → 26,755 → 27,050 → 27,500 → 27,821+
🛑 Invalidation only below: 25,713 / major invalidation 25,313
Market Sentiment
⭐ Strong upward channel still intact
⭐ Wave 3 expected to be strongest trending move
⭐ Risk/Reward highly favorable near support
Bias
Bullish as long as price stays above 25,855–25,713 zone
Disclaimer
Educational Elliott Wave study. Not investment advice.

Gold 1H – Can 4265 Breakout or Trap Into 4185?🟡 XAUUSD – Intraday Smart Money Plan | by Ryan_TitanTrader (02/12)
📈 Market Context
Gold continues its impressive rally as markets price in a potential rate cut by the Federal Reserve in December. Spot gold recently surged — reflecting multi-week highs — as the US Dollar Index (DXY) weakened. The backdrop is increasingly dovish: fading USD strength and rate-cut odds have kept gold bid.
From a technical perspective, price sits compressed at the channel top, signaling liquidity plays before the next institutional leg. Macro tone from Powell’s opening remarks on ForexFactory adds volatility fuel.
🔎 Technical Framework – Smart Money Structure (H1)
Current state = Accumulation / Distribution within rising channel
Liquidity zones & key triggers
• Premium liquidity zone (sell-opportunity): ~4265–4267 (upper-edge pool of liquidity)
• Discount liquidity zone (buy-origin / re-entry zone): ~4186–4184 (demand liquidity near prior displacement base)
• Equilibrium / chop zone: mid-channel compression → no blind trading unless structure validates direction
Expected Smart Money sequence
Sweep → CHoCH/MSS → BOS → Displacement → FVG/OB Retest → Expansion
Gold remains primed for a directional move only after structure confirms intent.
🎯 Trade Plans for Today
🔴 SELL GOLD 4265 – 4267 | SL 4275
• Thesis: Liquidity sweep above equal highs at premium edge, followed by engineered bearish BOS confirming institutional selling intent.
• Entry rules (must wait for confirmation):
✔ Price pokes 4266 zone → bearish CHoCH/MSS + BOS down (M5–M15)
✔ Entry on FVG fill or OB retest after BOS validation
• Targets:
1. 4245 – 4240 (first reaction)
2. 4225 – 4215 (channel EQ retest)
3. 4186 – 4184 (full delivery into discount)
🟢 BUY GOLD 4186 – 4184 | SL 4176
• Thesis: Discount liquidity tap at institutional base, buy absorption after sweep + bullish BOS signaling new intraday demand.
• Entry rules (must wait for confirmation):
✔ Price sweeps 4185 → bullish CHoCH/MSS + BOS up (M5–M15)
✔ Entry on rejection wick + FVG fill or OB retest confirmation
• Targets:
4. 4215
5. 4240
6. 4265+
⚠️ Risk Management & Notes
• Avoid trading inside mid-range without CHoCH/BOS validation — sweeps are traps until proven by MSS + BOS.
• Use SL for structure invalidation only — no averaging in compression.
• Reduce lot size during Powell’s delivery window; macro impulses can run both sides of liquidity fast.
📍 Summary
Gold is coiling at highs for liquidity. Either Powell triggers a 4266 sweep → bearish BOS → delivery, or price hunts 4185 discount → bullish BOS → continuation.
Trade the structure, not the narrative — wait for CHoCH & BOS + retest to unlock expansion.
📌 Follow @Ryan_TitanTrader for daily Smart Money updates.

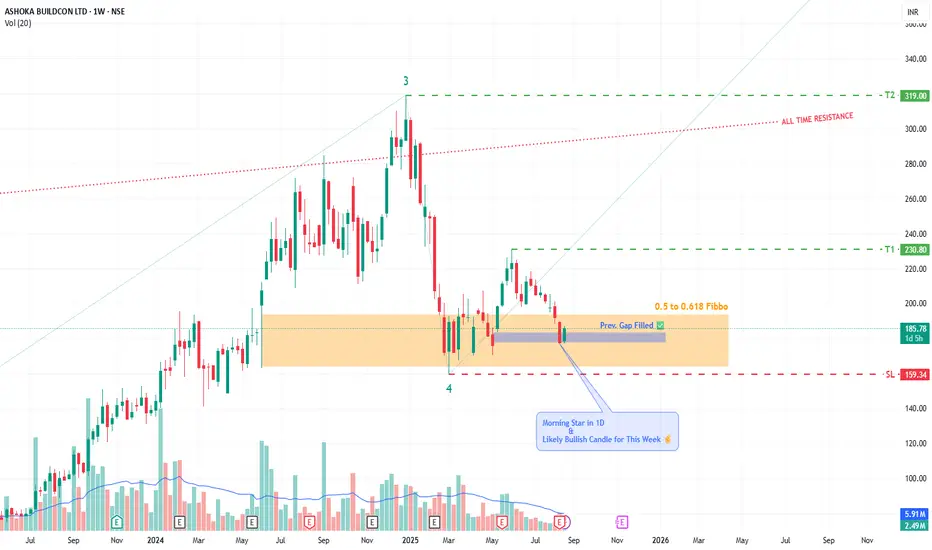
VIEW ON ASHOKA BUILDCON BY KRS CHARTSDate - 21st August 2025 / 10:35 AM
Why ASHOKA ?
1. All-time Bullish Stock technically making HHs & HLs.
2. Further, Price is already in Fibbo Golden Reversal Zone for quite a few times and showing bullish traits again.
3. I was eagerly waiting for to retrace down little bit for 1D previous gap-up needed to be filled it & it's Done!
4. 1D it is showing Morning Star Candle sticks Cluster s with more green Candles and this week likely to be closing with bullish candle stick.
5. Wave Theory wise we are in 4th Wave last upside 5th is loading.
All in All, this is good level to look ASHOKA as a good opportunity 👍✅
Targets and SL are Marked in Chart.
Elliott Wave Analysis XAUUSD – December 3, 2025
1. Momentum Analysis
D1 – Daily Timeframe
Daily momentum is currently turning downward.
Looking at the D1 candle, price broke above the (A) high but closed back below it. This can be considered a liquidity sweep.
We need to wait for today’s daily close to confirm whether price can close above 4245.
With D1 momentum moving down, the market is likely to enter a 4–5 day corrective or sideways phase.
________________________________________
H4 – 4-Hour Timeframe
H4 momentum is still rising.
Based on its current position, the H4 momentum may need 1–2 more candles to reach the overbought zone.
Therefore, I expect price to approach the 4245 resistance, where H4 momentum will likely enter the overbought zone and reverse.
________________________________________
H2 – 2-Hour Timeframe
H2 momentum is clustered tightly in the overbought zone → reversal can happen at any moment.
________________________________________
2. Wave Structure
D1 Wave Structure
On the D1 chart, an (A)(B)(C) structure of wave X is forming.
The technical projection for the upside target is 4329 – 4396.
However, current momentum does not support further bullish continuation.
According to my trading approach, when uncertainty is high, I always prioritize momentum over wave projection.
→ Therefore, I treat the daily trend as bearish for now, until momentum shows a clear reversal.
“When in doubt, rely on an objective reference point — even if it may be right or wrong.”
________________________________________
H4 Wave Structure
On H4, I temporarily label a green 5-wave pattern for easier observation.
However, this structure is not confirmed yet, because wave 5 is only valid if price breaks above 4263.
At the moment, both scenarios remain possible:
• Price may still be in green wave 4, or
• Wave X (purple) may already be complete, and price may be developing purple wave Y.
Since H4 momentum is still rising and not yet overbought, I expect price to test the 4245 zone.
If H4 momentum enters the overbought area and reverses at that zone, it will form a high-probability Sell setup.
If price breaks above 4263 while H4 momentum is overbought, we will need to re-evaluate the green 5-wave structure.
________________________________________
H2 Wave Structure
On H2, a 5-wave black structure has already completed, followed by a strong decline.
Price is now retracing upward.
H2 momentum is in the overbought area, which means a reversal can occur at any time.
I expect price to reach the 4245 zone for a Sell opportunity.
If price fails to reach 4245 and instead drops straight below 4168, then the upper-zone Sell plan will be canceled.
________________________________________
3. Overall Market Context
We are inside a daily corrective wave, meaning multiple scenarios can coexist.
This is normal for corrective structures and makes precise forecasting more difficult.
→ Therefore, trading during this phase requires extra caution and strict risk management to protect the account.
________________________________________
🎯 Trading Plan
Sell Zone: 4244 – 4246
Stop Loss: 4267
TP1: 4184
TP2: 4144
TP3: 4081

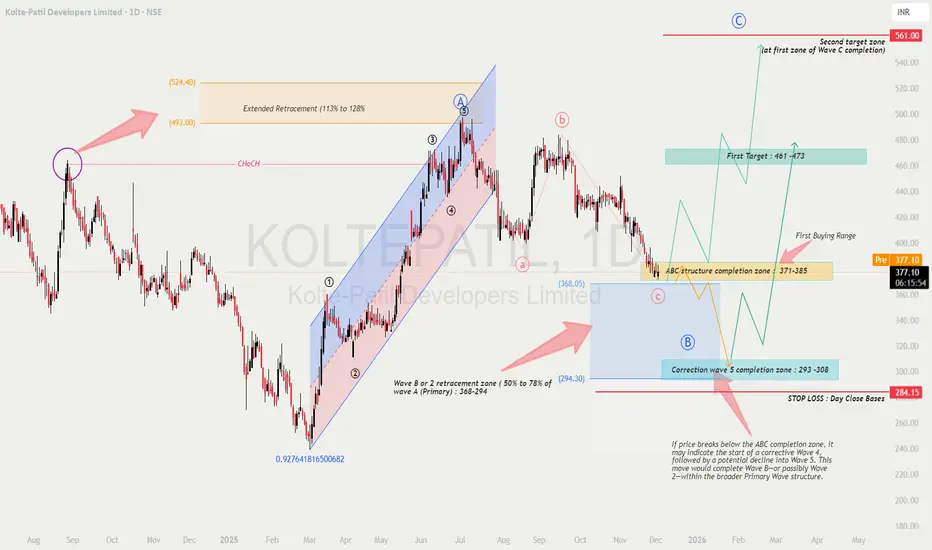
KOLTEPATIL - Wave Analysis
Educational breakdown based solely on chart structure
🔍 1. Chart Findings & Market Structure
The chart shows a clear Elliott Wave progression, where the previous impulse (Primary Wave A) topped near ₹493–524, followed by a corrective ABC decline.
✔ Key Observations
Primary Wave A formed an impulsive rally inside a rising channel.
The price later broke structure (CHoCH) indicating loss of momentum.
Current price (₹377) is trading inside the ABC structure completion zone of ₹371–385, a critical decision area.
A deeper correction toward ₹293–308 remains possible if Wave C extends.
🎓 2. Educational Points (Why These Levels Matter)
📘 A. Extended Retracement Zone: 113–128%
The chart marks ₹493–524 as the extended retracement area, which often acts as:
A wave A termination area
Strong reversal zone
Liquidity grab region
This supports the idea that the major impulse from March–July is complete.
📘 B. Wave B / Wave 2 Retracement
A natural correction for Wave B or Wave 2 typically pulls back 50–78% of the previous impulse.
This gives the ₹368–294 broad range as the acceptable retracement.
📘 C. Completing Wave C (Corrective ABC)
Wave C generally equals Wave A or 1.272–1.618 extension of Wave A.
The chart’s projection supports a potential completion:
First zone: ₹371–385 (current test)
Final zone: ₹293–308 (if extended C-wave unfolds)
📉 3. Current Price Action Insight
Price is currently hovering near the ABC structure completion zone (₹371–385).
No strong bullish reversal candle is visible yet—indicating buyers are waiting for confirmation.
Price remains in a downward corrective structure, but nearing exhaustion.
This phase is ideal for planning, not rushing.
🔮 4. Future Prediction Based on Wave Theory
Two scenarios emerge:
🟦 Scenario 1: ABC Correction Completes at Current Levels (₹371–385)
If the current demand zone holds:
Price forms a wave B bottom and begins Primary Wave C upward.
Expected targets:
🎯 First Target: ₹461–473
🎯 Final Target: ₹561 (Primary Wave C completion zone)
🟥 Scenario 2: ABC Correction Extends to ₹293–308
If ₹371–385 fails:
Market enters the correction wave 5 completion zone (₹293–308).
From this demand block, a stronger bullish reversal is expected.
Long-term bullish structure remains intact if it stays above ₹284 (stop level).
🛒 5. Buying Strategy (Educated Approach)
🟩 FIRST BUYING RANGE: ₹371–385 (Conservative Entry)
Enter only if:
Strong bullish candle (engulfing / pin bar / OB reclaim)
RSI bullish divergence
Price closes above structure high (minor CHoCH)
🟦 SECOND BUYING RANGE: ₹293–308 (High-Value Entry)
A deeper correction provides:
Lower risk
Maximum R:R
Stronger probability of reversal
Use this zone if the first one fails.
⚖ 6. Risk–Reward Analysis
If entering at ₹371–385
Stop-Loss: Below ₹284 (daily close basis)
Upside Potential: Up to ₹561
Reward : Risk Ratio: Approx 3.5–4.2 R
If entering at ₹293–308
Stop-Loss: Below ₹284
Upside Potential: Up to ₹473–561
Reward : Risk Ratio: Approx 5–7 R (excellent)
🔐 7. Confirmation Strategies for Better Entries
Use any two or more of the following:
✔ 1. Market Structure Shift
Wait for a CHoCH above the last swing high inside the zone.
✔ 2. Volume Expansion
Rising green volume during rebound increases reliability.
✔ 3. Bullish Divergence (RSI or MACD)
Signals weakening sellers.
✔ 4. Break & Retest Method
Let price break a minor resistance
Enter on retest to confirm strength
✔ 5. Demand Zone Reaction
Look for:
Long tail candles
Absorption wicks
Order block reclaim
These indicate smart money interest.
🧠 8. Summary & View
The stock is in the final leg of a correction and is approaching highly reactive Fibonacci zones.
Structure favors a bullish wave (Primary Wave C) in the coming months if key support holds.
📌 First confirmation: Bounce from ₹371–385
📌 Strongest bullish case: Reversal from ₹293–308
📌 Invalidation: Close below ₹284
The long setup has strong wave logic, clean levels, and attractive R:R.
⚠️ Disclaimer
This analysis is for educational purposes only and reflects wave-structure interpretation based solely on the provided chart.
I am not a SEBI-registered analyst.
Please conduct your own research or consult your financial advisor before trading or investing.
ICICI Bank — 200-DMA Rejection Keeps the Downtrend IntactMarket Context
ICICI Bank continues to trade inside a broad descending channel that has governed price since the 1500 peak. Every counter-trend rally has been corrective so far, and the recent recovery has shown the same character — overlapping candles, choppy subdivisions, and clear respect for channel resistance.
Key Technical Drivers
1. Rejection at the 200-DMA
The rally stalled exactly at the 200-Day Moving Average. This is the same zone where price lost momentum earlier, reinforcing that the long-term bias remains downward. A failed attempt to reclaim the 200-DMA in a corrective environment typically signals trend continuation rather than reversal.
2. Channel Resistance Still Untouched
Even though momentum carried the stock above short-term levels, the broader upper channel boundary continues to act as the main ceiling. Price behaviour near this level is corrective, not impulsive — another sign that the move is still part of a larger complex structure.
3. Structure Supports a Triple Zigzag (W-X-Y-X-Z)
This entire decline is best interpreted as a higher-degree W-X-Y-X-Z correction.
W bottomed at 1342.60
X rallied to 1445
Y bottomed at 1317.40
The ongoing rally fits well as the second X wave
Wave (c) of this X leg may be close to completion, but the subwaves allow room for a marginal push to retest the channel top before turning lower. Nothing in the current leg looks impulsive enough to suggest a larger trend reversal.
Trading Plan
Direction: Expect the next leg to unfold downward as Wave Z begins.
Target Zone: Break below 1317.40 is likely, with measured support near 1280–1300 at the lower boundary.
Invalidation: A sustained break above 1411.90 invalidates the bearish Z-wave view and opens the door for a trend reassessment.
Conclusion
The failed 200-DMA retest, corrective price structure, and channel resistance all point to the current recovery nearing exhaustion. Whether Wave X makes one more marginal high or not, the broader path remains lower toward the Wave Z terminal zone.
Disclaimer: This analysis is for educational purposes only and does not constitute investment advice. Please conduct your own research before taking any trading decisions.

Silver - CorrectionSeveral signals indicate that a correction is possible around the 60k level (slightly below or above). There’s also an interesting setup in gold, but more on that later in the next chart/idea.”

Bank of Baroda: Impulsive Breakout or Running Flat Trap?The recent All-Time High at 303.95 looks like a breakout to the naked eye, but the internal structure suggests a classic Elliott Wave Trap .
The Technical Disconnect : While the move above the previous peak (299.70) was strong, it lacks the characteristics of a genuine Wave 3 impulse:
Structure : The rally from 190.70 subdivides into a clear 3-wave (a)-(b)-(c) corrective pattern, not a 5-wave motive sequence.
Precision Resistance: The price reversed exactly at the 100% Fibonacci extension, a common termination point for corrective B-waves, not impulsive breakouts.
Momentum : RSI hitting 72.42 at resistance signals exhaustion rather than sustained trend strength.
The Setup: Running Flat Correction This price action confirms a Running Flat scenario. The "breakout" was likely a Wave B bull trap designed to clear stops before the final leg down.
Outlook : We are entering Wave C (down).
Target Zone : 234 – 247. This green box aligns with the 50-61.8% retracement cluster of the recent rally.
Invalidation : A weekly close above 304 . If bulls sustain price above this level, the corrective view is invalid, and a true breakout is in play.
Disclaimer: Educational view only. DYOR.

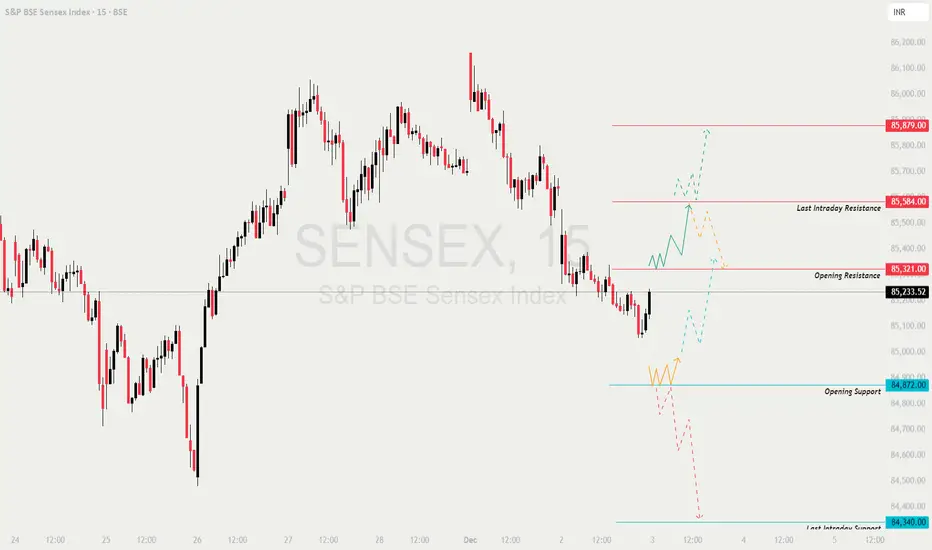
SENSEX : Trading levels and Plan for 03-Dec-2025📊 SENSEX TRADING PLAN — 03 DEC 2025
Sensex closed near 85,233, right below the Opening Resistance (85,321).
The structure shows a base at 84,872 and intraday resistance at 85,584, with clear upside and downside liquidity zones.
The opening trend will depend on how the index behaves around 85,321 and 84,872.
🔍 KEY MARKET LEVELS
🟥 Opening Resistance: 85,321
🟥 Last Intraday Resistance: 85,584
🟥 Major Bull Target: 85,879
🟩 Opening Support: 84,872
🟩 Last Intraday Support: 84,340
🟩 Major Bear Target: 84,150 – 84,050
🟢 SCENARIO 1 — GAP-UP OPENING (300+ POINTS)
Expected opening: 85,500–85,600 region (inside or near last intraday resistance)
If the market opens above 85,500, it will directly test the 85,584 resistance (supply zone).
For long continuation:
✔️ Break above 85,584
✔️ Retest candle with a strong lower wick
🎯 Targets → 85,720 → 85,879
If candles show rejection at 85,584 (upper wicks, volume drop):
Expect profit-booking toward:
➡️ 85,450 → 85,321
Aggressive short traders may fade the rejection from 85,584, but only with confirmation such as lower highs on 3–5 min charts.
📘 Educational Insight:
Gap-ups into major resistance are high-risk for longs.
Always wait for either a clean breakout or a clear rejection before acting.
🟧 SCENARIO 2 — FLAT OPENING (Around 85,200–85,300)
Price will open exactly near the Opening Resistance (85,321) — a decision zone.
Upside trigger for long trades:
✔️ Break + sustain above 85,321
🎯 Targets → 85,420 → 85,500 → 85,584
Downside trigger for shorts:
✔️ Break below 85,150
🎯 Targets → 84,990 → 84,872
Avoid taking positions inside a tight range around 85,200–85,321 until a clear directional candle closes.
Most reliable setups:
— Retest of 85,321 for longs
— Retest of 85,150 breakdown for shorts
💡 Educational Note:
Flat openings require patience.
Trend becomes clear after the first 3–4 candles—avoid impulse trades.
🔻 SCENARIO 3 — GAP-DOWN OPENING (300+ POINTS)
Expected opening: 84,800–84,900 zone (near Opening Support)
If price holds 84,872, expect a reversal bounce toward:
➡️ 85,050 → 85,150 → 85,321
For safe long reversal entries:
✔️ Support respected for 3–4 candles
✔️ Higher low structure
✔️ Bullish reversal wick at support
If breakdown occurs below 84,872 with strength:
Sellers will target → 84,600 → 84,480 → 84,340
Major breakdown trigger:
✔️ Sustained trade below 84,340
🎯 Targets → 84,150 → 84,050
📘 Educational Note:
Gap-downs into strong support often generate false breakdowns.
Let the retest after the first breakdown decide the direction.
💼 RISK MANAGEMENT TIPS FOR OPTIONS TRADERS 📘⚠️
Trade only after the first 5–10 minutes to avoid trap candles.
Use ITM options for momentum trades to reduce theta decay.
Keep stop-loss based on chart levels, not random premium numbers.
Do not average losing trades — exit and re-enter on new structure.
Trail SL after each target hit (especially in strong trends).
Avoid naked selling near event days or high VIX.
Stop trading after 2 consecutive losses.
💡 Pro Tip:
When market enters a “No Trade Zone”, shift focus from trading to observing liquidity behaviour.
📌 SUMMARY
Bullish Above:
✔️ 85,321 → 85,420 → 85,500 → 85,584 → 85,879
Bearish Below:
✔️ 85,150 → 84,990 → 84,872 → 84,600 → 84,340 → 84,150
Critical Zones:
🟥 Major Resistance → 85,584
🟩 Major Support → 84,872, 84,340
Trend Deciders:
🔑 Above 85,321 → Bullish day
🔑 Below 84,872 → Intraday weakness
🔑 Below 84,340 → Trend breakdown
🧾 CONCLUSION
Sensex is at a crucial turning point.
The market tone for 03-Dec will be set by how price behaves around:
✔️ 85,321 on the upside
✔️ 84,872 on the downside
Follow levels, not emotions.
Avoid trades in indecisive ranges and strike only on confirmed breakouts or clean retests.
⚠️ DISCLAIMER
I am not a SEBI-registered analyst.
This analysis is for educational and study purposes only.
Consult a certified financial advisor before investing or trading.
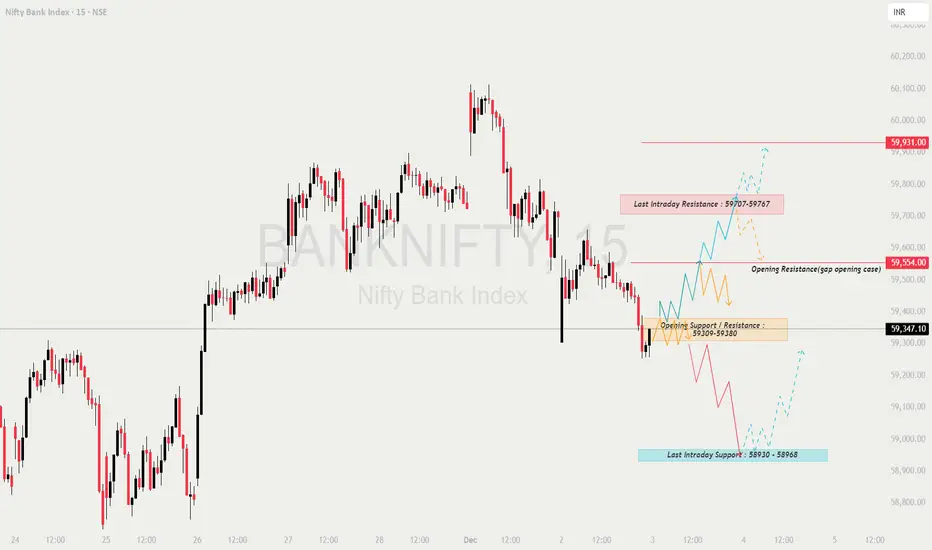
BANKNIFTY : Trading levels and Plan for 03-Dec-3035📊 BANKNIFTY TRADING PLAN — 03 DEC 2025
BankNifty closed near 59,347, sitting inside the Opening Support / Resistance Flip Zone (59,309–59,380).
The index is currently attempting to stabilise after a sharp down-move, with both 59,554 and 58,930 acting as the most important decision zones for 03-Dec.
Market direction will depend on how price reacts around these zones at the open.
🔍 KEY LEVELS TO WATCH
🟥 Opening Resistance (Gap-Up Case): 59,554
🟥 Last Intraday Resistance: 59,707 – 59,767
🟥 Major Upside Target: 59,931
🟩 Opening Support / Resistance Flip Zone: 59,309 – 59,380
🟩 Last Intraday Support: 58,930 – 58,968
🟩 Major Breakdown Target: 58,780 – 58,720
🟢 SCENARIO 1 — GAP-UP OPENING (200+ POINTS)
If BankNifty opens around 59,500–59,600, it directly enters the Opening Resistance zone.
If price sustains above 59,554, buyers will push toward:
➡️ 59,707 → 59,767 → 59,931
Best long entry:
✔️ Breakout above 59,554
✔️ Retest candle with long lower wick
✔️ Entry on strength → Targets above
If price rejects 59,554–59,707 on the first 5–10 min (upper wicks, exhaustion):
Expect pullback to:
➡️ 59,420 → 59,309 zone
Only aggressive traders should attempt fade-shorts near 59,707–59,767.
High risk due to strength in the zone.
📘 Educational Note:
Gap-ups into resistance require confirmation of strength.
Don’t assume continuation — let structure break first.
🟧 SCENARIO 2 — FLAT OPENING (59,250–59,350)
Flat opening puts price directly inside the flip zone (59,309–59,380) — high indecision.
Range-bound movement expected in first 10–15 minutes.
Upside trigger:
✔️ Break above 59,380
Targets → 59,480 → 59,554 → 59,707
Downside trigger:
✔️ Break below 59,309
Targets → 59,200 → 59,120 → 58,968
Avoid trades inside 59,309–59,380 until a clean directional breakout occurs.
Safer setups:
— Retest of 59,380 for long
— Retest of 59,309 break for short
💡 Educational Tip:
Flat opens give the most reliable patterns after the first 3 candles.
Let noise settle, trade clean structure.
🔻 SCENARIO 3 — GAP-DOWN OPENING (200+ POINTS)
A gap-down near 59,000–59,100 brings price close to the Last Intraday Support (58,930–58,968).
If 58,930–58,968 holds, expect a strong reversal toward:
➡️ 59,120 → 59,309 → 59,380
If price breaks 58,930 with momentum, downside opens to:
➡️ 58,820 → 58,780 → 58,720
Only take reversal longs if:
✔️ Support holds for 2–3 candles
✔️ Higher lows form
✔️ Strong bullish rejection wick appears
Breakdown traders should wait for retest of 58,930 after breakdown.
This gives low-risk continuation entries.
📘 Educational Note:
Gap-downs into major support can create high-quality reversal trades, but only after confirmation.
Never pre-empt reversals.
💼 RISK MANAGEMENT TIPS FOR OPTION TRADERS 🔐📘
Avoid trading the first 5 minutes — high trap probability.
Use ITM options for directional trades for better decay protection.
Keep SL based on chart levels, not option premium noise.
Avoid averaging losing positions — re-entry is cheaper than recovery.
Book partial profits at first target and trail stop loss.
During volatile zones, prefer spreads instead of naked options.
Stop trading after 2 consecutive losses — protect capital.
⚠️ Golden Rule:
Strong levels give clean trades.
Avoid trading in the noise zones.
📌 SUMMARY
Bullish Above:
✔️ 59,380 → 59,480 → 59,554 → 59,707 → 59,931
Bearish Below:
✔️ 59,309 → 59,200 → 59,120 → 58,968 → 58,780
Key Zones:
🟩 Strong Support: 58,930–58,968
🟧 Flip Zone (No-Trade until breakout): 59,309–59,380
🟥 Strong Resistance: 59,554–59,707
Major Trend Decider:
🔑 Sustaining above 59,554 → Trend bullish
🔑 Breaking below 58,930 → Trend bearish
🧾 CONCLUSION
BankNifty is positioned at a critical flip zone.
The day’s trend will depend on whether:
✔️ Buyers reclaim 59,380–59,554, or
✔️ Sellers break 59,309 → 58,930
Follow structure, avoid prediction, and trade only after confirmation.
⚠️ DISCLAIMER
I am not a SEBI-registered analyst.
This analysis is for educational purposes only.
Please consult a certified financial advisor before taking trades.
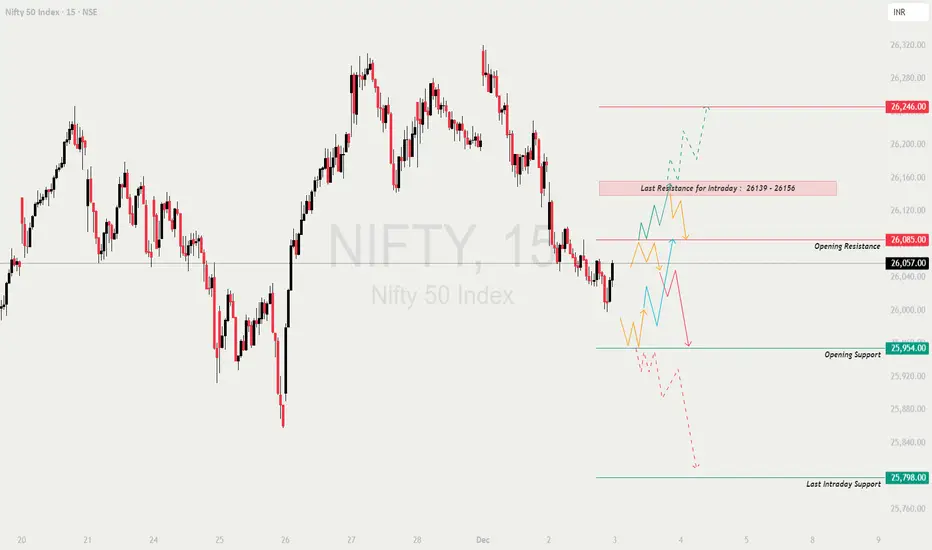
NIFTY : Trading levels and Plan for 03-Dec-2025📊 NIFTY TRADING PLAN — 03 DEC 2025
Nifty closed around 26,057, sitting just below the Opening Resistance (26,085) and far from both the day’s support and supply zones.
The chart indicates bearish pressure, but buyers still defend the 25,954 support on dips.
The behaviour at the opening will define whether the index attempts a rebound or continues the downtrend.
🔍 Key Levels For The Day
🟥 Opening Resistance: 26,085
🟥 Last Intraday Resistance: 26,139 – 26,156
🟥 Major Upside Target: 26,246
🟩 Opening Support: 25,954
🟩 Last Intraday Support: 25,798
🟩 Major Breakdown Target: 25,760 – 25,720
🟩 SCENARIO 1 — GAP-UP OPENING (100+ Points)
If Nifty opens near 26,150–26,200, it jumps straight into the resistance zone.
If price sustains above 26,085 → It will attempt the next resistance at:
26,139 → 26,156 → 26,200+
Break & retest above 26,156 gives a drive toward 26,246.
If price rejects 26,085–26,139 (upper wicks, strong red candle) →
Expect profit-booking down toward 26,020 → 25,954.
Safer Long Setup:
✔️ Breakout above 26,156 + Retest → Target 26,200 / 26,246
Early aggressive shorting is risky.
Gap-ups near resistance often create trap candles.
📘 Educational Note:
A gap-up directly into resistance is often a testing zone where institutions check if late buyers will panic.
Let the chart confirm strength before entering.
🟧 SCENARIO 2 — FLAT OPENING (25,980–26,050)
Flat openings create a balanced battlefield between bulls and bears.
Upside trigger → Break above 26,085
Targets → 26,139 → 26,156 → 26,200
Downside trigger → Break below 25,954
Targets → 25,900 → 25,850 → 25,798
Avoid trading inside the tight range 26,020–26,070 — high noise, low reward.
Two ideal setups:
✔️ Breakout & Retest above 26,085
✔️ Breakdown & Retest below 25,954
💡 Educational Tip:
Flat opens typically lead to a clean breakout after the first 2–3 candles.
Let direction reveal itself instead of predicting it.
🔻 SCENARIO 3 — GAP-DOWN OPENING (100+ Points)
If Nifty opens around 25,920–25,960, it opens near or inside support.
If buyers defend 25,954 and form higher lows →
Reversal targets:
26,020 → 26,057 → 26,085
If 25,954 breaks decisively →
Next targets → 25,900 → 25,850 → 25,798
Breakdown below 25,798 triggers stronger fall →
Targets → 25,760 → 25,720
Reversal trades should only be taken with:
✔️ bullish candle
✔️ higher low
✔️ strong wick rejection
inside the support zone.
📘 Educational Note:
Gap-downs into support attract smart money buying, but only if the zone holds.
A breakdown usually gives a clean trend day on the downside.
💼 RISK MANAGEMENT TIPS FOR OPTION TRADERS 🔐💡
Do NOT trade the first 5 minutes after open (avoid traps).
Prefer ITM/ATM options for directional moves.
Use chart-level SL, not premium-level SL.
Avoid averaging losing trades — re-entry is always safer.
Trail SL once the trade hits the first target.
During high VIX, prefer option spreads.
Avoid overtrading during volatile candle clusters.
⚠️ Golden Rule:
Protect capital first.
Exposure without risk control = guaranteed loss.
📌 SUMMARY
Bullish Above:
✔️ 26,085 → 26,139 → 26,156 → 26,200 → 26,246
Bearish Below:
✔️ 25,954 → 25,900 → 25,850 → 25,798 → 25,760
Reversal Zones:
🟩 25,954 (Opening Support)
🟩 25,798 (Intraday Support)
🟥 26,085 (Opening Resistance)
🟥 26,139–26,156 (Key Supply Zone)
Avoid Trading Inside:
⚠️ 26,020–26,070
This is the NOISE zone.
🧾 CONCLUSION
Nifty is set for a decisive day with clear vertical levels.
Trend direction will be driven by:
✔️ Sustaining above 26,085 = Bullish continuation
✔️ Breaking below 25,954 = Fresh downside
✔️ Breakout above 26,156 = Strong rally
✔️ Breakdown below 25,798 = Sharp sell-off
Trade only with confirmation, avoid guessing direction, and focus on clean structure-based entries.
⚠️ DISCLAIMER
I am not a SEBI-registered analyst.
This analysis is purely for educational purposes.
Please consult your financial advisor before making trading decisions.
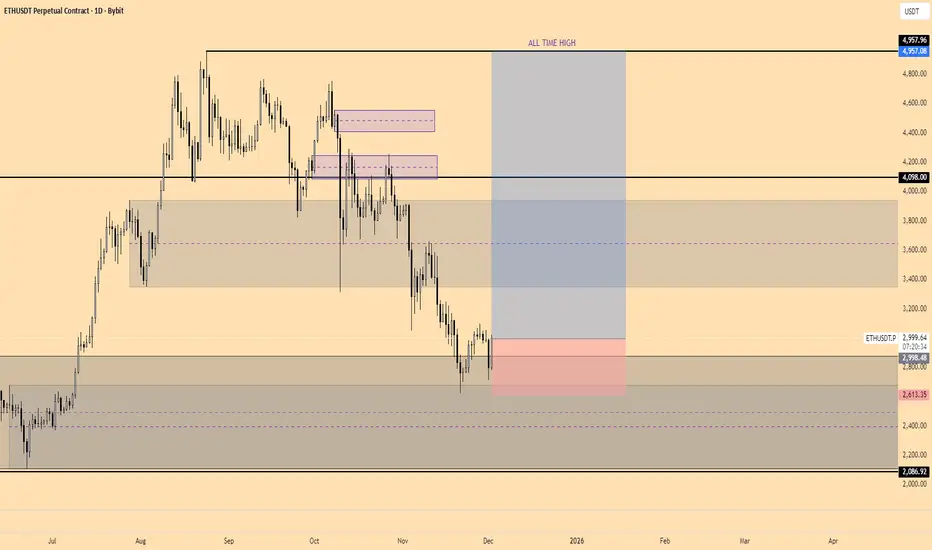
Buying $ETH Spot againAs we see CRYPTOCAP:ETH is holding Monthly Orderblock pretty well and Daily Price action is looking bullish too, so i am interested in buying CRYPTOCAP:ETH now.

Lets Create and Backtest a Simple Strategy from literally ZeroI make educational content videos for swing / positional trading .
In this video I will be using 3 months old chart along with one example of how to approach any trade or price action with literally zero lines and zones on screen .

USD/CAD in Daily time frameAS per Wave analysis, Correction of flat is done. Now Wave 5 started for down trend in daily time frame for an Target of 1.36250

Big Mistakes Traders Must Avoid1. Trading Without a Strategy
One of the biggest mistakes beginners make is trading without a clearly defined plan. They enter trades based on gut feelings, social media tips, or random chart patterns. Without a structured system, the trader relies on luck — and luck is not a strategy.
A proper trading strategy should define:
Entry rules
Exit rules
Stop-loss placement
Profit targets
Risk per trade
Market conditions (trend, range, volatility)
Beginners often jump between strategies, copying YouTubers or Telegram channels, killing their consistency. A good trader tests one system, refines it, and masters it over time.
2. No Risk Management
Many beginners believe making money is all about finding perfect entries. In reality, risk management is 70% of trading success.
Common risk mistakes:
Trading without stop-loss
Risking too much capital on a single trade
Averaging losers
Over-leveraging
A general rule is to risk only 1–2% of capital per trade. But new traders often risk 10–50% hoping for fast profits, and the market punishes this instantly.
Professional traders survive because they preserve capital first and grow second. Beginners try to grow fast and lose everything quickly.
3. Overtrading
Overtrading happens when traders take too many trades, either out of excitement or boredom. Many beginners think more trades equal more profit — but in trading, quality matters more than quantity.
Reasons beginners overtrade:
Wanting to recover losses
Emotional rush of the market
Fear of missing out (FOMO)
Misunderstanding setups
Overtrading leads to mistakes, emotional decision-making, and burnout. Elite traders might take only 1–5 high-quality trades a week, while beginners take 30–50 impulsive ones.
4. Emotional Trading
The market is a mirror that reflects a trader’s emotions: fear, greed, impatience, and ego. Beginners often have emotional reactions such as:
Fear of missing a move
Greed for a larger profit
Fear of losing
Revenge trading after losses
Impulsive decisions when stressed
Trading emotionally leads to:
Early exits
Late entries
Ignoring stop-losses
Forced trades
Losses due to panic
Successful trading requires a calm, disciplined mind that follows predefined rules. Consistency comes from emotional stability, not excitement.
5. Lack of Patience
Beginners often want profits now. They enter trades prematurely or exit too soon. But the market rewards patience — waiting for the right setup, the right confirmation, and the right time.
Patience is needed in:
Waiting for the chart to reach key levels
Allowing trade to hit targets
Avoiding unnecessary trades
Backtesting and learning
Most losses come from impatience, not lack of knowledge.
6. Not Accepting Losses
A major psychological trap is refusing to accept small losses. Beginners often say:
“It will come back.”
“I’ll wait a little more.”
“I can’t close in loss.”
This leads to:
Blown accounts
Huge drawdowns
Emotional distress
Professional traders accept losses as a cost of doing business. They keep losses small and controlled. Beginners avoid losses emotionally and end up taking catastrophic ones.
7. Following Tips, News, and Others’ Opinions
Many beginners follow:
Telegram tips
YouTube signals
WhatsApp groups
Friends’ opinions
Influencer recommendations
This creates dependency and confusion because:
The tip provider may not share risk levels
Market conditions differ
Signals can be manipulated
No one understands your trading style better than you
The best traders rely only on their own analysis, not random noise from outside.
8. Unrealistic Expectations
New traders enter the market thinking:
They’ll double their capital in a month
They can turn ₹10,000 into ₹10 lakh quickly
Trading is easy money
They will never lose
This mindset leads to frustration, losses, and quitting. Trading is a marathon, not a sprint. Realistic expectations:
Consistent returns are usually 2–8% per month for skilled traders
Losses are part of the process
Skill takes months or years to build
The market rewards discipline, not fantasy
9. Ignoring Market Structure
Beginners focus too much on indicators and too little on price action and market structure. Indicators lag; the structure leads.
Ignoring structure means beginners miss:
Trends
Support and resistance
Breakouts and reversals
Liquidity zones
Demand and supply
Trading blindly based on indicators creates confusion. Smart traders combine structure + indicators + risk rules.
10. Not Keeping a Trading Journal
A huge mistake beginners make is not recording their trades. Without a journal, traders cannot track mistakes, improve patterns, or refine discipline.
A journal should include:
Entry/exit
Timeframe
Emotions felt
Mistakes
Screenshots
Lessons
Every professional trader documents their trades. Beginners often don’t — and remain stuck.
11. Using High Leverage
Leverage is a double-edged sword. Beginners see it as a shortcut to big profits. In reality, it multiplies losses faster than profits.
High leverage causes:
Sudden liquidation
Panic during volatility
Overconfidence
Overtrading
Using low, controlled leverage is safer and keeps the account alive.
12. Not Learning Continuously
Markets evolve. Strategies stop working. Volatility changes. Without ongoing learning, traders become outdated. Beginners often stop learning once they know basics — but basics don’t create long-term success.
Continuous learning includes:
Studying charts daily
Backtesting setups
Understanding macro concepts
Improving psychology
Reviewing mistakes
The best traders treat trading like a profession that requires constant improvement.
Conclusion
Beginners make these mistakes not because they are incapable, but because trading feels deceptively simple. The biggest errors come from emotions, lack of discipline, and unrealistic expectations. To succeed, a trader must:
Focus on strategy
Manage risk strictly
Control emotions
Trade fewer but high-quality setups
Accept losses
Learn continuously
Trading is not about being right — it’s about managing risk, controlling emotions, and building discipline over time. Those who avoid the above mistakes build long-term, consistent profitability and survive the challenges that wipe out others.

Pro Option Trading System1. Market Framework: Understanding Structure Before Strategy
Professionals never start with signals. They begin with market classification, because options behave differently under different environments.
A pro system starts by identifying:
Trend environment
Uptrend: bullish spreads, naked puts, call credit hedges
Downtrend: put spreads, call credit spreads, bear diagonals
Sideways: iron condors, straddles, neutral calendars
Volatility regime
High IV: Sell options (credit spreads, strangles, condors)
Low IV: Buy options (debit spreads, long straddle, diagonals)
Event environment
Earnings
Fed meetings
Budget
Results season
Professional systems follow the principle:
“Environment dictates strategy.”
2. Strategy Module – Having a Playbook of Setups
A pro system has 4–6 core strategies only, each with exact rules. Too many strategies = confusion. Too few = inflexibility.
A professional options playbook includes:
1. Trend-Following Trades
Bullish: Bull call spread, naked put, diagonal
Bearish: Bear put spread, call credit spread, bearish diagonal
These setups use direction + momentum.
2. Mean-Reversion Trades
Iron condor on range-bound stocks
Credit spreads outside expected range
Short straddles/strangles in high IV
Mean-reversion systems depend heavily on statistical edge, not just price action.
3. Volatility Systems
Buy low IV (long straddle/strangle) before big event
Sell high IV (iron condor, strangle) after IV spike
Calendars for IV mispricing
Professional traders rely more on volatility edge than directional prediction.
4. Income/Multi-week systems
Weekly credit spreads
Monthly condors
Theta-harvesting diagonals
These strategies produce consistent, non-directional income.
3. Entry Criteria – Exact Rules, Not Guesswork
Professionals do not enter trades based on gut feeling. They use mechanical entry rules, such as:
Directional Entry Rules
Trend confirmed on higher time frame
Price above 20/50 EMA (bullish) or below (bearish)
RSI > 55 for bullish, < 45 for bearish
IV low for debit spreads, IV high for credit spreads
Non-Directional Entry Rules
IV Rank > 50 for selling options
Expected move calculated: Sell outside 1.5× expected move
Underlying has stable sideways structure
Liquidity > 500k volume + tight option spreads
Volatility Entry Rules
Enter long volatility when IVR < 20
Enter short volatility when IVR > 60
Avoid selling options before major announcements
The edge comes from mathematical consistency, not prediction.
4. Position Sizing – The Real Key to Survival
Professionals use strict money-management models.
Retailers blow up because they over-leverage.
Safe professional sizing models:
1. Fixed Fraction Model
Max 1–3% of total capital per trade
Max 10% reserved for high-risk trades (events)
2. Volatility-Weighted Sizing
Higher IV → smaller size
Lower IV → bigger size
3. Spread-Adjusted Sizing
Wider spreads = smaller position
Tighter spreads = larger size
4. Portfolio Allocation System
A pro trader allocates capital across:
Directional trades – 20%
Non-directional income – 40%
Event/volatility plays – 20%
Hedges – 20%
This diversification is why pros survive major market crashes.
5. Risk Management Rules – The Heart of a Pro System
Retail traders think winning makes you pro.
Professionals know not losing makes you superior.
Core Risk Rules:
Never let a credit spread go beyond 2× credit received
Never risk more than 5% portfolio per idea
Exit when 50–70% profit is reached (don’t aim for 100%)
Roll or adjust only when rules allow, not emotionally
No naked positions unless fully capitalized
Stop-Loss Rules
Directional debit spreads → stop loss at 40–50%
Credit spreads → exit at 2× credit
Straddles → delta imbalance breach triggers adjustment
Hedging Rules
Pros hedge systematically:
Short call hedge for longs
Long put hedge for naked puts
VIX call hedge during uncertain environment
Risk isn’t avoided—it’s engineered.
6. Adjustment Module – What Pros Do When Market Turns
Retail traders panic.
Professional systems have pre-defined adjustment triggers.
Directional Adjustment
If price breaks trend:
Roll spread up/down
Convert single options into spreads
Move to diagonal to reduce theta decay
Credit Spread Adjustment
If underlying moves toward strike:
Roll out (more time)
Roll up/down (change strike)
Convert to iron condor (add opposite side)
Straddle/Strangle Adjustment
Adjust when:
One side delta > 0.25
Underlying hits outer expected range
Professional systems aim for minimizing loss, not forcing winners.
7. Exit Module – Rules to Lock Profit and Control Loss
Professionals have zero emotional exits.
Profit Exit Rules
Credit spreads: exit at 50–60% profit
Iron condors: exit at 30–40% profit
Debit spreads: exit at 60–80% profit
Straddles: exit at IV crush or 25–30% profit
Calendars: exit near max positive theta
Time-Based Exits
Never hold weekly spreads into expiry
Close positions 1–2 days before major news
Close credit spreads 5–7 days before expiry
Close debit spreads near IV spike
Time-based exits prevent catastrophic losses.
8. Psychology: The Real Edge of a Professional System
A pro system succeeds only if trader psychology matches discipline.
Pro psychological rules:
No revenge trades
No doubling down after losses
No chasing IV spikes
Avoid FOMO positions
Trade only when setup appears
Pros behave like machines.
Emotionless execution = consistent returns.
9. Backtesting & Forward Testing – The Professional’s Secret Weapon
Professional traders rely heavily on:
Historical backtesting (5–10 years)
Forward testing (paper trading 1–2 months)
Statistical validation (win rate, risk-per-trade, expectancy)
Volatility simulation models
Retail traders often skip this step—but systems are born from testing, not imagination.
Important Testing Metrics
Win rate
Average return / risk
Max drawdown
Expected move hit ratio
IVR impact analysis
A professional system never goes live without data.
10. A Realistic Example of a Simple Pro-Level System
Here is a combined framework:
System: Trend + Volatility Edge Credit Spread System
Entry Conditions
Trend confirmed on daily chart (above 20/50 EMA)
IVR > 50
ATR stable
Liquidity high
Strategy
Sell bull put spread in uptrend
Sell bear call spread in downtrend
Sell iron condor in sideways trend
Sizing & Risk
Max 2% risk per trade
Exit at 50% profit
Stop at 2× credit received
Adjustments
Roll out if breach within 5% of short strike
Convert into iron condor if volatility drops
Exit
Close 7 days before expiry
Time stop after 12 trading days
A simple system like this can generate consistent returns if traded with discipline.
Conclusion – What Makes a System Truly Professional
A Pro Option Trading System is not magic—it is a disciplined, quantifiable, repeatable framework that removes emotions and adds structure. It blends:
Market classification
Strategy modules
Strict entry/exit rules
Risk management
Adjustments
Psychological control
Backtesting data
Meta Platforms: The Next two Trillion-Dollar AI WinnerHello,
Meta Platforms, Inc. is one of the world’s most dominant digital ecosystems, operating Facebook, Instagram, WhatsApp, and Messenger under its Family of Apps (FoA) segment, while simultaneously building the next frontier of computing through Reality Labs (RL), which focuses on virtual and augmented reality hardware, software, and immersive experiences. Founded in 2004 and headquartered in Menlo Park, California, the company has evolved into the backbone of global digital communication and advertising.
Financial performance has been exceptionally strong. For the full year 2024, total revenue rose to USD 164.50B from USD 134.90B in 2023, reflecting powerful ad demand and platform engagement. Net income surged to USD 62.36B (2023: USD 39.10B), while EPS climbed to USD 24.61 from USD 15.19—a clear signal of rising profitability and capital efficiency. The balance sheet remains robust, with assets at USD 276.05B against liabilities of USD 93.42B. Even with total debt increasing to USD 49.77B, leverage remains conservative relative to the company’s cash generation capacity.
Momentum continued into Q3 2025. Revenue grew 26% year-over-year to USD 51.24B, supported by resilient advertising performance. Operating income increased to USD 20.54B, maintaining an impressive 40% operating margin despite cost pressures. The quarter included a one-off USD 15.93B tax charge tied to the One Big Beautiful Bill Act, which temporarily compressed net income to USD 2.71B and diluted EPS to USD 1.05. Excluding this one-time hit, underlying profitability remains very strong.
Meta’s competitive strengths are broad and durable. Its global reach across billions of users creates a social graph unmatched by any competitor. Its advertising engine—powered by proprietary data, high-performance AI models, and in-house silicon—continues to set the industry standard. The rapid rise of Reels demonstrates the company’s rare ability to compete with and neutralize emerging threats at scale. Reality Labs, although loss-making, places Meta at the front of the next computing paradigm with early leadership in VR through the Quest ecosystem.
Challenges exist: regulatory scrutiny, an aging Facebook demographic, persistent Reality Labs losses, and cultural shifts in online engagement. Yet these risks are strategic rather than existential. Meta’s size, cash flow, and technical depth give it exceptional resilience.
The company’s clearest upside lies in AI monetization. It is now embedding advanced AI assistants across WhatsApp, Instagram, and Messenger—turning its communication tools into personalized commerce and service hubs. AI-driven ad automation is increasing conversion efficiency for businesses, enhancing Meta’s pricing power. For creators, AI-powered editing, content generation, and virtual production tools can unlock new subscription-based business lines. WhatsApp Business is becoming a gateway for “AI employees” for SMEs, enabling Meta to charge for customer support and workflow automation at global scale. AI-enhanced discovery on Instagram and Facebook is already boosting engagement and ad inventory, while AI-powered commerce features open new revenue streams.
Meta is transitioning from a pure social media company into a multi-layered AI-first platform with unmatched global distribution. Revenue growth, margin resilience, and AI-driven monetization point to a business with accelerating earnings power. With strong fundamentals, powerful cash flows, and clear catalysts in AI integration, advertising automation, and WhatsApp monetization, the long-term upside remains compelling.
Strong Buy: Meta offers one of the most attractive risk-reward profiles in the large-cap tech universe. Its scale, AI capabilities, and monetization runway position it as a cornerstone long-term compounder with significant re-rating potential as AI-enabled services mature.
Medium term target: $ 840

INOXWIND Accumulation Zone – High Probability Upside Reversal INOXWIND is approaching a high-probability bullish reversal zone.
Price is currently sitting at long-term horizontal support while compressing inside a falling triangle pattern. This area has previously acted as a strong demand zone.
Key Bullish Signals:
🔹 1. Price near major support + triangle apex
The price is holding above long-term support and squeezing toward the triangle’s end — a zone where breakouts or sharp reversals often happen.
🔹 2. RSI deeply oversold (near 28–30)
RSI is at levels where previous reversals occurred, showing sellers are exhausted and downside momentum is weakening.
🔹 3. MACD losing bearish strength
The MACD histogram is flattening and the lines are preparing for a potential bullish crossover, indicating the downtrend is weakening.
🔹 4. Tight price compression forming a “price pipe”
Price action is tightening, which often precedes a volatile move — and with indicators oversold, the probability favors an upside bounce.
🎯 Bullish Expectation
If the support holds, INOXWIND may show a sharp relief rally toward:
₹140
₹150 trendline
And possibly higher if volume supports a breakout.
⚠️ Risk Disclaimer
Support breakdown below ₹130 will invalidate the bullish setup.
This is a study of chart behavior and probability only — not a buy/sell recommendation. Always do your own research and manage risk.
