Part 1 Master Candle Stick Patterns What Are Options?
Options are financial derivatives that give you the right, but not the obligation, to buy or sell an underlying asset at a predetermined price (called the strike price) on or before a certain date (called the expiry).
There are two main types:
1. Call Option
A Call Option gives you the right to buy the underlying asset at the strike price.
You buy a call when:
You expect the price to rise.
You want limited risk but unlimited profit potential.
2. Put Option
A Put Option gives you the right to sell the underlying asset at the strike price.
You buy a put when:
You expect the price to fall.
You want to hedge against downside.
In India (NSE), the underlying asset can be:
Index (Nifty, Bank Nifty, Fin Nifty)
Stocks (Reliance, TCS, HDFC Bank, etc.)
Wave Analysis

Common Mistakes Traders Make with OI Analysis1. Assuming Rising OI Always Means Trend Continuation
A widespread misconception is that rising OI always confirms the current price trend. This is not always true. OI increases whenever new positions are added, but it does not tell us whether those positions are long or short.
If price rises and OI rises, traders often assume “trend is strong.”
But this could be short sellers entering aggressively, expecting a reversal.
Similarly, a falling market with rising OI could represent fresh long build-up by contrarian traders.
Why this is dangerous:
Misreading this combination can trick traders into continuing with a trend that is near exhaustion.
Correct approach:
Always read OI along with volume, price action, and context rather than in isolation.
2. Ignoring the Impact of Expiry Week
During expiry week, OI behaves very differently. Many traders fail to adjust for this.
Positions are squared off.
New positions are not added in large numbers.
Premiums decay rapidly.
Large players use rollovers that distort OI patterns.
Hence, traditional OI interpretations—long buildup, short covering, etc.—often fail because traders misread expiry-related unwinding as trend reversal.
Correct approach:
During expiry, interpret OI with caution and focus more on price action and volume rather than OI signals alone.
3. Not Understanding Rollovers in Futures OI
Many beginners assume rising OI in the near-month futures means new positions are being built. Instead, what might actually be happening is:
Positions shifting from near-month to next-month contracts.
Hedging activity by institutions.
Calendar spreads that distort near-month OI data.
This mistake leads traders to overestimate trend strength.
Correct approach:
Study OI across all three series (near, next, and far) to understand rollover behavior properly.
4. Misinterpreting OI Changes Without Considering Volume
OI alone cannot confirm the strength of a move. Many traders rely only on OI changes without checking volume.
High OI + low volume = weak or misleading signal.
High volume + high OI = strong confirmation.
Low volume + decreasing OI during price rise often indicates a false breakout.
Volume validates OI. Ignoring it causes traders to enter trades without proper confirmation.
Correct approach:
Always combine OI with volume analysis for accurate interpretation.
5. Treating OI Spikes as Market Direction Indicators
Large spikes in OI sometimes occur because:
Institutions hedge large positions.
Market makers adjust exposure.
Spread trading activity increases.
Options sellers deploy neutral strategies like short straddles and strangles.
These do not indicate directional bias. Retail traders often mistake such spikes for bullish or bearish signals, resulting in incorrect directional trades.
Correct approach:
Identify whether the OI spike is due to directional positions or non-directional strategies (like option selling).
6. Misreading Options OI Without Understanding Option Selling
Options OI is heavily influenced by option writers, not buyers. Newer traders often assume:
Call OI rising → bullish
Put OI rising → bearish
In reality:
Call writers increase call OI when they expect resistance.
Put writers increase put OI when they expect support.
Hence call OI rising often signals resistance, not strength, while put OI rising signals support, not weakness.
Correct approach:
Always analyze OI from the perspective of option sellers, who dominate the market.
7. Forgetting That OI is a Lagging Indicator
OI does not update tick by tick. Many traders treat it like real-time data and make impulsive trades.
Because OI updates slowly:
Sudden intraday reversals may not immediately reflect in OI.
By the time OI suggests a trend is weakening, price may already have reversed.
Correct approach:
Use OI as a confirmation tool, not a primary signal generator.
8. Over-Reliance on OI Without Price Action
Some traders depend entirely on OI data and ignore charts altogether.
This can lead to:
Entering when price is in consolidation.
Missing out on key support/resistance levels.
Falling for traps created by short-term OI fluctuations.
OI cannot tell you the exact entry or exit point—price action provides that.
Correct approach:
Use OI to understand behind-the-scenes market behavior, but rely on price action for execution.
9. Not Accounting for Market Maker Adjustments
Market makers frequently adjust their books, making OI fluctuate without real directional intent.
Retail traders often mistake this for trend-building activity.
These adjustments occur due to:
Delta hedging
Neutral strategies
Risk balancing
Changes in implied volatility
This can create misleading OI buildups or unwinding.
Correct approach:
Interpret OI only after analyzing IV trends, premiums, and market structure.
10. Ignoring the Broader Market Environment
OI signals lose meaning in certain market conditions:
High volatility
Major news events
Budget or RBI announcements
Global market shocks
Overnight gaps
During these periods, traders still try to use OI to predict short-term moves and end up getting trapped.
Correct approach:
In high-event environments, reduce the weight of OI analysis and rely more on price structure and risk management.
11. Believing That OI is a Predictive Tool
Many traders expect OI to tell them in advance:
When a breakout will happen
Which way the market will move
How strong the move will be
But OI is not predictive—it only shows participation, not intention.
This belief causes false confidence and poor decision-making.
Correct approach:
Treat OI as a supporting indicator, not a forecasting tool.
12. Not Adjusting OI Interpretation for Different Instruments
OI behaves differently in:
Index options
Stock options
Futures
Weekly vs monthly expiries
Applying the same OI interpretation across all instruments is a major mistake. For example:
Stock options have lower liquidity → OI signals are weaker.
Index options have high liquidity → OI signals are more reliable.
Correct approach:
Know the nature of the instrument before applying OI analysis.
Conclusion
OI is extremely powerful, but only when interpreted correctly. Most traders misuse it by treating it as a direct prediction tool rather than a secondary confirmation metric. The key to avoiding mistakes is to use OI together with price action, volume, volatility, and overall market context. Understanding that OI represents participation—not direction—helps traders avoid false assumptions and make better-informed decisions.
Top-Performing Companies Across Different PLI CategoriesElectronics and Semiconductor Sector
The electronics and semiconductor sector is one of the most significant beneficiaries of the PLI scheme. India’s ambition to become a global electronics manufacturing hub has seen major players expand operations under the scheme.
Key Performing Companies:
Foxconn India: A global contract manufacturer, Foxconn has leveraged PLI incentives to expand smartphone assembly lines and component production in India, catering to both domestic demand and exports.
Wistron and Pegatron: These Taiwanese companies have aggressively increased manufacturing capacities, focusing on consumer electronics such as smartphones and laptops.
Lava International and Micromax: Indian brands have utilized PLI support to enhance their supply chains, localize manufacturing, and remain competitive against international players.
These companies have shown exceptional growth in production volumes and employment generation, highlighting the success of PLI in promoting electronics manufacturing.
Pharmaceuticals and Medical Devices
The pharmaceuticals and medical devices sector is a critical area of focus under the PLI scheme, especially in light of global demand for affordable and high-quality healthcare products.
Top Performers:
Sun Pharma: Leveraging PLI benefits, Sun Pharma has expanded its manufacturing of critical APIs (Active Pharmaceutical Ingredients) to meet both domestic and international demand.
Cipla and Lupin: These companies have enhanced production capacities in high-demand therapeutic segments such as cardiovascular, anti-infectives, and diabetes medications.
Trivitron Healthcare: A key player in medical devices, Trivitron has scaled up production of diagnostic and surgical equipment, supported by PLI incentives.
These companies’ performance demonstrates the PLI scheme’s potential in enhancing India’s self-reliance in healthcare and reducing dependence on imports.
Automobile and Auto Components
The PLI scheme has also targeted the automotive sector, particularly electric vehicles (EVs) and advanced automotive components.
Leading Companies:
Tata Motors: With a focus on EV production, Tata Motors has utilized PLI incentives to expand EV manufacturing, batteries, and related components.
Mahindra Electric: Mahindra Electric has capitalized on PLI support to boost EV innovation and production, aiming to increase domestic adoption.
Bosch India: As a leading auto components manufacturer, Bosch has invested in next-generation automotive technologies including EV systems, sensors, and power electronics.
These companies are not only benefiting from financial incentives but are also driving India’s transition to sustainable mobility and smart automotive solutions.
Textiles and Apparel
The textiles and apparel sector has seen a transformative impact under the PLI scheme, especially in enhancing value addition and export competitiveness.
Top Performing Companies:
Arvind Ltd: A leader in textiles, Arvind has leveraged PLI incentives to scale up high-end apparel production and integrate advanced technologies.
Welspun India: Focused on home textiles and high-quality fabrics, Welspun has expanded production capacities and strengthened its export footprint.
Raymond Ltd: With investments in innovative textiles and premium apparel, Raymond has utilized PLI support to modernize operations and maintain market leadership.
These companies illustrate how PLI incentives are fostering quality enhancement, higher employment, and export growth in India’s textile industry.
Food Processing Industry
The PLI scheme aims to boost India’s food processing sector, which has enormous potential due to the country’s agricultural base.
High Performers:
Amul (Gujarat Cooperative Milk Marketing Federation): Amul has expanded value-added dairy production with PLI support, ensuring higher efficiency and export readiness.
ITC Ltd: ITC has leveraged the PLI scheme to enhance processed food production, particularly ready-to-eat and packaged goods, for both domestic and international markets.
Parle Agro: PLI incentives have helped Parle Agro scale production lines for beverages and packaged foods, enhancing competitiveness and market share.
These companies demonstrate the PLI scheme’s ability to strengthen India’s food processing ecosystem, reduce wastage, and promote global competitiveness.
Advanced Chemistry Cell (ACC) and Battery Manufacturing
The rise of EVs and renewable energy has increased demand for advanced batteries. The ACC and battery manufacturing category under PLI aims to establish India as a hub for battery production.
Leading Companies:
Exide Industries: Exide has expanded lithium-ion and lead-acid battery manufacturing, leveraging PLI incentives to modernize plants and boost capacity.
Amara Raja Batteries: Focused on automotive and stationary energy storage solutions, Amara Raja has invested in R&D and production expansion.
Tata Chemicals: Diversifying into advanced battery materials, Tata Chemicals has used PLI support to strengthen supply chains for lithium and other key materials.
These investments are critical for India’s EV ambitions and energy transition goals.
Impact on Employment and Exports
The companies benefiting from the PLI scheme have not only scaled production but also created significant employment opportunities. Manufacturing facilities often require skilled and semi-skilled labor, providing job creation in tier-2 and tier-3 cities. Moreover, enhanced production capacities have boosted exports, enabling India to compete with global players in sectors like electronics, pharmaceuticals, textiles, and EV batteries.
Challenges and Future Outlook
Despite strong performance, companies face challenges such as supply chain constraints, competition from global manufacturers, and technology gaps. However, continued PLI support, combined with strategic investments, can help overcome these hurdles.
Looking ahead, sectors like electronics, EVs, advanced batteries, and pharmaceuticals are expected to continue leading under the PLI scheme. Companies that invest in innovation, technology localization, and skill development will likely emerge as the most successful beneficiaries.
Conclusion
The PLI scheme has been a game-changer for India’s manufacturing ecosystem, with top-performing companies across various sectors demonstrating its potential. From electronics and pharmaceuticals to automotive, textiles, and food processing, PLI incentives have enabled companies to scale production, enhance exports, and create employment. Companies like Foxconn, Sun Pharma, Tata Motors, Arvind Ltd, and Amul exemplify the transformative impact of the scheme. As India continues to focus on self-reliance and global competitiveness, the PLI scheme will remain a crucial driver of industrial growth and economic development.

Advanced Trading Methods 1. Multi-Timeframe Analysis (MTFA)
One of the most powerful advanced methods is multi-timeframe analysis. Instead of relying on a single chart, traders study the market on higher and lower timeframes simultaneously. Higher timeframes reveal the dominant trend, while lower timeframes help identify precise entries and exits.
For example:
Weekly chart → Determines long-term trend direction.
Daily chart → Confirms momentum and key levels.
Hourly chart → Provides exact entry zones.
Professional traders avoid fighting the higher-timeframe trend. MTFA blends strategic vision with tactical timing, reducing false signals and increasing trade accuracy.
2. Order Flow and Volume Profile Trading
Order flow analysis helps traders “see behind the candles.” It focuses on:
Market orders
Limit orders
Bid-ask imbalances
Liquidity pockets
Stop-run zones
The Volume Profile is a cornerstone of order-flow trading. It shows where the highest and lowest trading activity occurred at specific price levels. Key concepts include:
Value Area High (VAH)
Value Area Low (VAL)
Point of Control (POC)
These levels act as strong magnets for price, often defining areas of trend continuation, breakout, or reversal. Traders use this method to avoid low-probability trades and focus on areas of institutional interest.
3. Algorithmic and Quantitative Trading
Advanced traders increasingly rely on algorithms and quantitative models. These systems remove emotion, reduce human error, and allow rapid execution based on predefined rules.
Key components of algo-trading include:
Statistical modeling
Backtesting and optimization
Automated pattern recognition
High-frequency execution
Machine learning models
Popular strategies in quant trading:
Mean reversion
Statistical arbitrage
Momentum trading
Pairs trading
Volatility-based systems
These methods require programming knowledge, access to data feeds, and robust risk controls, but they provide exceptional consistency when executed properly.
4. Harmonic and Pattern-Based Trading
Advanced traders often use harmonic patterns based on Fibonacci ratios to predict high-probability reversal points. These include:
Gartley
Butterfly
Bat
Crab
Cypher
Each pattern represents a specific geometric structure in price action. Traders use them to forecast potential turning zones, also called PRZ (Potential Reversal Zone). Combined with support/resistance and volume, harmonic patterns identify precise entries with tight stop-losses.
5. Advanced Options Strategies
Options trading opens the door to several sophisticated strategies that allow traders to profit from directional, neutral, or volatility-based market conditions.
Popular advanced strategies:
Iron Condor (range-bound income generation)
Butterfly Spread (low-cost directional bets)
Calendar Spread (time decay advantage)
Straddle/Strangle (volatility breakouts)
Ratio Spreads (controlled risk with enhanced reward)
Options also allow hedging, portfolio insurance, and income generation techniques unavailable in simple stock trading.
6. Smart Money Concepts (SMC)
SMC is an advanced methodology based on institutional trading behavior. It focuses on liquidity, manipulation, and market structure rather than indicators.
Core elements include:
Break of Structure (BOS)
Change of Character (ChoCH)
Fair Value Gaps (FVG)
Liquidity Pools
Order Blocks
These concepts teach traders why price moves, not just how. SMC traders aim to enter at institutional footprints and ride moves driven by large capital flows.
7. Advanced Risk and Money Management Models
The best trading method fails without proper risk control. Professional traders apply mathematical risk models such as:
a. Kelly Criterion
Determines optimal position size to maximize long-term growth while controlling drawdowns.
b. Value-at-Risk (VaR)
Estimates the maximum expected loss under normal market conditions.
c. Risk-to-Reward Optimization
Ensures trades have statistically favorable outcomes.
d. Portfolio Correlation Analysis
Prevents over-exposure to highly correlated trades.
Advanced money management prioritizes capital preservation, knowing that survival in the market leads to long-term profitability.
8. Sentiment Analysis and Behavioral Trading
Market sentiment often drives price more than fundamental or technical factors. Advanced traders incorporate sentiment indicators such as:
Commitment of Traders Report (COT)
Fear & Greed Index
Options put-call ratio
Social media analytics (especially in crypto)
Institutional positioning data
They also apply behavioral finance concepts like herd mentality, confirmation bias, loss aversion, and overconfidence to anticipate irrational price moves driven by emotions.
9. News-Based and Event-Driven Trading
Institutional traders rely heavily on event-driven strategies. These include:
Trading earnings reports
Central bank announcements
Budget releases
Geopolitical events
Economic indicators (CPI, GDP, PMI, unemployment)
Volatility during news events creates large opportunities but also increased risk. Advanced traders use:
Straddles/strangles for volatility spikes
Pre-positioning based on expected outcomes
Quick scalps during liquidity surges
To manage risk, they may use hedging or dynamic stop-losses.
10. Arbitrage and Market Inefficiency Exploitation
Arbitrage involves profiting from price discrepancies in different markets. Types include:
Spatial arbitrage (different exchanges)
Cross-asset arbitrage (related securities)
Triangular arbitrage (forex mispricing)
Index arbitrage (index vs futures price gap)
Although often used by high-frequency firms, some opportunities still exist for well-equipped retail traders.
11. Advanced Technical Indicators and Custom Models
Professional traders often build custom indicators to fit their strategies. Examples include:
Multi-layer moving averages
Adaptive RSI
Market regime filters
Volatility-adjusted ATR stops
Custom tools enhance accuracy and reduce signal noise, helping traders align with the market environment.
12. Trading Psychology Mastery
The most advanced trading method is internal: psychological discipline. Elite traders maintain:
Emotional neutrality
Patience
Consistency
Rule-based execution
Non-reactiveness during volatility
Methods like journaling, meditation, and simulation trading help strengthen emotional control, turning mindset into a competitive advantage.
Conclusion
Advanced trading methods combine technology, mathematics, psychology, and market structure to produce a powerful and systematic approach to trading. Whether through algorithmic systems, order flow analysis, SMC, options strategies, arbitrage, or multi-timeframe technicals, the goal remains the same: to trade with precision, discipline, and statistical edge. Mastering these methods elevates a trader from basic decision-making to professional-grade execution, increasing profitability and long-term consistency.
Elliott Wave Analysis XAUUSD – 28/11/2025Hello my friends, let’s update the Elliott Wave analysis on Gold together to see how the wave development may unfold today.
1. Momentum
Momentum D1
D1 momentum is currently contracting. We need to wait for a strong bearish daily close to confirm a momentum reversal. Once confirmed, the market may enter a downward phase lasting 4–5 days.
Momentum H4
H4 momentum is also narrowing, suggesting a potential short-term downside reversal. However, note the following:
• Price highs and momentum highs are forming higher highs and higher lows, which still supports the bullish structure.
• If H4 momentum truly reverses and moves into the oversold zone, price must break below 4142 to confirm a structural break and signal a genuine trend reversal.
Momentum H1
H1 momentum is turning downward and is aligned with H4. I expect the current price area to be the potential wave top.
________________________________________
2. Wave Structure
Wave Structure D1
The D1 wave structure remains unchanged. With D1 momentum still converging, price action continues to show slow upward movement.
• If price breaks above 4243, the 5-wave structure of the purple Y wave is invalidated.
• In that case, a different wave structure will be triggered (as mentioned in the previous plan), and I will update you when it occurs.
Wave Structure H4
We continue to follow the green ABC corrective structure, with price currently in wave C (green).
• As H4 momentum is in the overbought zone, I expect the current region to be the top of wave C.
• If H4 momentum dips into the oversold zone and price breaks below 4142, this will confirm a structural breakdown.
• However, if momentum enters oversold while price stays above 4142, we must be prepared for a continued bullish move.
Wave Structure H1
Yesterday, the RSI on H1 showed divergence, suggesting a possible completion of wave C. However, with the additional push during the Asian session, wave C likely extended further. Price is now at the target zone calculated earlier.
• With D1, H4, and H1 momentum all preparing to reverse, I expect the current price zone to be the top of wave C.
________________________________________
3. Trading Plan
The current price region remains our preferred SELL zone.
During the next H4 momentum cycle:
• If momentum enters the oversold zone but price fails to break below 4142, we should consider exiting early to protect capital.
Trade Setup
• Sell Zone: 4187 – 4190
• Stop Loss (SL): 4210
• TP1: 4158
• TP2: 4112
• TP3: 4081

ADANIENT - Eying 2700 on this corrective rise?
TF: Daily
CMP: 2462
From the lows at 1964, The swings are overlapping, making it a corrective move/structure overall.
This leg appears to be the Y wave up in the corrective WXY rise and could potentially reach 2700-2750 levels. Just so you know/observe, The zone also happens to be the confluence of the unfilled GAP area.
IN the shorter TF, the price is about to complete it's A wave and one can wait for the B wave to end in order to initiate a trade for the C wave rise.
Shorter TF counts are marked below for better understanding.
Just because the price is expected to reverse, don't try to take a short trade.. B waves are to be avoided at best.
Disclaimer: I am not a SEBI registered Analyst and this is not a trading advise. Views are personal and for educational purpose only. Please consult your Financial Advisor for any investment decisions. Please consider my views only to get a different perspective (FOR or AGAINST your views). Please don't trade FNO based on my views. If you like my analysis and learnt something from it, please give a BOOST. Feel free to express your thoughts and questions in the comments section.

Rising wedge patternA leading diagonal is a five-wave Elliott Wave pattern that occurs at the beginning of a trend, found in wave 1 or A, and signals a continuation of the trend. It differs from an impulse wave by having a 5-3-5-3-5 internal structure and features the overlap of waves 4 and 1. Leading diagonals appear as converging wedge shapes and can be either contracting or expanding.
Best Timeframes for Candle PatternsCommon Mistakes Traders Make
Relying only on candle patterns without context
Trading patterns blindly without trend confirmation
Not waiting for candle close
Ignoring volume
Forcing patterns where there are none
Using too many candlestick rules
Candlestick patterns should be signals, not guarantees.

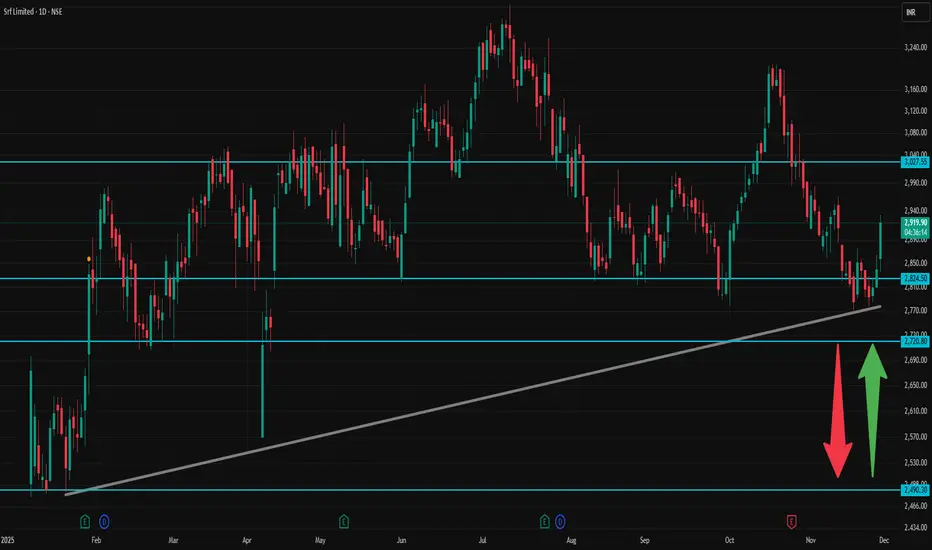
SRF 1 Day Time Frame ✅ Current context
According to public price data, SRF’s recent high for the day is ~ ₹ 2,933, low ~ ₹ 2,836.80.
As per a technical‑analysis summary: moving averages (short-to-medium term) and oscillators on daily timeframe show a bullish bias (Strong Buy on many signals).
🎯 How to interpret / trade with these levels
As long as price stays above Pivot (~₹ 2,866), bias remains mildly bullish — look for R1 → R2 → R3 as possible targets.
If momentum is strong (volume + positive broader market), a break above R2 (~₹ 2,920) could push toward R3 (~₹ 2,933–2,937+).
On downside, supports at ₹ 2,811.93 → ₹ 2,783.87 → ₹ 2,757.73 are key — loss of S1 may open S2/S3.
For conservative traders: good entry or add-on zones could be near S1 or pivot, with stop‑loss a little below S2/S3 depending on risk tolerance.
⚠️ Important caveats
These are static pivot-based levels, and real market moves may overshoot or not respect them depending on news, volume, macro‑market sentiment.
Given volatility (as seen in day’s high-low range), levels above R2 or below S2 can get tested — intraday discipline (stop-loss, position sizing) is crucial.
Always watch volume, overall index trend (Nifty/Sensex), sector news — technical levels work better when confirmed by context.
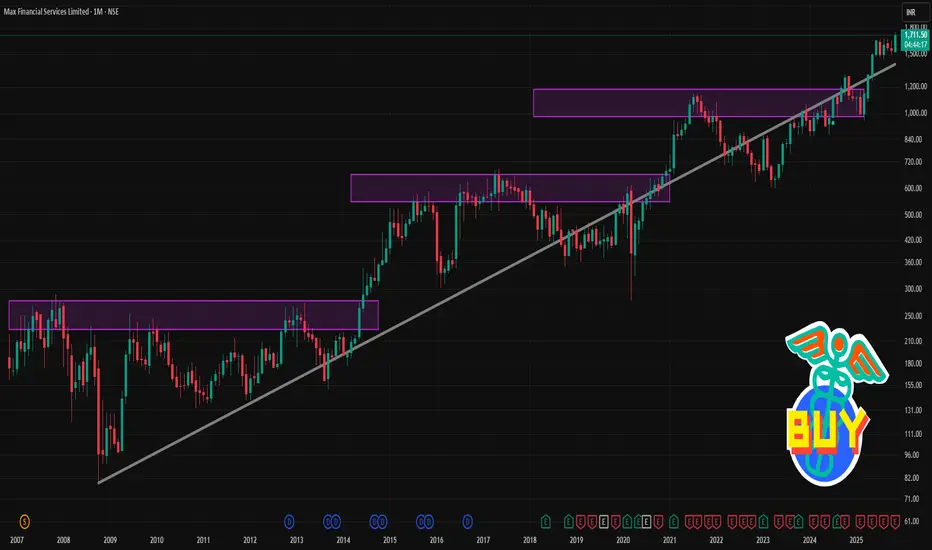
MFSL 1 Month Time Frame 📊 Key Price / Recent Performance
Recent close: ~₹1,736.70.
52‑week high ≈ ₹1,751.40; 52‑week low ≈ ₹950.00.
Over the past 1 month, MFSL is up by roughly 8 – 9 %.
According to recent technical‑level analyses:
Level Price (INR)
Support 1 (near‑term) ~₹1,677.8 – ₹1,678.0
Support 2 ~₹1,645 – ₹1,657.6
Support 3 / lower band ~₹1,621.9
Pivot / Recent support‑resistance zone ~₹1,731 – ₹1,735
Resistance 1 (near‑term) ~₹1,742.9 – ₹1,750
Resistance 2 / Upper band ~₹1,772 – ₹1,828 (medium‑term / next resistance zone)
On a daily pivot‑point basis, according to one screener, MFSL is currently trading above the “Camarilla R2,” indicating bullish intraday bias.
From trend perspective: 20‑day, 50‑day, 100‑day, and 200‑day moving averages are all below the current price — a bullish structural sign.
XAG/USD bullish setupSilver is an bullish scenario for an Target of 63$, Correction is completed now, Soon an impulse is expected.

XAUUSD Outlook: Recent Gains Have Been Quite Steady!The market outlook for XAUUSD remains clearly optimistic. The latest price movement has shown a steady recovery, pushing towards the upper boundary of the newly forecasted price channel. This presents another excellent opportunity to get involved.
The market may be in the early stages of a strong new bullish leg. We could also see some consolidation or a short-term pullback before continuing towards the upper boundary, but I believe the second scenario is more likely.
My target would be 4,350.

ICICIBANK - Inverted Head & Shoulder suggests 1450ICICI Bank has completed a clean Inverted Head and Shoulders pattern on the 4H chart, signalling a possible trend reversal after the recent downtrend. The left shoulder formed near 1360 , the head at 1317 , and the right shoulder at 1354 . All three points reflect stronger structure and consistent buying interest on dips. The stock has now crossed the neckline around 1387–1390 , a zone where it faced repeated rejection earlier. This breakout shows that buyers have finally taken control.
If the price continues to hold above the neckline, momentum is likely to push it toward the projected target of 1440–1450 , which matches the “final destination” zone shown on your chart. The breakout would lose strength only if the price falls back below 1387 , but unless that happens, the pattern suggests the move still has room to extend higher.

BTCUSD - Wave 5 Decline Still Likely AheadPrevious Analysis:
BTC is approaching a critical reaction zone where the current rise looks more like a corrective push than the start of a new trend. Price is moving toward the highlighted supply region, which aligns with a potential wave 4 completion inside the descending channel. The structure from the recent low shows an internal a–b–c formation, suggesting this bounce could run into exhaustion as it enters the red zone. Unless BTC breaks out of the channel with conviction, the broader momentum still leans bearish. A rejection from this region would likely trigger the final wave 5 leg, driving price toward deeper Fibonacci levels and completing the corrective cycle before any meaningful recovery attempt can begin.
Stay Tuned!
@Money_Dictators

USD/JPY short term buyAs per wave analysis USD/JPY one more wave needs to be extended for an target of 157.866. One can look for buy side in short term.

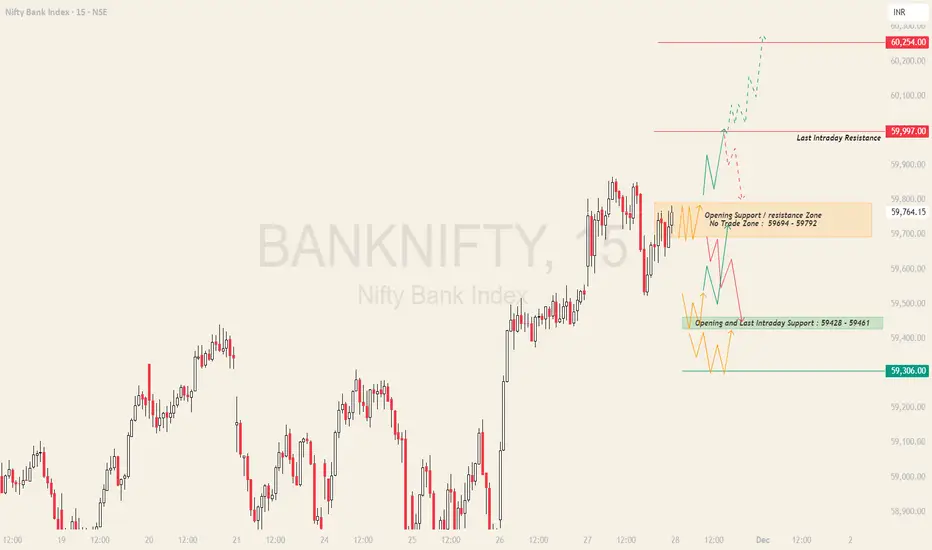
BANKNIFTY : Trading levels and Plan for 28-Nov-2025📊 BANKNIFTY TRADING PLAN — 28 NOV 2025
BankNifty closed near 59,764, sitting just below a very important Opening Support / Resistance Zone (59,694 – 59,792), which is also marked as a No-Trade Zone due to expected volatility.
Price is currently between a major overhead resistance (59,997) and a strong downside support zone (59,428 – 59,461).
This makes the opening candle extremely important.
🔍 Key Intraday Levels
🟧 Opening Support / Resistance Zone (No Trade Zone): 59,694 – 59,792
🟥 Last Intraday Resistance: 59,997
🟥 Profit Booking Zone: 60,254
🟩 Opening & Last Intraday Support: 59,428 – 59,461
🟩 Major Downside Support: 59,306
🟢 SCENARIO 1 — GAP-UP OPENING (200+ Points)
If BankNifty opens around 59,900–60,000, price enters directly into strong resistance.
A sustained breakout above 59,997 for 10–15 minutes →
⭐ Upside continuation targets → 60,120 → 60,180 → 60,254
(Profit booking zone — avoid fresh longs here)
If price rejects from 59,997 with long upper wicks →
Expect a pullback towards → 59,792 → 59,694
Avoid immediate buying — gap-up at resistance often causes sharp reversals.
Best long trade setup →
Breakout above 59,997 → Retest → Strong bullish candle → Long.
📘 Educational Note:
Gap-ups into resistance must be treated with caution. Volume confirmation is essential before taking continuation trades.
🟧 SCENARIO 2 — FLAT OPENING (Near 59,700–59,780)
A flat open places price inside the No-Trade Zone (59,694–59,792) — a choppy area.
Avoid taking positions inside this zone — unreliable signals and fake breakouts are common.
Breakout above 59,792 →
Upside targets → 59,900 → 59,997
Breakdown below 59,694 →
Downside targets → 59,550 → 59,461
Best trades occur OUTSIDE the zone:
✔️ Breakout above 59,792
✔️ Breakdown below 59,694
✔️ Support bounce from 59,428–59,461 (strong reversal zone)
💡 Educational Tip:
Flat openings are perfect for identifying trend. Let the first 15-min candle decide the direction — patience pays.
🔻 SCENARIO 3 — GAP-DOWN OPENING (200+ Points)
A gap-down opening around 59,450–59,500 brings price directly into the Opening Support Zone (59,428–59,461).
If support at 59,428–59,461 holds with bullish wick rejection →
Reversal targets → 59,550 → 59,694 → 59,792
If price breaks below 59,428, expect fast downside:
➡️ 59,360 → 59,306
A sharp bounce from 59,306 can offer a low-risk long opportunity.
If all supports fail with momentum →
Extends toward → 59,200 → 59,140
📘 Educational Note:
Gap-down openings into strong support zones often give powerful reversal trades — but only after confirmation of higher lows or bullish structure.
💼 RISK MANAGEMENT TIPS FOR OPTION TRADERS 💡
Avoid trading in the first 5 minutes — especially on gap openings.
Prefer ATM or ITM options for directional trades.
Never average a losing trade — theta decay punishes weak decisions.
Use structure-based SLs, not random premium SLs.
Book partial profits near key zones like 59,997 & 60,254.
When VIX is low → Option buying works better.
When VIX is high → Use hedged selling strategies.
⚠️ Golden Rule:
Your first job is to protect capital. The second job is to catch trends. No capital = no trading.
📌 SUMMARY
Bullish Above → 59,792
Targets → 59,900 → 59,997 → 60,120 → 60,254
Bearish Below → 59,694
Targets → 59,550 → 59,461 → 59,428 → 59,306
Strong Reversal Zones:
🟩 59,428–59,461 (Buyers’ defense zone)
🟥 59,997–60,254 (Profit booking & seller zone)
Highest-Risk Zone:
🟧 59,694–59,792 (No-Trade Zone) — avoid entries here.
🧾 CONCLUSION
BankNifty is positioned between important support and resistance clusters.
The market direction for 28-Nov will strongly depend on whether price:
✔️ Breaks out above 59,792
✔️ Rejects from 59,997
✔️ Reverses from 59,428
✔️ Breaks below 59,428 for deeper downside
Trade clean levels, avoid the No-Trade Zone, and let the structure guide your entries — not emotions.
⚠️ DISCLAIMER
I am not a SEBI-registered analyst.
This analysis is for educational purposes only.
Please consult a certified financial advisor before trading or investing.
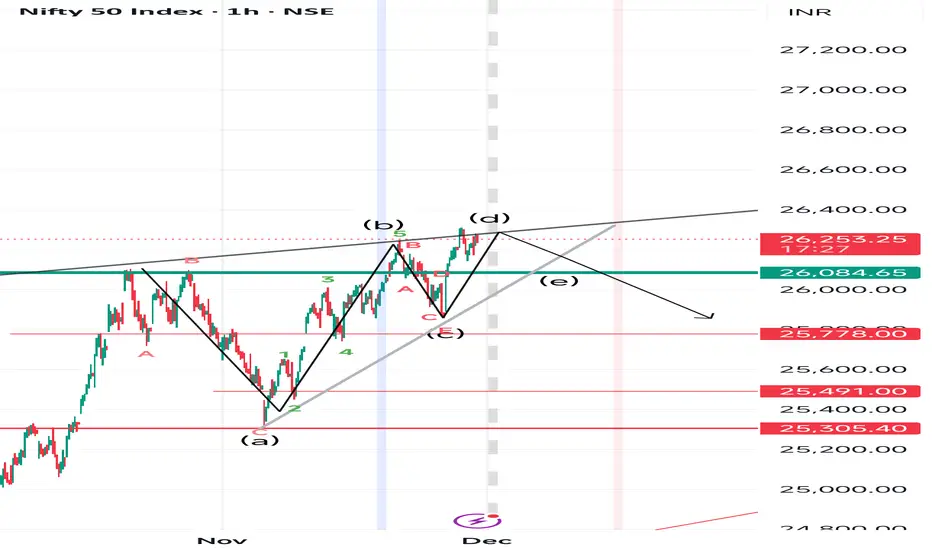
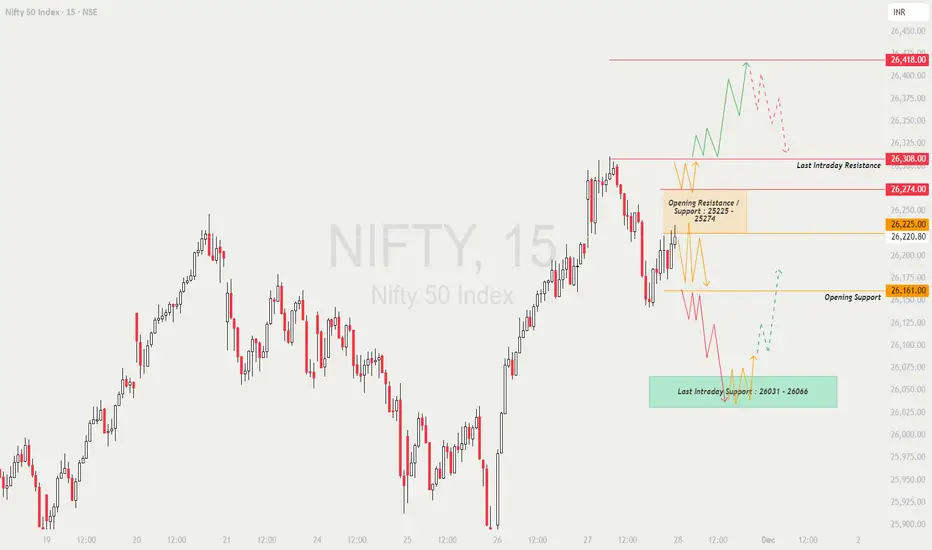
NIFTY : Trading levels and Plan for 28-Nov-2025📊 NIFTY TRADING PLAN — 28 NOV 2025
Nifty closed around 26,220, after bouncing strongly from lower levels and now sitting just below an important Opening Resistance / Support Zone (26,225–26,274).
The market is positioned between major overhead resistance and key intraday support.
This increases the importance of the opening direction.
Key Intraday Levels
🟧 Opening Resistance / Support Zone: 26,225 – 26,274
🟥 Last Intraday Resistance: 26,308
🟥 Profit Booking Zone: 26,418
🟩 Opening Support: 26,161
🟩 Last Intraday Support: 26,031 – 26,066
🟢 SCENARIO 1 — GAP-UP OPENING (100+ Points)
If Nifty opens around 26,300–26,350, it directly enters the resistance territory.
If price sustains ABOVE 26,308 for 10–15 minutes →
⭐ Expect bullish continuation toward → 26,360 → 26,395 → 26,418
If Nifty rejects 26,308 with sharp wicks →
Expect pullback toward → 26,274 → 26,225
Avoid long entries immediately at open — gap-ups near resistance can cause bull traps.
Best long setup = Breakout → Retest above 26,308 → Continuation.
📘 Educational Note:
Resistance-based gap-ups often create volatility. Always wait for confirmation candles, not emotional entries.
🟧 SCENARIO 2 — FLAT OPENING (26,200–26,250 Range)
A flat open places Nifty inside or just below the Opening Resistance / Support Zone.
A breakout above 26,274 →
Targets → 26,308 → 26,360 → 26,418
Failure to sustain above the zone may drag price back to 26,161.
Inside the 26,225–26,274 zone →
No high-probability trade. Avoid jumping into noise.
Best trades:
✔️ Breakout retest above 26,274
✔️ Breakdown below 26,161
✔️ Long from Last Intraday Support 26,031–26,066 (strong bounce zone)
💡 Educational Tip:
Flat openings provide the most reliable trend insight through the first 15-min candle. Let price choose direction — don’t force trades.
🔻 SCENARIO 3 — GAP-DOWN OPENING (100+ Points)
A gap-down around 26,080–26,120 brings Nifty near the Opening Support (26,161) area.
If price rejects 26,161 with bullish wick →
Reversal targets → 26,200 → 26,225 → 26,274
If price breaks 26,161 decisively →
Price will slide quickly toward the big support → 26,031–26,066
A strong bounce at 26,031–26,066 offers an attractive long opportunity.
If 26,031 breaks with momentum →
Expect downside extension → 25,980 → 25,940
📘 Educational Note:
Gap-downs into support often give excellent reversal trades — but NEVER without confirmation.
Watch for higher lows or bullish engulfing candles.
💼 RISK MANAGEMENT TIPS FOR OPTION TRADERS 💡
Avoid the first 5 minutes — large gap openings often reverse quickly.
Use ATM or ITM options for directional momentum.
NEVER average a losing option trade.
Use fixed SL based on structure, not on premium.
When VIX is low → prefer option buying.
When VIX is high → hedged option selling is safer.
Book partial profits near resistance zones like 26,308 & 26,418.
⚠️ Golden Rule:
Protect your capital first — good opportunities always come after clarity.
📌 SUMMARY
Bullish Above → 26,274
Targets → 26,308 → 26,360 → 26,418
Bearish Below → 26,161
Targets → 26,120 → 26,066 → 26,031 → 25,980
High-Risk Zones:
🟧 26,225–26,274 (Opening whipsaw zone)
🟥 26,308–26,418 (Profit booking region)
🧾 CONCLUSION
Nifty is approaching a strong overhead resistance zone, and the opening candle will decide whether we get a breakout continuation or a pullback day.
The highest-probability trades will come from:
✔️ Breakout retest above 26,274
✔️ Rejection / reversal at 26,308
✔️ Bounce from 26,031–26,066
✔️ Breakdown below 26,161 for momentum shorts
Trade only clean structures — avoid noise inside the middle consolidation zone.
⚠️ DISCLAIMER
I am not a SEBI-registered analyst.
This analysis is meant only for educational purposes.
Please consult a certified financial advisor before trading or investing.
GOLD 1H | PDH/PDL Compression Breakout • Cup & Handle + Rising WGOLD 1H – ICT + Price Action Analysis
Price is currently compressing between PDH (Previous Day High) and PDL (Previous Day Low) forming a rising wedge inside a broader cup & handle pattern.
🔹 Cup formation shows accumulation
🔹 Handle retest confirming buyers stepping in
🔹 Rising wedge indicates volatility squeeze
🔹 Price staying above PDL = bullish protection
🔹 PDH breakout expected if liquidity stays intact

Divergence Secrets Tips for Successful Option Trading
Always use stop-loss
Track IV and IV percentile
Learn market structure (trend, range, breakout)
Avoid buying options in low IV environments
Avoid selling options in highly trending markets
Maintain proper risk-to-reward
Never hold naked options till expiry if inexperienced
Focus on quality setups, not quantity

Part 2 Support and Resistance Factors That Affect Option Premium
(A) Underlying Price Movement
Bigger moves → bigger premium.
(B) Time Value
Longer time to expiry → higher premium.
(C) Volatility (IV)
Higher IV = expensive options
Lower IV = cheaper options
(D) Demand & Supply
High activity in a strike increases premium.
(E) Market Events
Events like:
RBI Policy
Budget
Elections
Earnings
Cause volatility spikes.

Part 1 Support and ResistanceWhy Option Trading Is Popular
(1) Low Capital Requirement
A trader can control large exposure by paying only premium.
(2) Risk Can Be Controlled
Option buyers lose only the premium, unlike futures.
(3) Multiple Strategies
Options allow endless combinations:
Directional trades
Hedge positions
Neutral trades
Volatility trades
Income trades
(4) Can Earn in Any Market
You can profit in:
✔ Uptrend
✔ Downtrend
✔ Sideways periods
✔ High volatility
✔ Low volatility

ANGELONE: MAKING H/Sangelone is making head shoulder with smooth neckline in dtf. entry and targets are given in chart.

Part 11 Trading Master Class How Call Options Work
A Call Option gives the buyer the right to buy the underlying asset at the strike price.
You buy a call when you expect the market to go up.
Example:
Nifty at 22,000
You buy 22,200 CE at ₹50 premium.
If Nifty moves to 22,400, the call becomes valuable.
Intrinsic value = 22,400 – 22,200 = ₹200
Profit = 200 – 50 = ₹150
But if Nifty stays below 22,200, your call expires worthless and you lose the premium.
Risk = ₹50
Reward = unlimited
