Wedgebreakout


Balaji Amines | Trendline BreakoutThere is a chance to wedge pattern breakout. Keep Watching or Breakout
Buy: Only if get a closing candle above 3214
Keep Stop loss Below 6%
Target will update

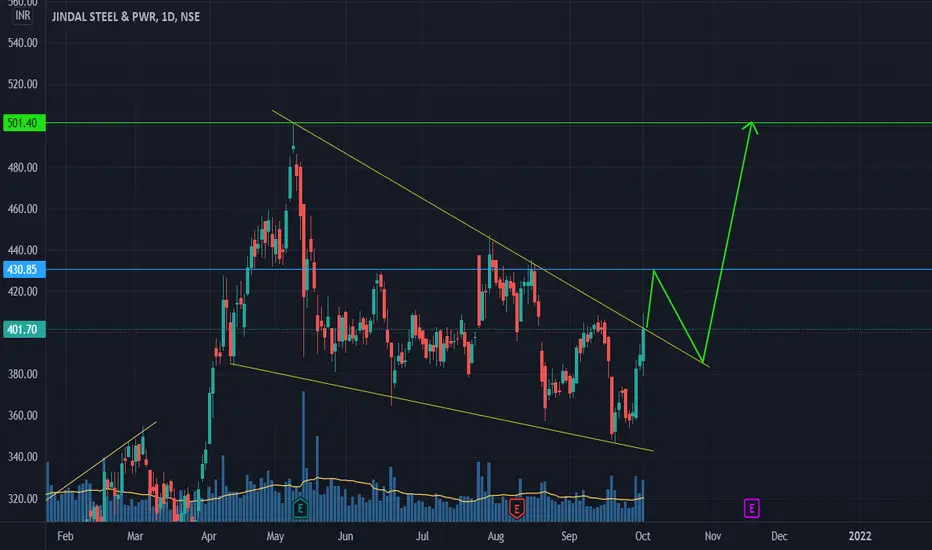
A huge wedge pattern with long consolidation in betweenThis pattern has 250++ bars or 1 year+ data.
it is sustaining above fib level 0.5 or 360-365.
There is a supply-demand conversion zone( golden) where it may face resistance.
Entry should be after a bullish candle at the golden zone or above 400(round level).
Next, there is hidden trendline (dashed) , which will act as a resistance.
How to trade?
initiate trade with a less quantity(60%) at the round level & when it touches the hidden trendline, retrace back to the 0.5 level from the previous swing
, and add more.
medium-term targets- 460, 520
SL-just below fib 0.5 level.
Happy Swing trading

UPL Target AchievedFollow me for more such breakouts if you also want these breakouts then contact me.
you'll be receiving the intraday and positional charts on a daily basisi.


NLCINDIA - Rising Wedge BreakOut (BO)#NLCINDIA
#Buy 88-89
#Target 115
#Stoploss 80 DCB (Daily Close Basis)
#ShortTerm (upto 3-4 Months)
Stoploss - 80 DCB (Daily Close Basis) means if Stock close below 80 value at 3:30PM (Market Close Time), then take exit at Next day


Price action screaming buy!! Or is it as simple as it looks?If we go by the textbook definition of a falling wedge pattern, the price consolidates between two downward sloping & converging lines forming a wedge shape. (Not as difficult as it sounds, just looks at the chart).
As per a common understanding of this pattern, the price continues higher after a breakout to the upside.
Price action in LIC Housing finance shows a nice breakout of the falling wedge pattern.
The price broke out with a strong candle and above-average volumes.
This is a perfect condition for a buy trade.
But wait, This is not the complete technical picture. Keep reading
We recently saw how a bullish Inverse head & shoulder pattern failed in HDFC, even though it had a perfect breakout condition, Positive news about the merger and almost all ideas on trading view were out rightly bullish. (Check HDFC idea in my profile, neutral and saved myself from loss)
If it were as simple as identifying a pattern and taking a trade, everyone would be making profits in the market.
Back to LIC Housing Finance:
Along with the falling wedge, there are other technical factors.
Two important levels to watch are the 200 days moving average, and the Horizontal S&R line at 389.25.
The price has taken support or resistance at this line multiple times in the past.
Let’s look at the positives first:
• Perfect falling wedge pattern & breakout with a strong candle and good volumes.
• MACD trending higher and in positive territory. RSI Strong, and other indicators in the positive territory.
• Price finished its correction exactly at 61.8% Fibonacci ratio with Price RSI positive divergence before the correction ended.
Now the Caution Signals:
• Price trading below Strong resistance line at 389.25 and struggling to cross above.
• Price below 200 days moving average (a strong resistance level). 200DMA currently trading at @400.
• Whole numbers are considered psychological S&R levels and 400 is a psychological level.
• Fibonacci 38.20% level @ 405.60 may act as minor resistance.
Combining these points, we get a strong resistance zone between 389 to 400 and minor resistance at 405.
A breakout above the wedge pattern is the first signal. The price has to breakout above the resistance zone.
If the breakout happens, wait for the price to retest 200dma or Horizontal line @ 389, whichever is higher at the time.
I give more weightage to Horizontal S&R lines because these are the points where most buyers/sellers are concentrated.
200DMA is definitely a strong resistance and there will be many sellers at this level.
I’m cautiously bullish on this stock.
The best way to avoid failure is to wait for the price to give us a confirmation.
I will be following the price movement closely and update this idea when I get a buy/sell signal. So follow me and stay tuned for the next update.
Post your comments. Let’s have a discussion.
Happy trading.
Co-Authors:
in.tradingview.com
in.tradingview.com
Disclaimer:
This is not buy/sell advice. Please do your due diligence before making any trading decision or consult your financial advisor.
Sharing my analysis and thoughts for a stronger and healthier community. Cheers

#Trade with Pattern (Rising Wedge )Hello Traders,
BankNifty making a rising wedge pattern from 9th-March.
whenever Breakout happens we can expect a good move.
I hope you all like my analysis. Follow me to get regular updates.
Please do share your thoughts in comment section.
Please Hit a LIKE, it motivates me to do analysis and do SHARE with your trading friends.

Adani Ready to Transmit some gainsChart coming out of a long wedge. Risk reward good.
Adani group stock. Can go places.

Nifty- Ending Diagonal-Buy trigger above 17960 Hello All,
Index is doing all choppy moves between 18065 & 17800 zone ( which is ongoing or running). A possible assumption can be a falling wedge or ending diagonal.
----------------------------------------------------------
Markets don't work on assumptions
----------------------------------------------------------
As a trader, never assume any wave-counts / patterns / indicators unless you get a trigger point + you need to manage your risk post getting the trigger which is the very important step - Risk management
---------------------------------------------------------------
Trading Strategy - Trigger & Stop Loss Levels
---------------------------------------------------------------
-----------------------
Safe Traders
-----------------------
[Buy Trigger is above 17960 / after trigger - manage your risk with stops below 17920 after buy trigger/
-----------------------
Risky Traders
-----------------------
You are risky trader then look close to 17800 withs stops below 17750 & Targets mentioned below.
Target 1 - 18065
Target 2 - 18135
Target 3 - 18318
Thanks

Bank Nifty, D Chart, Descending wedge PatternGet free calls
1) Equity short / long-term
2) Intraday option
Back test Performance
*** EquiStoX****

Bullish Wedge BreakoutNSE:SBIN
Learn and Earn .
SBIN will correct upto 485 levels.
Strong Q2 Results will push SBIN to new highs.
@akashkharade03

JKTYRE | Wedge breakout opportunity for 22%JKTYRE | Wedge breakout opportunity for 22%
CMP : 118
SL : 111
Target : 142
1:3+ risk reward setup


Swing SetupEXPLANATION : This is a 4 hour time frame chart of LARSEN & TOUBRO , It has formed Rising wedge pattern breakout also formed head and shoulder pattern . Ideal entry is breakout and retest of Rising wedge pattern & Right shoulder of head and shoulder pattern . Enter as per your setup .
If you like this analysis give a Like // Follow for more updates , let me know in comments below :)

Wedge Breakout on Daily chartBullish Wedge breakout. One can trade at a breakout and retest of the wedge pattern and also consider the horizontal resistance line shown in blue.
What are Falling and Rising Wedge Patterns?What Is the Wedge Pattern and Its Common Characteristics?
1. Wedge patterns have converging trend lines that come to an apex with a distinguishable upside or downside slant.
a. Wedge with an upside slant is called a rising wedge
b. Wedge with downside slant is called falling wedge
2. It has declining volumes as the pattern progresses
3. It breaks out from one of the trend lines
Why We Should Pay Attention to Wedge Patterns?
Some studies suggest that a wedge pattern will breakout towards a reversal rather than a continuation more often than two-thirds of the time. Therefore as the rule of thumb, people generally treat a falling wedge as a bullish pattern and a rising wedge as a bearish pattern , especially a falling wedge would be a more reliable reversal indicator than a rising wedge
Since we know a wedge pattern has a higher probability to reverse and due to the fact that the price of wedge pattern converges to a smaller area, we can trade the reversal set up with a relatively close stop loss to its entry price, which provides us with a good trading opportunity with a decent Risk:Reward ratio.
Examples of a Bullish Rising Wedge and Bearish Falling Wedge
Sadly, there is nothing that works 100% in trading. Not every rising or falling wedge will reverse as one might expect. Every trader must properly manage their risk by setting stop losses and not just trading based on price patterns. Below are two examples.
Bullish Rising Wedge ( ETHUSDT during 15/NOV/20 - 28/DEC/20)
In the early stages of the epic 20-21 bull market, if traders blindly treat the rising wedge as a bearish signal and trade accordingly, they would pay a heavy price.
Bearish Falling Wedge ( LTCUSD during 14/AUG/18 - 14/NOV/18)
On the contrary, in the late stage of the 2018 bear market, any trader who blindly trades the falling wedge to bet on a reversal would also learn a hard lesson.
Comment down your thoughts on Wedge Patterns in the comment section.
Disclaimer:
This is just an educational post. Never trade just any pattern. And please do your research before making any trades.
Happy Trading!

Mahindra & Mahindra trading idea stock given breakout at both daily and weekly time frame.
its trend line break out.
support mark on the chart if it close below that level on daily closing basis exit.


