Biocon: Range to Trend Expansion in ProgressBiocon’s weekly chart highlights a well-structured range-bound consolidation transitioning into a rising trend. Over the past several quarters, the stock has repeatedly faced supply near the upper resistance zone around 400–420, as marked by multiple rejections. This clearly establishes a strong overhead resistance where sellers have historically dominated.
On the downside, price action has respected a rising support trendline, forming higher lows over time. Each dip toward this support zone has attracted fresh buying interest, indicating accumulation at lower levels. This combination of flat-to-rising resistance and rising support reflects improving demand strength and a gradual tightening of price structure.
The recent pullback toward the support area near 360–370 is technically healthy rather than bearish. Such retracements often act as retest phases, allowing the market to absorb supply before attempting the next directional move. As long as Biocon holds above this rising support, the broader bullish structure remains intact.
A decisive weekly close above the resistance band (420+) would confirm a breakout from this prolonged consolidation. Post-breakout, the chart opens room for a strong upside expansion, with projected targets gradually extending toward the 460–500 zone based on the height of the prior range and trend continuation principles.
From a risk perspective, the setup stays valid while price sustains above the rising trendline. A breakdown below this support would delay the bullish thesis and could push the stock back into consolidation. Until then, Biocon remains in a favorable positional structure, where patience around support and confirmation near resistance can offer high-quality risk–reward opportunities for medium- to long-term traders and investors.
Wedgepatterns

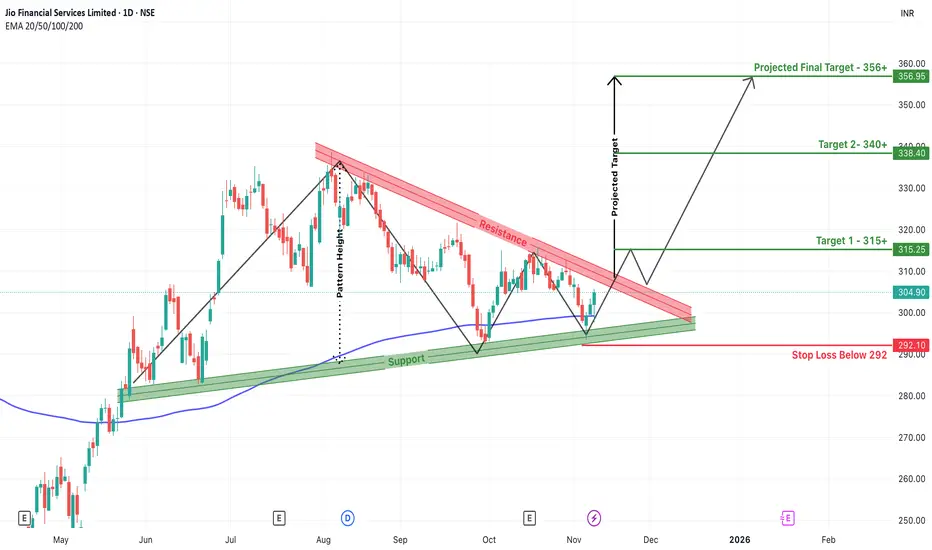
Jio Financial Breakout Watch –Wedge Setup Points to ₹356+ TargetJio Financial Services is currently presenting an exciting opportunity on the charts, with a wedge breakout setup forming after months of consolidation. A wedge is a bullish pattern that typically signals a reversal or continuation of an uptrend, especially when supported by rising volumes and strong market sentiment.
The price has been compressed within a narrowing wedge since August, bouncing between a down-sloping resistance zone and a strong ascending support zone. Each dip has been met with higher lows, indicating strong accumulation near the base of the wedge. The recent price action around ₹300 shows a strong bullish candle attempting to break out of the wedge resistance — a sign of growing buyer interest.
What strengthens this setup is the support confluence with 200 EMA and the lower wedge support. The 200 EMA near ₹299 has particularly held firm, and the breakout is emerging just above it — a healthy technical signal.
If the breakout sustains, we can expect a multi-leg bullish move with:
Target 1: ₹315+
Target 2: ₹340+
Final Target Projection: ₹356+
These targets are calculated based on the height of the wedge, which is then projected upwards from the breakout point. The price structure suggests a potential for an impulsive rally once the wedge breakout is fully confirmed on daily closing.
On the downside, a strict stop loss below ₹292 has been defined — any close below this zone would invalidate the bullish pattern and suggest a deeper retracement. This stop aligns just beneath the key support zone, keeping the risk-reward ratio favorable for positional traders.
In conclusion, Jio Financial is at a critical technical juncture. A confirmed breakout above the wedge could unlock substantial upside toward ₹356+, while maintaining disciplined risk management below ₹292 remains essential. Watch the breakout candle and follow-up volume closely — it could be the start of a new trend leg.
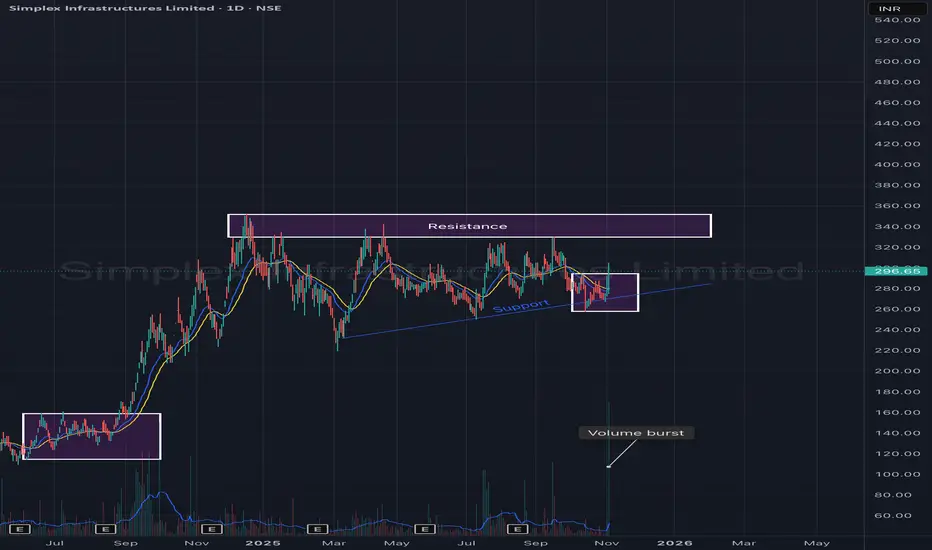
Simplex Infrastructures Ltd – Ascending Triangle Formation with Simplex Infrastructures is showing signs of accumulation and trend continuation within an ascending triangle pattern on the daily chart. The stock has been consistently forming higher lows while facing resistance around the ₹330–₹340 zone.
A recent volume burst near the support trendline indicates strong buying interest from lower levels — hinting at a potential breakout attempt in the coming sessions.
🎯 Key Levels:
CMP: ₹296.65 (+3.20%)
Support Trendline: ₹270 – ₹280
Resistance Zone: ₹330 – ₹340
Breakout Target: ₹370 – ₹390
Stop-Loss: ₹270 (on daily close basis)
📊 Technical View:
Formation of a higher-low structure within an ascending triangle.
Strong volume activity around support confirms accumulation.
Short-term EMAs are flattening, awaiting breakout confirmation.
A close above ₹340 with volume could trigger the next up leg toward ₹380+.
🧠 View:
Simplex Infra is building strength within a bullish ascending triangle pattern. A decisive move above ₹340 may confirm breakout momentum, supported by the recent volume surge, while the rising trendline continues to act as a strong base.
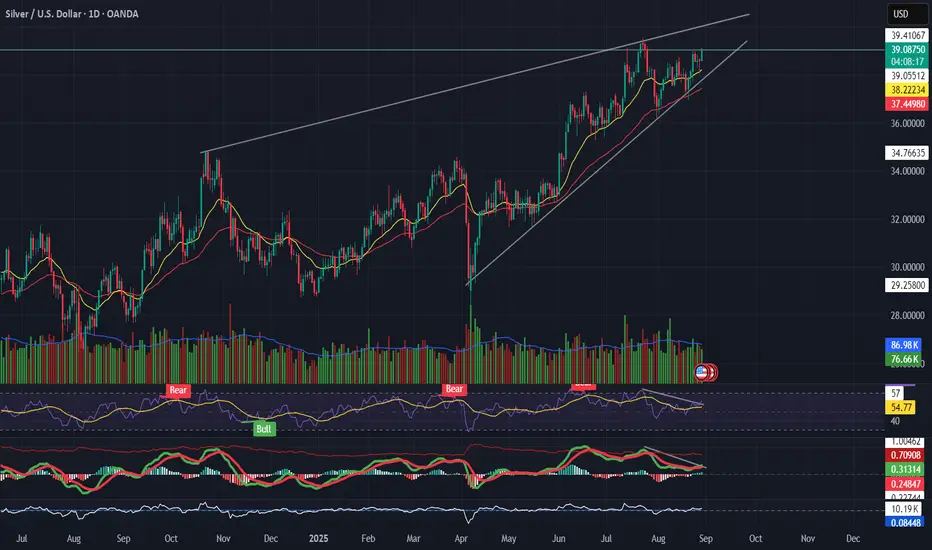
Silver (XAGUSD) Trading in a rising wedge Pattern📌 Silver (XAGUSD)
Trading in a rising wedge, pressing resistance near $39.
RSI divergence → price making higher highs, momentum not following.
MACD rolling over while price climbs = possible bearish divergence.
Support to watch: $37.3 → wedge breakdown if breached.
👉 Bullish only if $39.5 breaks with strong volume; otherwise, risk of pullback.
---
🎯 Takeaway
Silver = extended wedge → caution, momentum weak.
ECLERX SKYROCKETS 35%! This Pattern Signals ₹4,200 TargetNSE:ECLERX SKYROCKETS 35%, Made a Beautiful Chart Structure to Qualify for the Chart of the Week
Price Action:
- It experienced a powerful rally from ₹2,200 to ₹3,877 (all-time high) between July and October 2024
- Recent correction formed a descending wedge pattern from October 2024 to early May 2025
- Currently showing an explosive breakout at ₹3,301.80, up ₹852.40 (+34.80%) in this Week.
- Massive single-week gain with a long bullish candle breaking above both resistance levels and the downtrend line
- The weekly chart shows a strong V-shaped recovery from support
Volume Analysis:
- This Week's volume at 2.28M shares vs. average of 420.79K (over 5x normal volume)
- Previous support bounces have also witnessed above-average volume
- Extremely high volume on today's breakout suggests significant institutional participation
- Volume pattern confirms the legitimacy of the price action
Key Support and Resistance:
- Strong support zone at ₹2,200-2,300 (green horizontal box) - tested and held multiple times over the past year
- Previous resistance now likely support at ₹3,200-3,250 (green horizontal line)
- Next resistance at all-time high of ₹3,877 (marked as "High")
- Downtrend line (white diagonal) now broken with conviction
Technical Patterns:
1. Descending Wedge Breakout- Classic bullish reversal pattern completed this week
2. Double Bottom*- Formed at ₹2,300 level in March-May 2025
3. Support Retest- Successfully retested the major support zone before the breakout
4. V-Shaped Recovery - Strong reversal indicating powerful buying interest
Trade Setup:
- Pattern: Descending wedge breakout with volume confirmation
- Confirmation: Explosive price action and volume expansion
- Context: Bullish reversal after testing major support zone
Entry Points:
1. Aggressive Entry: Current price (₹3,301.80) with partial position
2. Pullback Entry: On retest of breakout level ₹2,900-3,000
3. Confirmation Entry: On consolidation and holding above ₹3,200 for 2-3 sessions
Exit Strategy:
- Target 1: ₹3,600 (psychological resistance)
- Target 2: ₹3,877 (previous all-time high)
- Target 3: ₹4,200 (pattern projection based on measured move)
- Trailing Stop: 7% trailing stop after Target 1 is achieved
Stop Loss Placement:
- Aggressive Stop: ₹2,950 (below recent swing low)
- Conservative Stop: ₹2,800 (near the breakout point of the wedge)
- Pattern-Based Stop: ₹2,500 (invalidation level for the pattern)
Risk Management:
- Position sizing: Limit risk to 1-2% of trading capital
- Risk-reward ratio: Minimum 1:1.5 for aggressive entry, 1:2 for pullback entry
- Consider scaling approach:
* Enter 50% position now
* Add 25% on confirmation of trend (holding above ₹3,200)
* Add 25% on pullback (if it occurs)
- Take partial profits: 30% at Target 1, 30% at Target 2, hold remainder with trailing stop
NSE:ECLERX shows a powerful technical setup with its powerful breakout from a descending wedge pattern on record volume. The price action respects key technical levels, with the stock holding major support at ₹2,200-2,300 before staging today's massive rally. The breakout above both the wedge pattern and horizontal resistance, with 5x normal volume, suggests potential for continued upside momentum toward previous highs and beyond.
Keep in the Watchlist.
NO RECO. For Buy/Sell.
📌Thank you for exploring my idea! I hope you found it valuable.
🙏FOLLOW for more
👍BOOST if you found it useful.
✍️COMMENT below with your views.
Meanwhile, check out my other stock ideas on the right side until this trade is activated. I would love your feedback.
Disclaimer: "I am not a SEBI REGISTERED RESEARCH ANALYST AND INVESTMENT ADVISER."
This analysis is intended solely for informational and educational purposes and should not be interpreted as financial advice. It is advisable to consult a qualified financial advisor or conduct thorough research before making investment decisions.

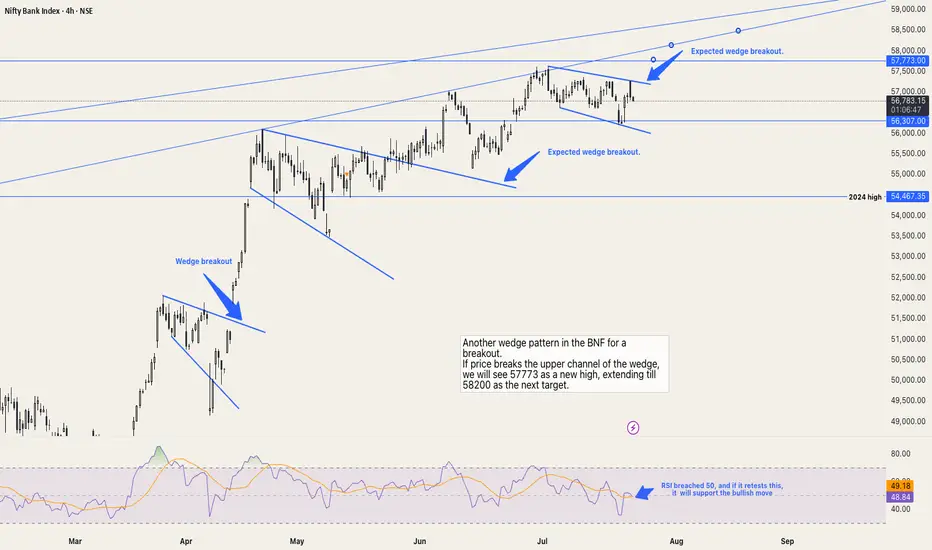
BNF a new high projection.Another wedge pattern in the BNF for a breakout.
If price breaks the upper channel of the wedge, we will see 57773 as a new high, extending till 58200 as the next target.
RSI falling below 50 will invalidate the bearish move and will fall till the lower channel of the wedge.
CAMS – Rising Wedge in Focus ________________________________________________________________________________
📈 CAMS – Rising Wedge in Focus
🕒 Chart Type: Daily
________________________________________________________________________________
What’s Catching Our Eye:
CAMS is forming a Rising Wedge, a technical structure that often leads to strong directional moves. The price is nearing the upper boundary of the wedge, indicating possible breakout or reversal. This contraction in range is typically followed by expansion — and smart traders are watching closely.
________________________________________________________________________________
What We’re Watching For:
Price holding above ₹4201.40 could trigger interest from early participants. On the flip side, a breakdown below ₹4090.50 may signal failure of the wedge structure. For more confirmation-driven entries, one may wait for a proper breakout or breakdown candle with volume.
________________________________________________________________________________
Volume Footprint Analysis:
As expected in wedge formations, volume has compressed. A breakout supported by volume expansion could validate the move and offer confidence in continuation. Volume is the key trigger to watch once the wedge resolves.
________________________________________________________________________________ Option Structure Insight:
For educational purposes, one could observe a neutral hedge approach using options:
– Buy 4200 CE
– Buy 4100 PE
This can potentially help capture a sharp move in either direction. Once the move confirms, the opposite leg can be exited to ride the trend with managed risk.
Price Action Logic:
Rising wedge formations typically form after a directional up-move and narrow into a tightening range. This is often followed by an impulsive expansion phase. CAMS is showing that exact setup. The price is sandwiched between key resistance at ₹4200+ and demand near ₹3880.
________________________________________________________________________________
💼 Sector Tailwinds:
CAMS, operating within the mutual fund RTA space, benefits from India's rising retail participation and SIP growth. The digitalisation of mutual fund flows, compliance demand, and data-based services lend long-term support to this sector. These factors offer fundamental strength to this technical setup.
________________________________________________________________________________
⚠️ Risks to Watch:
– A close below ₹4085 could invalidate the bullish wedge setup
– Current price behavior reflects compression, but indicators like Stochastic may suggest near-term overbought conditions
– Avoid chasing — wait for confirmation via breakout + volume or a proper retest candle
– Do not over-leverage in a low-volume wedge structure — focus on proper R:R and sizing
________________________________________________________________________________
🔮 What to Expect Next:
If the wedge breaks upward and sustains above ₹4201.40 with volume, price expansion may be observed toward ₹4330–₹4450 zone. On the downside, a breakdown below ₹4090.50 may trigger a move toward the ₹3950–₹3880 support cluster. Watch for confirmation in the next 2–3 sessions before taking directional exposure.
________________________________________________________________________________
🧠 How to Trade CAMS (For Educational Use Only):
🔹 Breakout Trade Plan
• Entry: Above ₹4201.40
• Stop Loss: Below ₹4090.50 (closing basis preferred)
• Pullback Entry: If price returns to ₹4095–₹4105 zone and shows bounce confirmation
• Risk-Reward: Start with 1:1, trail for 1:2+
• Position Sizing: Based on risk, never overexpose in a wedge
🔹 Options Strategy (Educational View)
• Buy CAMS 4200 CE
• Buy CAMS 4100 PE
• Exit the losing leg once direction confirms with price + volume breakout
________________________________________________________________________________
📍 Levels to Keep an Eye On:
The first key level to observe is ₹4201.40 — a break above this may attract early interest from aggressive participants as it represents the upper boundary of the rising wedge. On the downside, ₹4090.50 acts as the breakdown level; if breached, it could suggest structural weakness and a potential shift in trend.
In case of an upward breakout, we are closely monitoring the ₹4330–₹4450 zone as a possible price expansion area. If the breakdown plays out instead, the ₹3950–₹3880 zone becomes important as a potential reaction area or demand test.
Historically, the ₹3880–₹3950 range has shown signs of buyer interest and may act as a demand zone if retested. On the upside, ₹4320–₹4400 has acted as supply in the past and could present resistance if the price extends higher.
A close below ₹4085 would invalidate the bullish wedge structure and may require a reassessment of directional bias.
________________________________________________________________________________
⚠️ Disclaimer (Please Read):
• This chart is shared for educational purposes only and is not investment advice.
• I am not a SEBI-registered advisor.
• The information provided here is based on personal market observation.
• No buy/sell recommendations are being made.
• Please do your own research or consult a registered financial advisor before making any trading decisions.
• Trading involves risk. Always use proper risk management.
________________________________________________________________________________
💬 Found this helpful?
How would you prefer to approach this — breakout entry or pullback into zone?
Drop your thoughts or questions in the comments below ⬇️
🔁 Share this post with your trading community.
✅ Follow @SimpleTradeWithPatience for price-action backed technical setups.
🚀 Let’s trade with patience, logic, and clarity!
Be Self-Reliant | Trade with Patience | Learn with Logic
________________________________________________________________________________

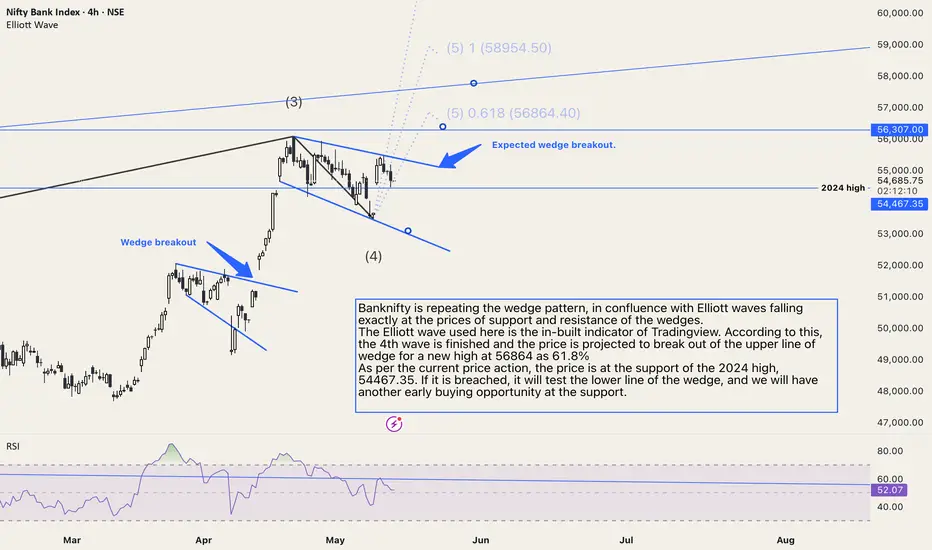
Banknifty combining Elliott and wedge theoryBanknifty is repeating the wedge pattern, in confluence with Elliott waves falling exactly at the prices of support and resistance of the wedges.
The Elliott wave used here is the in-built indicator of Tradingview. According to this, the 4th wave is finished and the price is projected to break out of the upper line of the wedge for a new high at 56864 as 61.8%
As per the current price action, the price is at the support of the 2024 high, 54467.35. If it is breached, it will test the lower line of the wedge, and we will have another early buying opportunity at the support.
The RSI is still above 50; therefore, the 2024 high level is proving to be good support. No selling is suggested unless the price is trading above this support level of 54467.35.
Shriram Pistons - Wedge BO NSE:SHRIPISTON Made Beautiful Chart Structure today after Q4 Results with Good Price and Volume action.
Wedge Breakout Pattern History:
The chart displays a remarkable track record of successful wedge breakout patterns, which has become a defining characteristic of this stock's technical behaviour:
Past Wedge Breakout Sequence:
First Wedge (2022-2023): Initial falling wedge formation around the ₹550-700 range, which broke out to the upside and catalysed a strong rally.
Second Wedge (Mid-2023): Formed after the first major run-up at the ₹1,000-1,200 level. This wedge breakout propelled the stock toward the ₹1,600 level.
Third Wedge (Early 2024): A more compact wedge pattern around ₹1,800-2,000 that triggered another significant upward move.
Fourth Wedge (Recent): The latest wedge formation, which has just broken out with today's massive 14% price surge.
Pattern Reliability:
What makes this technical setup particularly compelling is the consistency of these wedge patterns:
Each wedge has followed a similar compression pattern
All previous breakouts have led to substantial price advances
The patterns have maintained their predictive validity across different market cycles
The breakouts have consistently occurred on higher-than-average volume (implied by the large price bars)
Current Breakout Analysis:
Today's 14% surge represents a powerful breakout from the most recent wedge pattern:
The breakout has occurred with exceptional momentum (nearly 20% gain on a weekly TF)
The price action has cleared both the upper trendline resistance and previous swing highs
The stock is now approaching its all-time high of ₹2,399.00
Price Structure & Technicals:
Beyond the wedge patterns, the stock shows several positive technical characteristics:
Consistent stair-step pattern of higher lows and higher highs
Each consolidation period (wedge) has been followed by robust expansion
Primary trend remains strongly bullish with price well above major moving averages (implied)
Each breakout has established a new support level at the previous resistance
Projection Based on Historical Pattern:
Given the stock's history of successful wedge breakouts:
The measured move projection from this breakout suggests a potential target in the ₹2,400-2,600 range
The stock could reach new all-time highs if the pattern's reliability continues
Previous breakouts have generally resulted in 20-30% moves from the breakout point
Key Levels to Watch
Immediate Resistance: ₹2,399.00 (all-time high)
Support: ₹1,950-2,000 (previous wedge upper boundary, now potential support)
Secondary Support: ₹1,800 (previous consolidation level)
Conclusion:
Shriram Pistons & Rings demonstrates a remarkably consistent pattern of wedge breakouts that have reliably preceded significant price advances. Today's powerful breakout continues this technical signature, suggesting the potential for further upside if historical pattern reliability maintains.
Keep in the Watchlist.
NO RECO. For Buy/Sell.
📌Thank you for exploring my idea! I hope you found it valuable.
🙏FLLOW for more
👍BOOST if useful
✍️COMMENT below with your views.
Meanwhile, check out my other stock ideas on the right side until this trade is activated. I would love your feedback.
Disclaimer: "I am not SEBI REGISTERED RESEARCH ANALYST AND INVESTMENT ADVISER."
This analysis is intended solely for informational and educational purposes and should not be interpreted as financial advice. It is advisable to consult a qualified financial advisor or conduct thorough research before making investment decisions.

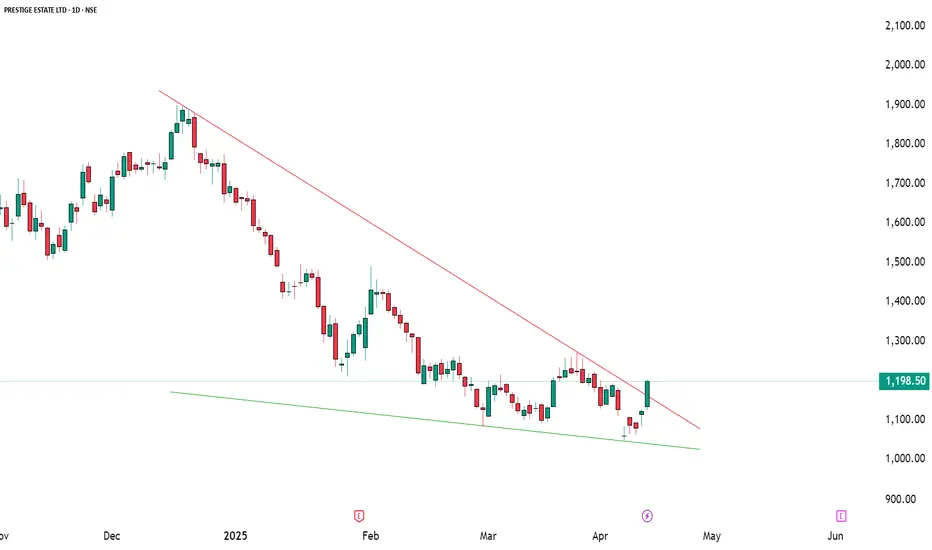
Prestige Estate – Bullish Structure DevelopingPrestige Estate – Bullish Structure Developing After Prolonged Correction
📅 Date: April 16, 2025
📈 Chart Type: Daily | Exchange: NSE
💡 Purpose: Educational Analysis
🔍 Price Action Overview
After an extended downtrend, Prestige Estate appears to be forming a potential trend reversal structure. A strong bullish candle has emerged from a key support zone, accompanied by multiple technical confirmations that indicate renewed buying interest.
📌 Key Technical Highlights
📉 Downtrend Line Break: The stock has convincingly broken above a descending trendline, indicating a potential shift in trend dynamics.
📊 Indicators Triggered:
✅ RSI Breakout: Momentum is turning positive.
✅ MACD Crossover: Bullish signal crossover observed.
✅ Bollinger Band Squeeze Off: Suggests upcoming volatility with a directional move.
📍 Volume Surge: A notable spike in volume supports the strength of the breakout candle.
🧱 Support and Resistance Zones
🟢 Support Levels:
S1: ₹1148
S2: ₹1098
S3: ₹1071
Broad Support Zone: ₹1000–1050 (marked as Weak Support)
🔴 Resistance Levels:
R1: ₹1272 (Pattern Entry Level)
R2: ₹1252
R3: ₹1302
Major Resistance: ₹1900–2000 (Long-term supply zone)
🔄 Entry Reference Levels (For Educational Illustration Only)
✳️ Early Entry Reference: Above ₹1203
A close above ₹1203 indicates sustained strength and potential continuation.
🧩 Pattern Breakout Entry Reference: Above ₹1272
A breakout above ₹1272 could confirm a larger reversal pattern with room to test higher resistance levels.
⚠️ Important Disclaimer
This analysis is strictly for educational purposes and aims to help readers understand price structure, support/resistance zones, and indicator alignment. It does not constitute investment advice or a buy/sell recommendation. Always consult a registered financial advisor before making any investment decisions. Market participation involves risk and capital protection should be a priority.
📘 Conclusion
Prestige Estate is currently at a critical juncture where momentum indicators, volume, and price action are aligning for a potential upside continuation. Close monitoring of key breakout levels and market conditions will be crucial for informed decision making.
🔔 Let us know your thoughts in the comments – Do you see strength sustaining above ₹1203?
📊 Poll: Will Prestige Estate reclaim ₹1300 in the coming weeks?
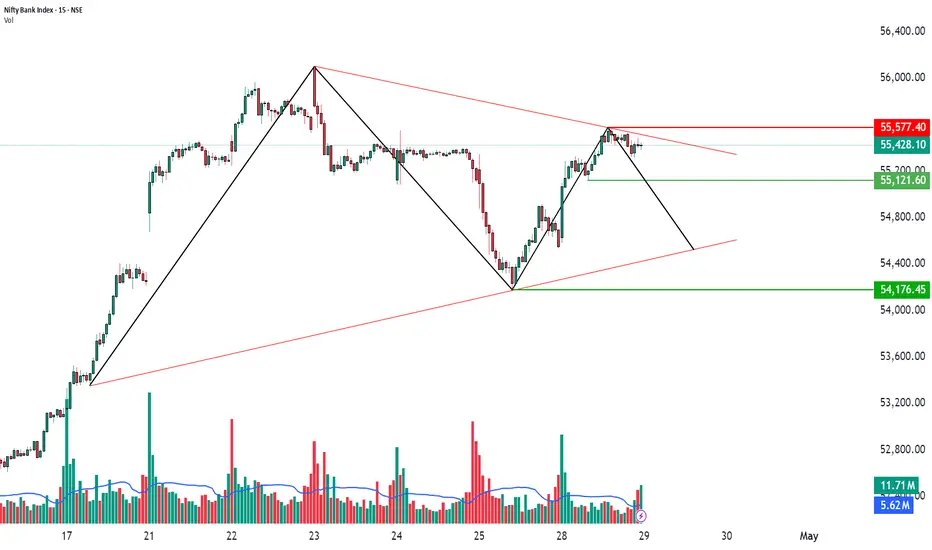
Wedge Pattern Near Resistance | 15-Min Chart🏦 BANK NIFTY INDEX – Wedge Pattern Near Resistance | 15-Min Chart
📅 Date: April 28, 2025
📈 Timeframe: 15-Minute
🔍 Index: Bank Nifty (NSE)
📌 Technical Overview:
Bank Nifty is moving inside a Wedge Pattern on the 15-minute chart and is facing resistance near 55,577. The price is struggling to move higher and may face selling pressure if it fails to break this resistance. Immediate support is placed at 55,121, and if it breaks down, the index could slip further toward 54,176.
🧩 Chart Pattern Details:
Wedge formation visible with two sloping trendlines (marked in red).
Resistance: 55,577 (red horizontal line).
Immediate Support: 55,121 (first green line).
Major Support: 54,176 (second green line).
🔍 Key Price Levels:
Resistance: 55,577
Immediate Support: 55,121
Major Support: 54,176
CMP (Current Market Price): 55,428.10
If Bank Nifty remains below 55,577 and breaks below 55,121, further downside pressure could build up toward the lower support zone.
📊 Volume Analysis:
Volume has reduced near the resistance area, showing that buyers are losing strength and sellers may start gaining control.
🧠 Observational Bias:
If Bank Nifty fails to cross above 55,577 and breaks 55,121, bears could dominate.
Watch for a proper breakout or breakdown setup before taking trades.
Falling Wedge Breakout with Bullish Structure | 15-Min Chart🏦 HDFC BANK LTD – Falling Wedge Breakout with Bullish Structure | 15-Min Chart
📅 Date: April 25, 2025
📈 Timeframe: 15-Minute
🔍 Stock: HDFC Bank Ltd (NSE)
📌 Technical Overview:
HDFC Bank is showing signs of a potential bullish reversal on the 15-minute chart, forming a falling wedge pattern, which is typically known for reversal setups. Price action suggests a breakout from the wedge structure, with strong volume support.
🧩 Chart Pattern:
A clear Falling Wedge is identified using two converging trendlines (red).
Within the wedge, price completed a potential AB=CD harmonic structure, bottoming out near ₹1,891.
The breakout candle has closed above the upper trendline, signaling early strength.
🔍 Key Price Levels:
Support Zone: ₹1,891.80 (marked in red)
Immediate Resistance: ₹1,933.00 (green horizontal line)
CMP: ₹1,917.70
A sustained move above ₹1,933 may open room for further upside, potentially towards the ₹1,960–₹1,980 range as per the chart projection.
📊 Volume Analysis:
Noticeable pickup in green volume bars on the breakout candle.
This confirms growing interest and participation from the bulls.
🧠 Observational Bias:
As long as the price holds above ₹1,891 and sustains the breakout, the short-term trend appears to be tilting in favor of buyers. A retracement or retest of the wedge breakout zone may offer additional confirmation.

CNX 500Hello & welcome to this analysis
The index in daily time frame is retesting a Bullish Harmonic Gartley pattern made in end January which coincides with the formation of a wedge pattern and a double bullish divergence.
A bounce back could be possible if it manages to start sustaining above 20850 for 21500-22500 however, if it breaches the lower trendline of the wedge then a lot more downside would become inevitable.
Harmonic Trading Patterns are formed in a combination of structures and Fibonacci ratios. When they align and give a reversal candle follow through a strong bounce/reversal probability is relatively high.
Wait for confirmation and enter only then, in case of breach of falling trendline avoid the signal.
Regards

Finolex Pipes - Falling Wedge Finolex Pipe has created Falling Wedge pattern, it has minimal volumes in this fall from 340 level.
Breakout zone is above 250 level.
Buy @ 240 level
SL 225
Target of the pattern is 340-350 level.
Time Frame : Short Term.

Hardwyn India - Possible PathStock at a very crucial area
Trend line support at 28.5 - 29
Also forming a wedge pattern
Breakout / Breakdown Possible
Upside stops 32 / 42.5 / 47
Downside 26 and more

ANANTRAJ - Breakout Trade View : Bullish
Entry Zone- 750-725
Exit Zone - Based on Trader mindset. Exit 1 - 770
Exit 2- 785
Stoploss : Close below 720
Timeframe: Daily
Notes: Breakout of Wedge pattern which is consolidate since September 2024.
* This is not a trading recommendation, for educational purposes only

Uniswap : Falling Wedge Pattern formed, Achieving +126% ROIThe Uniswap falling Wedge Pattern has formed, and a Breakout is Expected. If the Breakout occurs above the pattern, the market could approach Target 1 and Target 2, offering a chance to achieve a +126% ROI.

EIHOTEL - Stock to be in RADAR and Hidden Trendlines MarkedView : To be determined
Entry Zone- Once the price breaks out of the Black color trendline with a strong green candle.
Timeframe: Daily
Notes: The price has been consolidating since Feb 2024, forming a Wedge pattern. Also, Hidden line marked in black color. Resistance and support levels are marked on the chart, showing how the price has consistently respected these levels.
* This is not a trading recommendation; for educational purposes only

MOREPENLAB - Breakout in DaytimeframeStock price consolidate since September 2024 and it breakout the wedge pattern today.

GSFC - Trendline breakout and Good Morning star candle formationThe price has been consolidating since March 2024, respecting the 188 range on the daily timeframe. Last week, it broke out of the trendline within the wedge. On the weekly timeframe, the candlestick formation resembles a morning star, which is a positive signal. We can expect the price to reach the resistance line of the wedge, around 288 INR. This setup is suitable for swing trading.

EMMBIEMMBI :- Falling wedge type structure has formed and is consolidating by giving breakout, chances of upside movement are high
Hello traders,
As always, simple and neat charts so everyone can understand and not make it too complicated.
rest details mentioned in the chart.
will be posting more such ideas like this. Until that, like share and follow :)
check my other ideas to get to know about all the successful trades based on price action.
Thanks,
Ajay.
keep learning and keep earning.

ELETCAST - Broadening Wedge PatternPrice consolidate since Janaury 2024 and it form broadening wedge pattern. Price currently in support line but it is looking in only Day Timeframe. Please do not consider or enter without good candle formation in Day time frame and it should have tight stoploss below the support line.

JSL - Stock to be in RADARThe price has been consolidating since April 2024, forming a wedge pattern.We can enter this stock on breakout for short term gain.
