NMDC, big breakout candidateNMDC 80 weekly breakout happening after long consolidation. VCP pattern on daily charts plus all bullish crossover on leading and lagging indicator
Metals and PSU stocks getting buying (short covering also)
Expected higher levels if breakout sustained is 88 to 105. Invalid below 78 closing on 2 day basis
Weeklybreakout

GEPIL- CUP AND HANDLE BREAKOUTGEPIL gave classical breakout on weekly charts above 350. Classical bullish Cup and Handle breakout is there on daily and weekly charts. Breakout backed with volumes too
Breakout targets are 425/460/480.
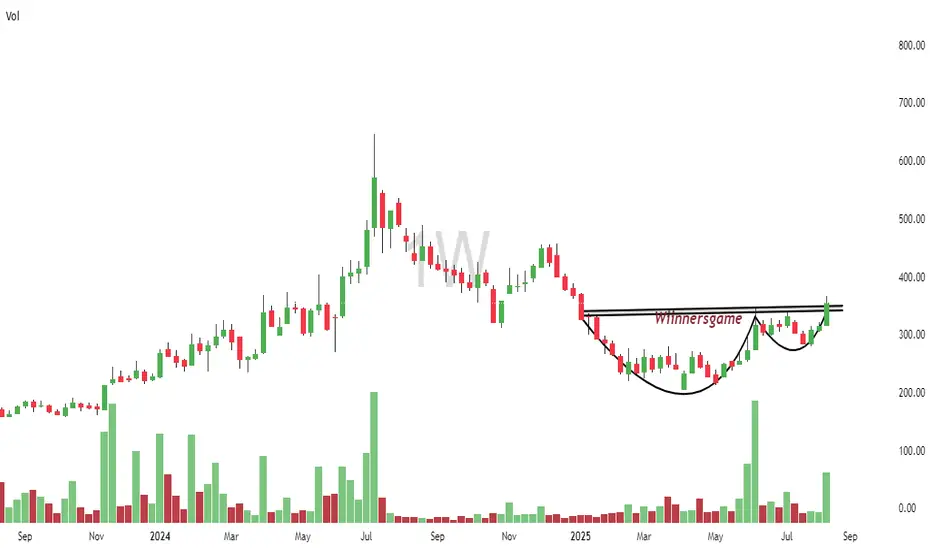
Matrimony-A weekly breakout for ATH target is done!Matrimony has finally given weekly closing above its weekly supply zone of 730-750.
Stock can fly if it manages to sustain above this zone.
ATH target can be expected. Not a recommendation.

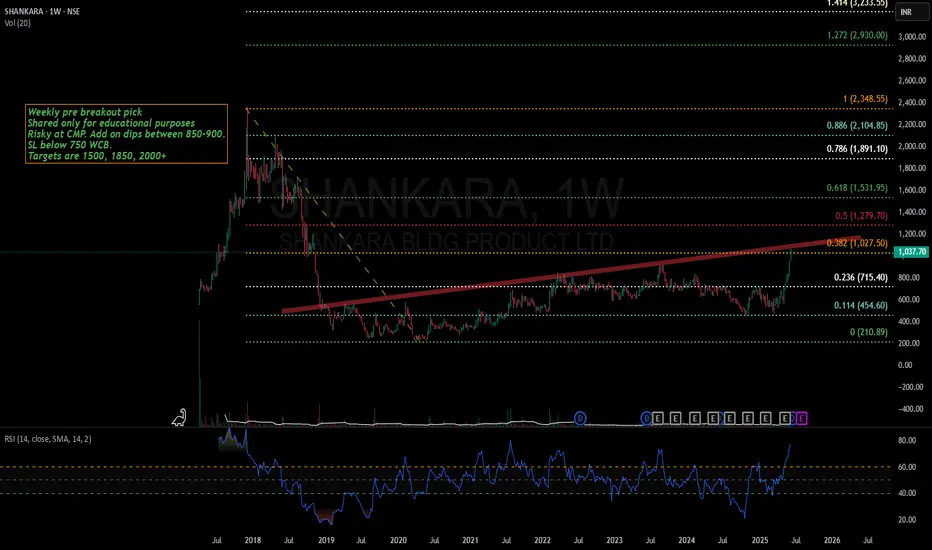
Shankara- U-turn pick for probable 2x returnsShankara has been in a accumulation phases since past 5+ years but has recently given a big breakout.
Stock has potential to fly more as it is just a start of stage 2
Stock can be kept in watchlist for big returns as a positional pick.
It is small cap stock and comes with high risk with high returns.
Please trade wisely and with proper SL.
Please note that this idea is not a recommendation and is for you to learn how stage 2 breakouts can be explosive.
Apollo Micro-Do not miss this Volume breakout!Apollo Microsystems has given a breakout of consolidation with a strong weekly closing, almost forming a bullish marubozu candle
Stock will look good only when it retest level of 110 and bounces.
Levels mentioned on chart. I will not buy at CMP.
Stock has potential to fly at least towards 200 according to fib extension.
It is too good of breakout to miss. I have hardly seen such a bullish weekly candle recently when Nifty has been slight bearish.

#MANAPPURAM - Weekly Time Frame VCP Break Out with Volume📊 Script: MANAPPURAM
Key highlights: 💡⚡
📈 VCP formation in Weekly chart.
📈 Volume Spike seen
📈 Can Enter Breakout on if price sustains
📈 MACD Bullish
📈 RS is Bullish
📈 One can go for Swing Trade.
BUY ONLY ABOVE 240 WCB
⏱️ C.M.P 📑💰- 235
🟢 Target 🎯🏆 – 35%
⚠️ Stoploss ☠️🚫 – 17%
️⚠️ Important: Market conditions are getting better, Position size 50% per Trade. Protect Capital Always
⚠️ Important: Always Exit the trade before any Event.
⚠️ Important: Always maintain your Risk:Reward Ratio as 1:2, with this RR, you only need a 33% win rate to Breakeven.
✅Like and follow to never miss a new idea!✅
Disclaimer: I am not SEBI Registered Advisor. My posts are purely for training and educational purposes.
Eat🍜 Sleep😴 TradingView📈 Repeat 🔁
Happy learning with MMT. Cheers!🥂

#LAURUSLABS - Potential Stage 1 Breakout 📊 Script: LAURUSLABS
Key highlights: 💡⚡
📈 C&H formation in weekly chart.
📈 Price gave a good up move
📈 Went Side Ways, wait for more consolidation near Resistance
📈 Volume spike must be seen on BO
📈 MACD Bounce
📈 One can go for Swing Trade.
BUY ONLY ABOVE NA DCB
⏱️ C.M.P 📑💰- 602
🟢 Target 🎯🏆 – NA%
⚠️ Stoploss ☠️🚫 – NA%
⚠️ Important: Always Exit the trade before any Event.
⚠️ Important: Always maintain your Risk & Reward Ratio.
✅Boost, Like and follow to never miss a new idea! ✅
Disclaimer: I am not SEBI Registered Advisor. My posts are purely for training and educational purposes.
Eat🍜 Sleep😴 TradingView📈 Repeat 🔁
Happy learning with MMT. Cheers!🥂

Jubilant Pharma-Consolidation breakout can give good returnsJubilant pharmova has been trading in a big range since last few years.
Stock has managed to close above the resistance and has also retested the breakout.
Stock has potential to fly from this levels.
Keep stock in watchlist. A nifty500 stock and hence can be relatively safer option.
Not a recommendation.

SWANENERGYSWANENERGY has given trendline breakout with increased market participation and raised above all previous high. Seems too bullish on long term charts as well both Weekly and monthly. Keep it on radar.

ARIESARIES giving resistance breakout. Also showing flag pattern on weekly time frame. Showing decent volume in recent session. Pattern target comes near 470 which is 30% from current price. Keep in yr watchlist.

Supriya- A breakout done for potential multibagger returns!Supriya Lifescience stock has given a beautiful rounding bottom pattern breakout in weekly TF
Stock has consolidated above the breakout level which shows strength of breakout.
Above 650, stock can fly towards 1000 levels.
Keep in watchlist. Not a recommendation.

AMBER ENTERPRISE, CUP&HANDLE BREAKOUTAmber enterprise, 5000, running now after CUP & Handle breakout at 4000-4100 range. Now with massive volumes stock is into bullish momentum for next levels to come is 5400/6200/7400
Stock is into small cap category, so it will be investors oriented players only

CREST - 8 Months Consolidation Breakout - All Time HighCrest Ventures Ltd
1) Time Frame - Weekly.
2) The Stock has been in a Consolidation since (February, 2024). Now, It has given a Consolidation breakout & Closed at it's Life Time High with good volume & good bullish momentum candle in Weekly Time Frame.
3) The stock may find it's next resistance around the price (790 - 34.25% from the current price 588.45).
4) Recommendation - Strong Buy.

Campus- A high risk bottoming breakout for multibagger returns!Campus is a typical example of bottoming breakout done with volumes.
I had given it as an example of falling knife stock but now looks good for a U-turn.
ATH from here means 2x returns.
Please note that Stock doesn't have good fundamentals currently.
Invest as per your risk appetite after discussion with financial advisor. Not a recommendation.

GUJALKALI GUJALKALI showing resistance breakout with decent volume on long term chart. Some traction observed in chemical sector in recent days

UTIAMC-DO NOT MISSLogic-Simple weekly resistance breakout, retest and continuation.
Weekly closing above 910 will be a confirmation. 1000 will be immediate resistance.
A good investment stock for long term as well available at a fair valuation with more than 2% dividend yield. I am expecting similar rally as HDFC AMC in this stock but move would be slow.
Not a recommendation, just my personal opinion!

TATA TECHNOLOGIES LTD FALLING WEDGE BREAKOUTTata Technologies Limited
It has shown Termendous breakout with
3 weekly higher high closing candles which will lead to two big green candles in short term-
for a target of 1400.
Then it will consolidate before starting next leg of run-
For target second that is of 1830.

IPCALAB - CUP AND HANDLE PATTERN WEEKLY CHARTThe stock has formed CUP & HANDLE pattern
on the WEEKLY chart.
One can enter above 1383 or Wait for weekly candle close above 1383 with a strict Stoploss of 1240
Target 1 - 1650
Target 2 - 1820
Target 3 - 2000
#LONGTERM TRADE
What is your view please comment it down and also boost the idea this help to motivate us. All views shared on this channel are my personal opinion and is shared for educational purpose and should not be considered advise of any nature.

EPL - Swing Trade Analysis - 14th August #stocksEPL (1W TF) - Swing Trade Analysis given on 14th August, 2024
Pattern: CUP & HANDLE BREAKOUT
- Resistance Trendline Breakout - Done ✓
- Volume Buildup at Resistance Trendline - Done ✓
- Pullback Candle with Strong Volumes - Done ✓
- Retest & Consolidation (for a small SL and a better RR) - In Progress
* Disclaimer

IMAGCIAA World LTD (Range Breakout On WTF)IMAGCIAA World LTD has given a Range Breakout on Weekly time frame with good volume. The stock can possibly head towards 120, 150 levels in the coming few weeks. Stop loss could be placed at 76.25 (low of weekly closing).
Disclaimer: This post is for educational purpose, and not a recommendation. I am not a SEBI registered analyst. Investors must consult a financial advisor before making any investment.

ICICIPRULI & DEEPAKNTR - Breakthrough of the Rounding Bottom ICICI PRUDENTIAL
The stock experienced an upward trend, forming an Ascending Broadening Wedge pattern that suggested a bearish outlook.
Following a breakdown, the stock price fell sharply and entered a consolidation phase.
During this period, the stock exhibited progressively smaller price fluctuations, establishing a series of consolidation bases, each one tighter than the last, formation of a Volatility Contraction Pattern.
After breaking through this phase, the price reached an all-time high and is now set to climb even further.
DEEPAK NITRITE
During the upward trend, the stock price established a Pole & Flag pattern, signaling a continuation of the trend.
However, following the breakout, the price underwent a significant consolidation phase, resulting in the formation of a Rounding Bottom pattern.
Recently, a breakout has taken place, indicating that the price is poised for an upward movement.

GREAVESCOT on weekly breakout Seems rally may continue at least till result next week. Potential candidate for momentum

Weekly Bullish Flag pattern breakoutA Bullish Breakout of Flag and Pole pattern is visible on the Weekly chart of NSE:SANSERA
MACD already gave Positive crossover on Daily and Weekly chart. So, expecting the momentum to continue.
One can create a fresh position in the scrip as per the levels mentioned on the chart.
HIT THE ROCKET BUTTON IF YOU LIKE TO BOOST THE IDEA.
Risk Disclaimer:
The information provided in this analysis is based on my personal interpretation of market conditions and the available data at the time of writing. It is advisable to seek advice from a qualified financial professional and to conduct your own research before making any investment decisions.
