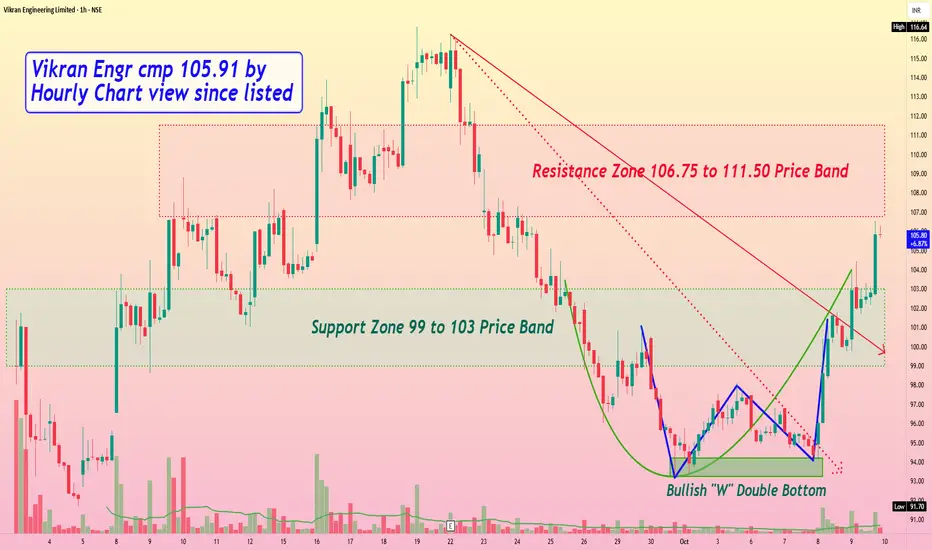
Vikran Engineering cmp 105.91 by Hourly Chart view since listedVikran Engineering cmp 105.91 by Hourly Chart view since listed
- Support Zone 99 to 103 Price Band
- Resistance Zone 106.75 to 111.50 Price Band
- Volumes are spiking well above avg traded quantity over past few days
- Subject to closure above Resistance Zone for few days, New ATH maybe anticipated
- Stock has formed bullish technical chart setup with Rounding Bottom and W Double Bottom
Wformation
Coal India Bullish Set upThe stock has been in downtrend and now took a pause with strong accumulation on the lower base
Bullish Set up
Looks like a W formation breakout
SL of 395s zone
Target 1 425s zone
Target 2 445s zone

Medplus-A beautiful W in the making!Medplus has been in a downtrend since couple of years.
Stock is showing strong reversal after a base formation.
Stock has potential to test ATH and also make new highs.
Keep in watchlist. Not a recommendation.

TORRENT PHARMA - Ascending triangle/W formation/inverted H&STORRENT PHARMA - Ascending triangle/W formation/inverted H&S BREAK-OUT - Pick your choice.

BHEL - W PatternThe weekly chart of BHEL shows W pattern. The technical target is 78.
The weekly chart of Wockhardt pharma shows flag and pole pattern. Can buy and accumulate in dips. The technical target is 78.
Note: I am just a beginner. This chart is for learning and educational purpose only. Kindly invest based on your research and analysis. Do not forget to give a like if you find this chart helpful. Happy investing :)

EURGBP W formation Long Bullish continuationIt is moving towards a W formation on the daily chart .
target1: breakout level after consoldiation
target2: breakout level
