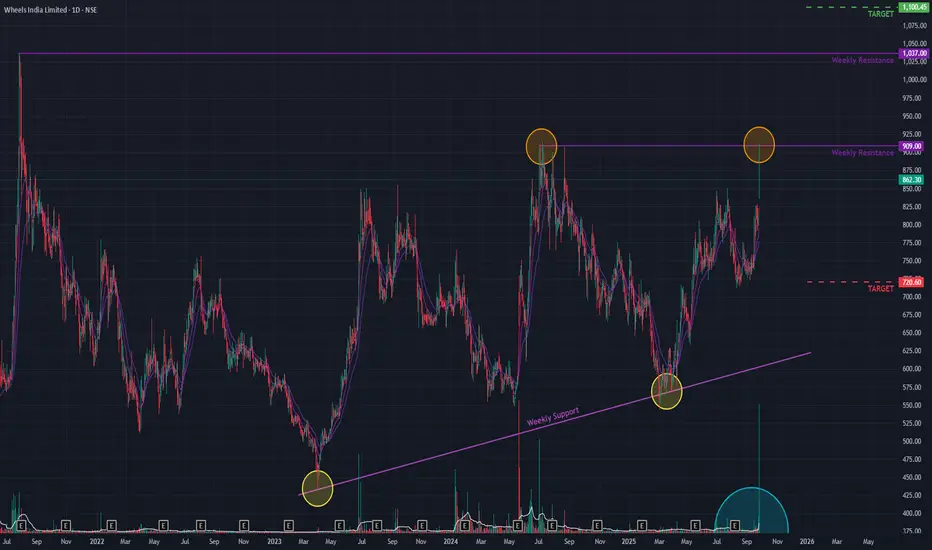
Wheels India (D) - Challenges Key Resistance with Massive VolumeWheels India is making another powerful attempt to break through a key horizontal resistance level that has been in place since July 2024. The stock, which has been in a long-term uptrend since March 2020, has been rejected at this level multiple times.
Today's session was marked by a gap-up opening and an exceptionally high trading volume , significantly larger than in previous attempts, signaling strong bullish intent. However, despite this strength, the stock closed at ₹862.30 , just below the critical resistance, indicating that the battle is not yet won.
Broad-Based Bullish Confirmation 👍
The underlying technical picture remains strong, with multiple indicators suggesting building positive pressure:
- Multi-Timeframe Strength: Both the short-term Exponential Moving Averages (EMAs) and the Relative Strength Index (RSI) are showing bullish crossovers on higher timeframes, confirming broad-based positive momentum.
- Volume Thrust: Today's massive volume spike indicates a significant increase in buyer participation at this crucial juncture.
Outlook: Awaiting a Decisive Close
The stock is at a critical inflection point. While the underlying indicators are bullish, a decisive close above the resistance is needed for confirmation.
- Bullish Case 📈: If the stock successfully breaks and holds above the current resistance, it could clear the path for a move towards the next major hurdle near the ₹1,100 level.
- Bearish Case 📉: If it is rejected once again and the momentum fades, the stock could pull back to find support near the ₹720 level. The price action in the coming days will be crucial.
Wheelsindia
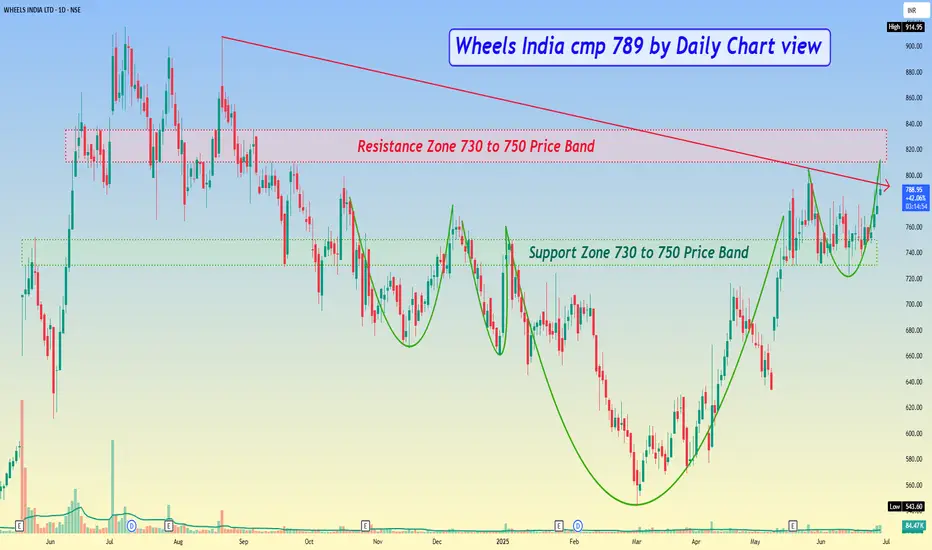
Wheels India cmp 789 by Daily Chart viewWheels India cmp 789 by Daily Chart view
- Support Zone 730 to 750 Price Band
- Resistance Zone 730 to 750 Price Band
- Bullish chart setup indicative of good upside subject to Resistance Zone Breakout happens and sustains
WHEELS FOREVER.India will always need wheels to move forward. NSE:WHEELS looks good to move towards 1000+ levels. Base formation done.

Wheels India, a great entry opportunity!!!Good entry opportunity in Wheels India.
Price is on the trend line, so risk-reward ratio is good.
Can exit with 1:2 target also.
SL can be extended upto 530.

WHEELS INDIA - Potential Weekly breakout - Add to watchlistWHEELS INDIA, as observed in the weekly chart, is currently exhibiting a compelling technical pattern, suggesting the possibility of a significant breakout. The stock has been forming a symmetrical triangle pattern over the past several weeks, indicating a period of consolidation and tightening price movements.
Price Targets:
In the event of a confirmed breakout, traders might consider setting price targets based on the height of the triangle pattern. TARGET 1 & TARGET 2 mentioned in the chart.
