Wipro: Short-Term Trend Shift Likely – Watch for UpsideDescription:
Wipro is forming a potential short-term reversal near a key support zone and price action shows early signs of bullish momentum. A bounce toward the 285 level looks likely if support holds.
Disclaimer:
Not financial advice. Do your own research before trading.
Wiproanalysis
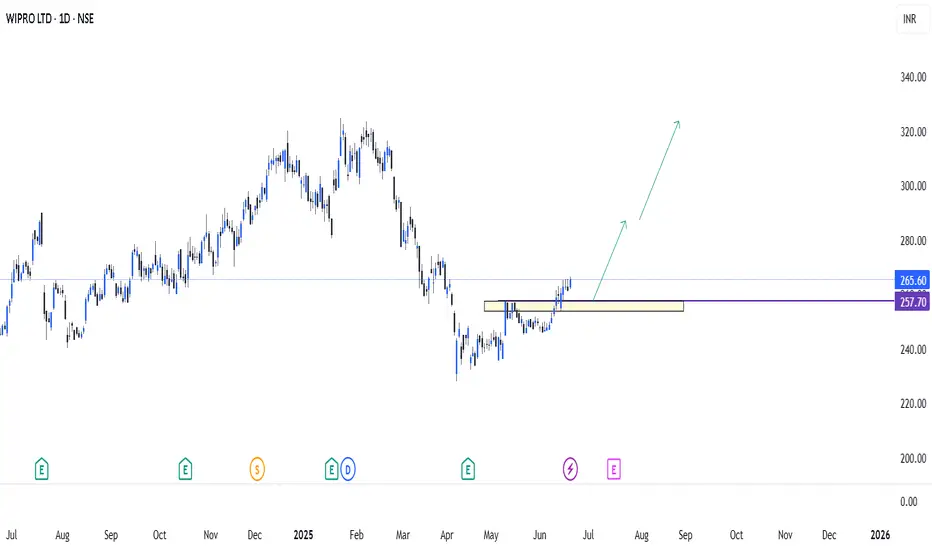
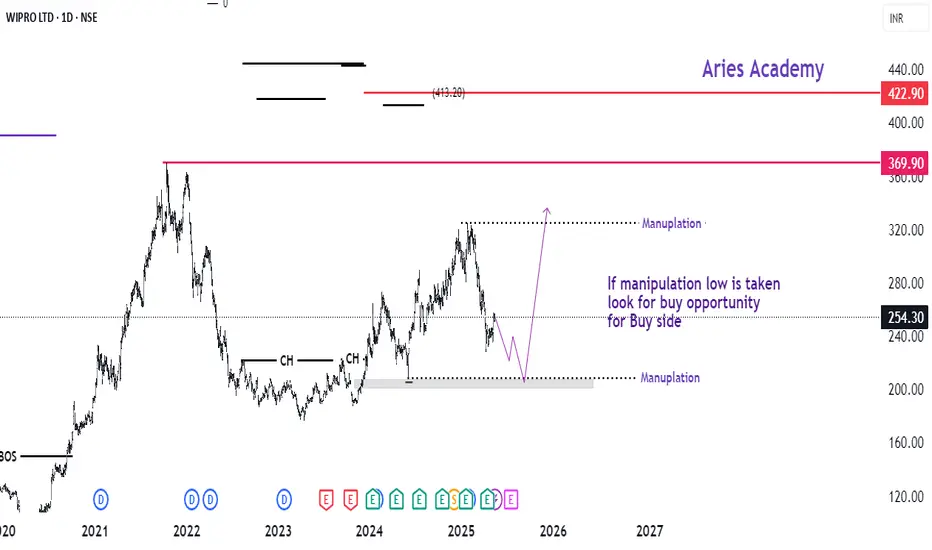
Wipro Buy sideAs per the previous experience, the market will always create some manipulation levels which either one taken if will move fast towards the other side
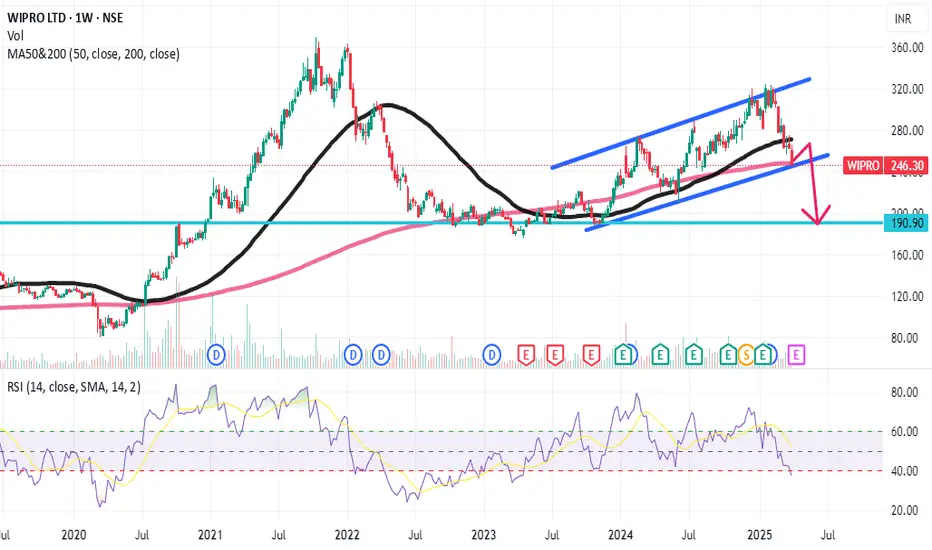
Wipro breakdown Higher probality?A very high probability that stock of Wipro can breakdown from the level. This says channel break. RSI also below 40 levels. This is for your educational purpose only.
Wipro cmp 317.00 by Weekly Chart viewWipro cmp 317.00 by Weekly Chart view
* Resistance Zone 307 to 317 Price Band
* Volumes closing in on avg traded quantity over past few weeks
* Weekly basis Support at 289 > 261 > 233 with Resistance at 340 > ATH 369.90
* Bullish Cup & Handle and/or Double Rounding Bottoms or a very faintly applicable Head & Shoulders pattern done by the neckline at Resistance Zone, as one may interpret

Wipro halting after a gap up opening.Wipro is showing some good chart pattern. The stock has given a gap up opening and took resistance form 303-305 levels.
Watch for a restest of the break out for entry or enter once the resistance levels is breached.
Resistance levels ;- 304, 309.5
Support ;- 294.6, 287.5
Wait for a price action and trade accordingly.


MAJOR TRENDLINE BREAKOUT IN WIPRO ABOVE 530Wipro is giving a major trendline breakout at the level of 530. It is a signal of long in wipro. We can buy this stock at the current level@535 with aSL of 495 on closing basis. Target will be 590 & 640 respectively in a very short term. More upside potential possible up to the level of 700.

Wipro Rising Post-Consolidation: Strong Risk-Reward SetupWipro has been on the rise after a solid consolidation phase, forming higher highs and higher lows. Currently, it’s retracing to a strong level with a favorable risk-to-reward ratio, aiming towards its all-time high (ATH). Ensure you enter trades with a predefined stop loss for safety.

Wipro Weekly AnalysisWipro is good on Long Side. It is a good time to enter in this stock. But this is for long term investments. The stock may give returns up to 44% returns.
Disclaimer:- Please always do your own analysis or consult with your financial advisor before taking any kind of trades NSE:WIPRO

Wipro Ltd | A Strong IT Momentum StockWipro Ltd | A Strong IT Momentum Stock
Wipro Ltd is a global Information technology, consulting and business process services (BPS) company
Financial: strong
Market Cap = 2,41,673 Cr. ROCE = 17.7 % ROE b= 15.9 %
Debt to equity = 0.26 Promoter holding =72.9 % Quick ratio = 2.28
Current ratio = 2.29 Piotroski score = 5.00 Profit Var 3Yrs= 5.30 %
Sales growth 3Years = 14.0 % Return on assets = 10.1 %
you Can see clearly rounding bottom create and good consolidation already done since 2 years.
stock is at good price. also feb retracement is also support in level.
moreover all IT sector is ready become rocket bcz USA market is also in positive trend.
Note: I am not SEBI registered financial Adviser. I solely present my views on chart .I do not charge any kind of service. This is not buy sell recommendation.
If you like my ideas than like boost and follow me for more ideas.
Thanks and comment freely

Large cap fundamentl strong IT stock- WIPROFundamently very good Stock with growth revenue. Aftert breaking the accumulation phase stock has given a good chance to Buyers to buy and put in the portfolio. Buying Zone is about at price 450- 500 . Stock have easy potiential to move toward 700 target.

INVESTMENT PICK - WIPRO - TREND REVERSAL LONG ENTRIESSymbol - WIPRO
Wipro Ltd is a global Information technology, consulting and business process services (BPS) company. It is the 4th largest Indian player in the global IT services industry behind TCS, Infosys and HCL Technologies.
Wipro was in consolidation & accumulation phase from July 2022 to December 23.
After that it broke out of this consolidation zone with good buying volumes & went till 550. Now it is retracing back to breakout zone which is 450.
Wipro is a company with good fundamentals so it can be considered for medium to long term investment.
Wipro CMP - 452
It can be accumulated at current level for long term Investment perspective.
More position can be added at 410 - 415 levels.
Stoploss can be 350 or below 350.
Targets can be 545, 600 & 720 which represents 21%, 35% & 58% upside from current level respectively.
Disclaimer - Do not consider this as a buy/sell recommendation. I'm sharing my analysis & my investment position. You can track it for educational purposes. Thanks!

Bullish Cup and Handle Pattern: Wipro Heading Towards 545Details:
Asset: Wipro Limited (WIPRO)
Pattern: Cup and Handle
Breakout Level: Above handle resistance (specific level not mentioned, assuming current resistance)
Potential Target: 545
Stop Loss: Below breakout level or as per risk tolerance
Timeframe: Short to medium-term
Rationale: Wipro Limited (WIPRO) is forming a cup and handle pattern, which is a bullish continuation pattern. A breakout from the handle could indicate the potential for a significant upward move towards the target of 545.
Market Analysis:
Technical Pattern: The cup and handle pattern is a bullish formation that typically signals further upside. Breaking out from the handle suggests a resumption of the prior uptrend.
Market Sentiment: Positive market sentiment or company-specific catalysts may be supporting the anticipated breakout in WIPRO.
Price Target:
The target for WIPRO is set at 545, based on the cup and handle pattern breakout.
Risk Management:
Implementing a stop loss strategy below the breakout level (handle resistance) is crucial to manage risk in case of unexpected price reversals.
Timeframe:
The projected move towards 545 is based on a short to medium-term outlook, but actual timing may vary based on market conditions.
Risk-Reward Ratio: Consider individual risk tolerance and adjust position size accordingly to maintain a favorable risk-reward ratio.
As with any investment opportunity, conduct thorough analysis and consider factors such as market trends, company fundamentals, and risk management strategies before making trading decisions.

1.5 years long bullish Inverted Head & Shoulder Breakout A Bullish Breakout of Inverted Head and Shoulder pattern is visible on the Daily chart of NSE:WIPRO
The shoulder is exactly at 0.236 fib retracement level. and the target is nearly at 0.50 fib level.
MACD gave Positive crossover on Daily, Weekly and Monthly chart. So, expecting the momentum to continue.
One can create a fresh position in the scrip as per the levels mentioned on the chart.
Risk Disclaimer:
The information provided in this analysis is based on my personal interpretation of market conditions and the available data at the time of writing. It is advisable to seek advice from a qualified financial professional and to conduct your own research before making any investment decisions.

Cup and Handle Pattern in WiproNow Wipro is create Cup and Handle Pattern in Longer timeframe .
Take enter after break the trendline i have draw in chart .
entry level : 501.90-510
StopLoss level : 479-470
Target :
First Target 540
Second Target 625

WIPRO AnalysisThe recent change in the management of WIPRO Ltd has brought a nice 56 Inch wide smile on Veterans who've been tracking the stock.
The CEO under whom, the profitability had reduced, has resigns and in exchange for him, we're finally getting someone who understands the Business and the Company.
I'm anticipating good moves in the stock from CMP.
Here are the details-
CMP- 486
Targets- 500, 520
Stoplsos- 476
Duration- 1-2 weeks
Let me know what you think about it.

Wipro: Bull Ride Long consolidation with huge sell spike in downtrend took sufficient time to recover, recent overall market bullish and some political factor influenced the investor to invest in Indian market. #Wipro looks like one of the hanging fruit for the investor. Recent, investment plan of investing in AI and new projects approvals will attract investors.
My Key support and resistance
* Overall support : 380
* Resistance : 525

Wipro showing bullish strength.Wipro for the intraday trade is looking bullish and has closed around the resistance zone.
The stock after the fall has given a bullish engulfing candle on the daily charts.
It has been respecting the resistance trend line. Even the RSI indicator is showing a bullish divergence in the stock.
If the stock starts trading above 520 levels and sustain above it, a bullish trade can be entered with a target of 525 for intraday.
Target levels :- 525, 533
Entry:- Above 520
If there is a gap up opening in the stock and it comes to retest the break out levels. A bullish trade can be entered after confirming the price action.
Double break out will be there in the stock. Positional/swing trade can also be created, if the stock closed above the levels on the daily front.
Wait for the price action near the levels before entering the market.

WIPRO 5th WaveWIPRO
1st, 2nd, 3rd, 4th wave has completed
5 th wave in formation,
within 5th wave
in smaller cycle
1st,2nd,3rd wave completed
either 4th wave has been completed or can see further retracement of 4th wave
if 4th wave has been completed,5th wave formation will result in upward movement.
this is for educational purpose, not a trading advice, trade with due diligence

WIPRO - heading towards 615 and then 730NSE:WIPRO
cmp 543
WIPRO gave a breakout on weekly chart at 450-460 zone in Dec 2023
made high of 529 and made a small pull back in Jan-Feb
then yesterday broke out above 529 and now heading towards 1st tgt of 615
expecting a pull back at 615 region and then will move on towards 730
The objective of this analysis is knowledge sharing and education. There isn't any buy or sell advise in this article. Every stock is held for a short to medium amount of time and is positional.
It is expected of each person to carry out independent research and evaluation to ascertain whether my perspective is consistent with your studies.

Wipro Long Term Breakout Explained#wipro lately has been giving wild moves and many people including myself are wondering why. I may not know the exact fundamental reason for the move in wipro but as a technical analyst i can share my POV on Wipro technically.
1. Wipro has given a major breakout in the weekly timeframe.
2. After a prolonged period of consolidation in the likes of more than 1 year, 528 days to be exact wipro has broken out of a range and is right now in the middle of a rally.
3. The next possible resistance for wipro is 600.
Happy Trading,
Yamini Prabu
NISM, NSE Certified TA,
Independent Trader/Trainer

Wipro- LongWipro looking bullish and it has formed an ascending triangle pattern. Where we can see the target of 550 to 580 range once it breaks the ascending triangle break line.
Disclaimer- Its only for education purpose and not trading recommendation.

WIPRO (Strong Breakout Candidate)WIPRO has given a clear breakout on the weekly chart. The stock has a possible upside of 515, 565, and 615. Also, strong volume buildup can be seen from the last 4-5 weeks. The stop loss can be placed at the 427 level (Weekly Closing basis).
#WIPRO.
Disclaimer: I am not a SEBI registered analyst. All the stocks are for educational purposes. Investors must consult a financial advisor before making any investment. It is not a buy or sell recommendation.
