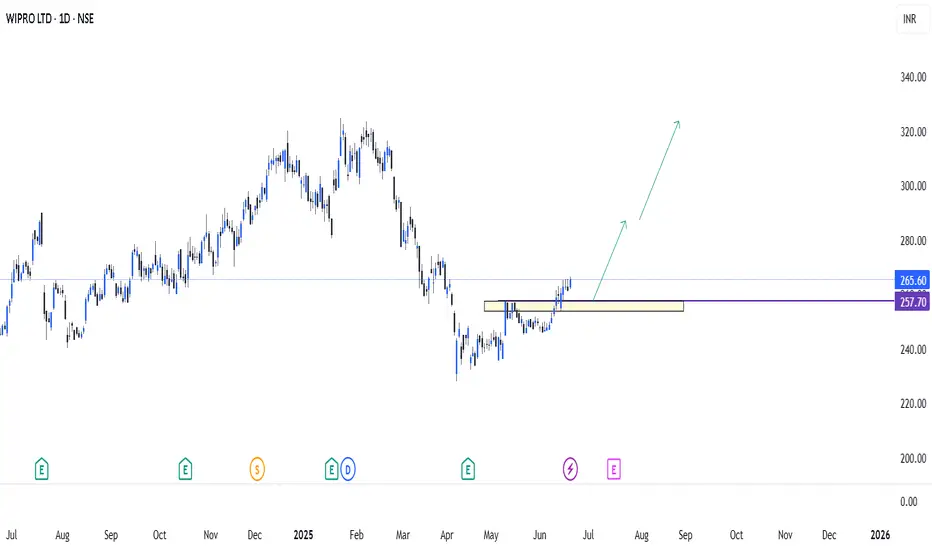
Wipro: Short-Term Trend Shift Likely – Watch for UpsideDescription:
Wipro is forming a potential short-term reversal near a key support zone and price action shows early signs of bullish momentum. A bounce toward the 285 level looks likely if support holds.
Disclaimer:
Not financial advice. Do your own research before trading.
Wiprolong
Wipro halting after a gap up opening.Wipro is showing some good chart pattern. The stock has given a gap up opening and took resistance form 303-305 levels.
Watch for a restest of the break out for entry or enter once the resistance levels is breached.
Resistance levels ;- 304, 309.5
Support ;- 294.6, 287.5
Wait for a price action and trade accordingly.


Bullish Cup and Handle Pattern: Wipro Heading Towards 545Details:
Asset: Wipro Limited (WIPRO)
Pattern: Cup and Handle
Breakout Level: Above handle resistance (specific level not mentioned, assuming current resistance)
Potential Target: 545
Stop Loss: Below breakout level or as per risk tolerance
Timeframe: Short to medium-term
Rationale: Wipro Limited (WIPRO) is forming a cup and handle pattern, which is a bullish continuation pattern. A breakout from the handle could indicate the potential for a significant upward move towards the target of 545.
Market Analysis:
Technical Pattern: The cup and handle pattern is a bullish formation that typically signals further upside. Breaking out from the handle suggests a resumption of the prior uptrend.
Market Sentiment: Positive market sentiment or company-specific catalysts may be supporting the anticipated breakout in WIPRO.
Price Target:
The target for WIPRO is set at 545, based on the cup and handle pattern breakout.
Risk Management:
Implementing a stop loss strategy below the breakout level (handle resistance) is crucial to manage risk in case of unexpected price reversals.
Timeframe:
The projected move towards 545 is based on a short to medium-term outlook, but actual timing may vary based on market conditions.
Risk-Reward Ratio: Consider individual risk tolerance and adjust position size accordingly to maintain a favorable risk-reward ratio.
As with any investment opportunity, conduct thorough analysis and consider factors such as market trends, company fundamentals, and risk management strategies before making trading decisions.

1.5 years long bullish Inverted Head & Shoulder Breakout A Bullish Breakout of Inverted Head and Shoulder pattern is visible on the Daily chart of NSE:WIPRO
The shoulder is exactly at 0.236 fib retracement level. and the target is nearly at 0.50 fib level.
MACD gave Positive crossover on Daily, Weekly and Monthly chart. So, expecting the momentum to continue.
One can create a fresh position in the scrip as per the levels mentioned on the chart.
Risk Disclaimer:
The information provided in this analysis is based on my personal interpretation of market conditions and the available data at the time of writing. It is advisable to seek advice from a qualified financial professional and to conduct your own research before making any investment decisions.

Wipro showing bullish strength.Wipro for the intraday trade is looking bullish and has closed around the resistance zone.
The stock after the fall has given a bullish engulfing candle on the daily charts.
It has been respecting the resistance trend line. Even the RSI indicator is showing a bullish divergence in the stock.
If the stock starts trading above 520 levels and sustain above it, a bullish trade can be entered with a target of 525 for intraday.
Target levels :- 525, 533
Entry:- Above 520
If there is a gap up opening in the stock and it comes to retest the break out levels. A bullish trade can be entered after confirming the price action.
Double break out will be there in the stock. Positional/swing trade can also be created, if the stock closed above the levels on the daily front.
Wait for the price action near the levels before entering the market.

WIPRO 5th WaveWIPRO
1st, 2nd, 3rd, 4th wave has completed
5 th wave in formation,
within 5th wave
in smaller cycle
1st,2nd,3rd wave completed
either 4th wave has been completed or can see further retracement of 4th wave
if 4th wave has been completed,5th wave formation will result in upward movement.
this is for educational purpose, not a trading advice, trade with due diligence

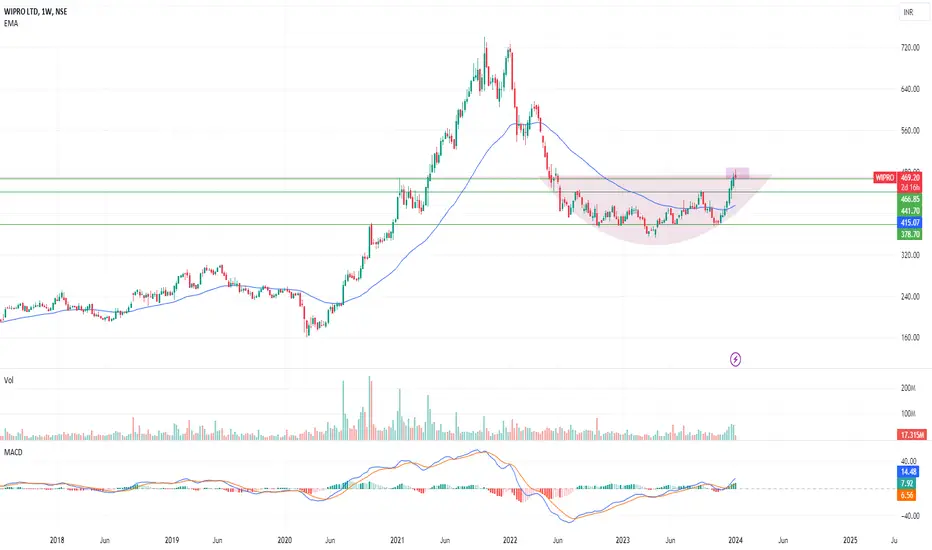
Wipro Long Term Breakout Explained#wipro lately has been giving wild moves and many people including myself are wondering why. I may not know the exact fundamental reason for the move in wipro but as a technical analyst i can share my POV on Wipro technically.
1. Wipro has given a major breakout in the weekly timeframe.
2. After a prolonged period of consolidation in the likes of more than 1 year, 528 days to be exact wipro has broken out of a range and is right now in the middle of a rally.
3. The next possible resistance for wipro is 600.
Happy Trading,
Yamini Prabu
NISM, NSE Certified TA,
Independent Trader/Trainer

Wipro- LongWipro looking bullish and it has formed an ascending triangle pattern. Where we can see the target of 550 to 580 range once it breaks the ascending triangle break line.
Disclaimer- Its only for education purpose and not trading recommendation.

WIPRO Short term and long term view Stock has consolidated good and started making higher high , trend continuation expected if the level are maintained . A classic round bottom in formation , immediate short term trade trigger could be the break of triangle for a good bump .

WIPRO (Strong Breakout Candidate)WIPRO has given a clear breakout on the weekly chart. The stock has a possible upside of 515, 565, and 615. Also, strong volume buildup can be seen from the last 4-5 weeks. The stop loss can be placed at the 427 level (Weekly Closing basis).
#WIPRO.
Disclaimer: I am not a SEBI registered analyst. All the stocks are for educational purposes. Investors must consult a financial advisor before making any investment. It is not a buy or sell recommendation.

Right time to invest in WIPROIn weekly chart we can see after double top price was fall. And whole 2023 reate a strong support at 441.70.
Very Strong Support - 441.70
Now 464 resistance level is breaking. If we see this week creating a red candle but volume is good and as expected price will go higher and touch 500 within couple of month.
It Creating cup and handle pattern.
If we see very carefully couple 7 consecutive 7 week creating green candle with a good volume.
It's a good sign for investor.
Wipro bullish Bulliosh wipro
levels of wipro
next resistance at 550
followed by 700
expecting strong bullish momentum

Long Wipro - Target 830Wipro after fall from 734 to 400 level has taken support near the 61 percentile of fibonacci retracement and is consolidating.
This is long term view based on predictive trend chart.
Long for a target of 830 once it closes above 420 on monthly basis
Very small stop loss will be 380 on monthly closing basis.

Wipro is breaking zone !! still volume has not come, keep eye onWipro is breaking zone !! still volume has not come, keep eye on it
1) Consolidation for 17 months
2) breakout is on the way


WIPRO: 1 Year Cup Ready WIPRO has formed over a 1 year long cup and is poised for breakout and if can sustain. It has fallen over 50% from top and regained 25% from bottom already. RSI is high.

Wipro building the buy momentum📈 Weekly Stock Picks: NSE:WIPRO - Week Starting 4th September, 2023 📈
💡 Rationale for Selection:
📊 Technical Analysis:
Parabolic SAR: Currently showing a sell signal, but the stock has rebounded. 📉➡️📈
Fibonacci Levels: Bounced back from near the 0.618 levels and surpassed the 0.5 levels. Indicates a trend reversal. 🔄
MACD: Expected bottom-up crossover; MACD line (1.3) expected to cross Signal line (2.32) confirming a bullish bias. 📈
Stochastics & RSI: K=23.18, D=9.03, showing the stock has reached oversold territory and is in a position to bounce back. 📈
Percentage R and Fisher 9: Indicate an uptrend is likely in the next 1-2 trading sessions. 📈
📰 Market Indicators:
A surge in IT stocks recently. 📈
Mutual funds are showing increasing interest in IT stocks, expecting a boom. 🤝
🎯 Trade Parameters:
🟢 Entry Price: ₹416.25 (0.382 Fibonacci Levels)
🎯 Target Price: ₹422.20
🔴 Stop Loss: ₹41.75
#WiproLimited #StockPick #TechnicalAnalysis #Fibonacci #MACD #Stochastics #RSI #MutualFunds #ITBoom #WeeklyStockPicks #InvestWisely
📋 Disclaimers and Disclosures:
Risk: Investing in stocks is subject to market risk. Please consult your financial advisor before making any investment decisions. The information provided is only for the education purpose and should not be considered as an investment advice or as stock recommendation. You are requested to take due diligence on your own accord and consult financial advisor, research analyst or a broker before acting on any information on it. We do not confirm any validity or correctness of the information and might change our viewpoint on the stock anytime, as per our discretion and research.
Disclosure: This analysis is purely based on technical indicators and market trends as of 1st September 2023. Past performance is not indicative of future results.
Conflicts of Interest: We may or may not have any vested interest in Wipro Limited as of the date of this report.

WIPRO: BULLISH 450NSE:WIPRO underperforming for past one year, as of weekly time frame, wipro touch crucial support.
If weekly candle cross the trend and closed above it. Take position and fix a stop loss at 380. Target 450.

WIPRO: Forming Reversed Head & Shoulder PatternWipro is forming a reversed Head & Shoulder Pattern.
#Current Price - 414
#Breakout Price - 425
#Expected Target - 495
#Resistance Based Targets
- Target 1 - 443
- Target 2 - 481
#Support Based Targets
- Target 1 - 414
- Target 2 - 399 (Stop Loss)
Pattern is forming on daily chart.
Disclaimer:
This idea is only for education purpose, Please consult your financial advisor.
I am not SEBI registered.
Please give a Like if you like.

WIPRO Hourly Chart suggest 9% upsideWIPRO Hourly Chart suggest 9% upside in 20-30 days
LTP 407
SL 398
Target - 425 / 440+
Timeframe - 20-30 days

Wipro Trendline Breakout on Weekly ChartAfter a long consolidation and downtrend, Wipro started forming HH and HL, It's value buy between 400-415. Also it has given trendline breakout on weekly chart with good buying volume. Expecting targets 500 soon.

Technical Analysis: Wipro's Potential Breakout Hello traders! Today, we'll dive into an exciting technical analysis of Wipro, a prominent IT company and a part of the Nifty 50. I'll walk you through some essential concepts and terms while dissecting the current market situation. Please note that this analysis is for educational purposes only, and I am not a SEBI registered analyst.
📊 Key Details 📈
Wipro has been in a downtrend since October 2021 until March 2023. However, things seem to be changing now. Starting from December 2022, Wipro has formed an inverted head and shoulders pattern, which indicates a potential trend reversal. Today, we see the head and shoulders pattern breaking, but it's too early to confirm the breakout. We need to wait for the market to close, or we can initiate a trade five minutes before the closing bell if the breakout sustains.
There is a critical resistance zone for Wipro, ranging from 417 to 413. If Wipro manages to sustain above this level today, it might present a good opportunity for a buy trade. Additionally, analysing the volume chart, we can observe a significant surge in volume over the last three days, adding more weight to the breakout trade setup.
💡 Educational Insights 💡
Before we proceed further, let's briefly explain some important technical terms:
1. Head and Shoulders Pattern : This pattern indicates a trend reversal and consists of three peaks, with the middle peak (the head) being the highest, flanked by two smaller peaks (the shoulders). A breakout above the pattern's neckline signifies a potential upward move.
2. Resistance Zone : It's a price range where a significant number of sellers are present, preventing the price from rising further.
3. Volume Analysis : Volume measures the number of shares or contracts traded during a given period. A surge in volume can validate the strength of a price move.
💬 Like, Comment, and Follow! 💬
If you find this analysis helpful, don't forget to show your support by liking and commenting! I appreciate your observations and feedback, as it keeps me motivated to write consistently.
👉 Follow me on TradingView for more articles and trade setups: in.tradingview.com 👈
🚀 Stay Inspired and Keep Trading! 🚀
Remember, trading can be both thrilling and challenging. Always approach it with discipline and a learning mindset. With the right knowledge and analysis, you can unlock opportunities in the markets!
Keep exploring and happy trading! 📊📈🤝
